
Unconventional Gas Market Size and Share
Market Overview
| Study Period | 2021 - 2031 |
|---|---|
| Forecast Data Period | 2026 - 2031 |
| Historical Data Period | 2021 - 2024 |
| Growth Rate | 2.05 % |
| Fastest Growing Market | Asia Pacific |
| Largest Market | North America |
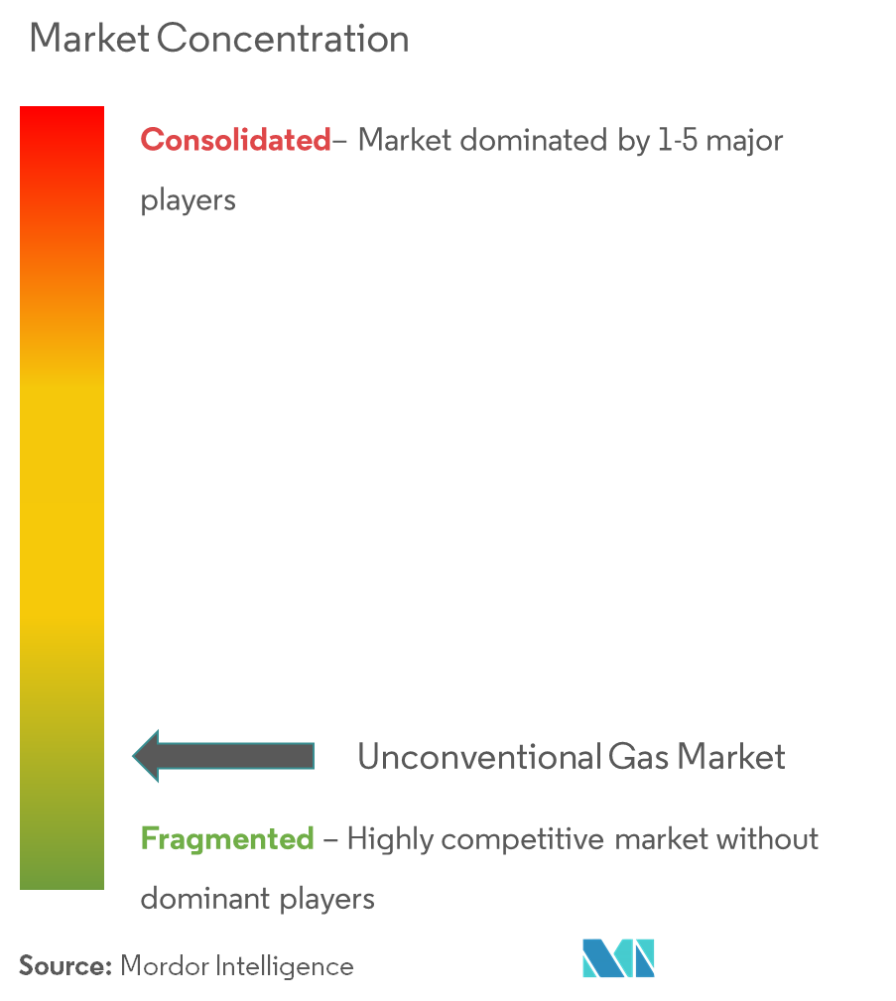
| Market Concentration | Low |
Major Players *Disclaimer: Major Players sorted in no particular order Image © Mordor Intelligence. Reuse requires attribution under CC BY 4.0. | |
Unconventional Gas Market Analysis by Mordor Intelligence
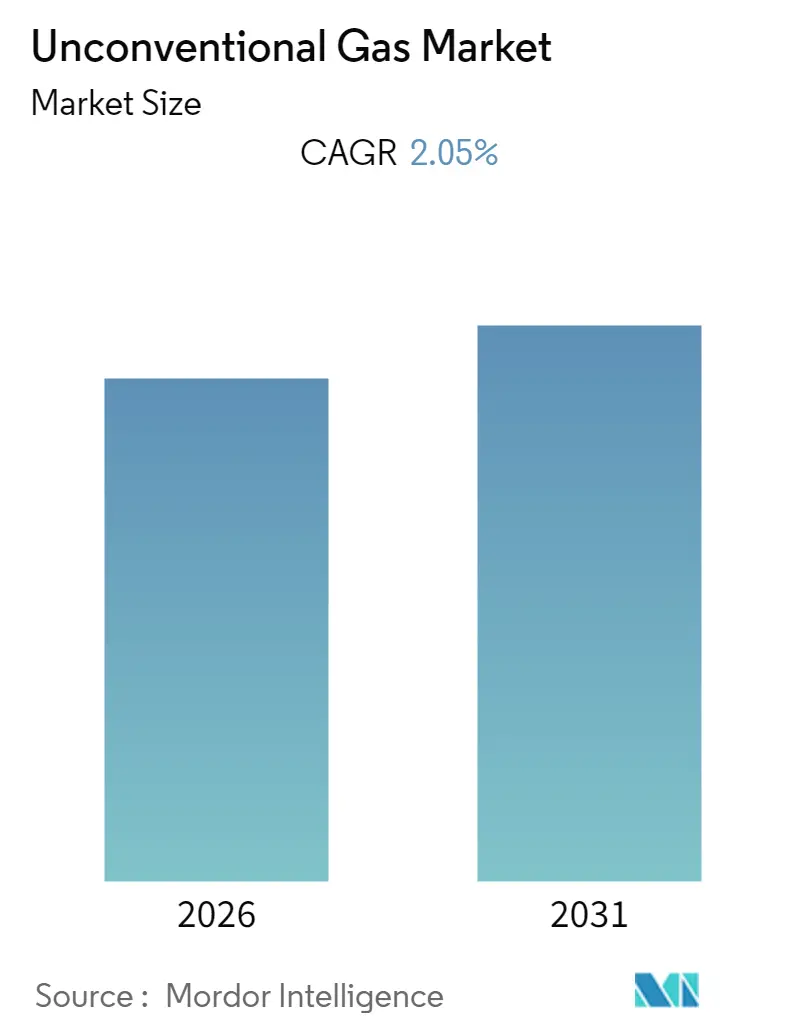
The Unconventional Gas Market size is expected to register a CAGR of 2.05% during the forecast period.
- The increasing demand for natural gas in various industries supported a growing awareness that it emits less carbon content compared to coal; therefore, it could be used as a clean energy source for many countries that are presently dependent on coal. The significantly proved abundance of unconventional gas resources across the world and the competitive price of unconventional gas are vital factors, which is the possible opportunity for rising of the unconventional gas market.
- Global gas consumption is estimated to have grown by 3.7% year-over-year, in 2018, more than double the 1.5 average growth rate from 2010 to 2018, and this growth may extend furthermore in the coming future.
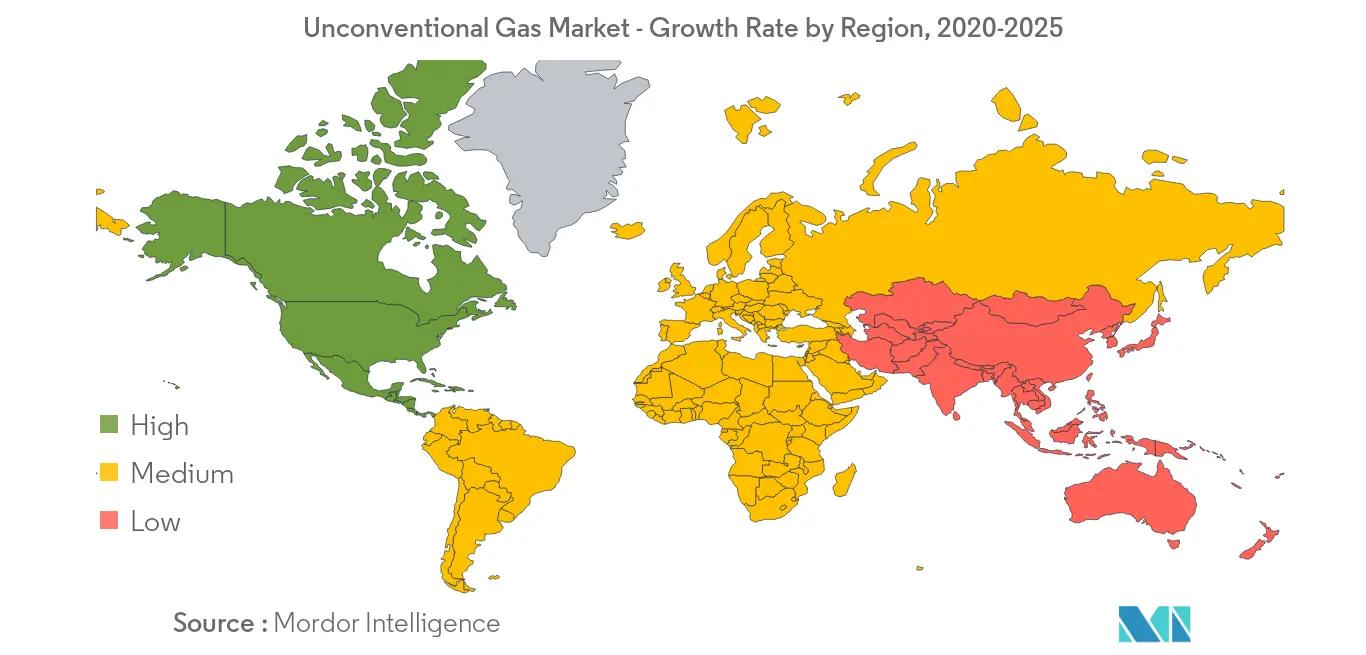
- The North American natural gas market holds the most significant production by volume, and it is expected to be the largest market in the global unconventional gas markets during the forecast period.
Note: Market size and forecast figures in this report are generated using Mordor Intelligence’s proprietary estimation framework, updated with the latest available data and insights as of 2026.
Global Unconventional Gas Market Trends and Insights
Shale Gas to Dominate the Market
- Natural gas prices are down in some regions, and fluctuate repeatedly, and the unconventional gas prices could drop even farther.
- However, oil and gas production from conventional sources continues to decline because of an increase in the number of maturing fields. As the demand for natural gas is anticipated to rise in the future, the price of natural gas is also likely to rise, which, in turn, is expected to be instrumental in the investment decisions for exploration and production of unconventional gas.
- Unconventional sources of gas gained much attention of late, due to their significant contribution to gas production in the United States. Recently, Argentina, Australia, Poland, and China are either planned to explore and produce unconventional gas or are already in the business of unconventional gas.
- Countries, such as Saudi Arabia, Qatar, Kuwait, Iran, and Nigeria, are concerned about the rapid development of unconventional gas, primarily shale gas, because the economies of these countries depend upon the oil price.


North America to Dominate the Market
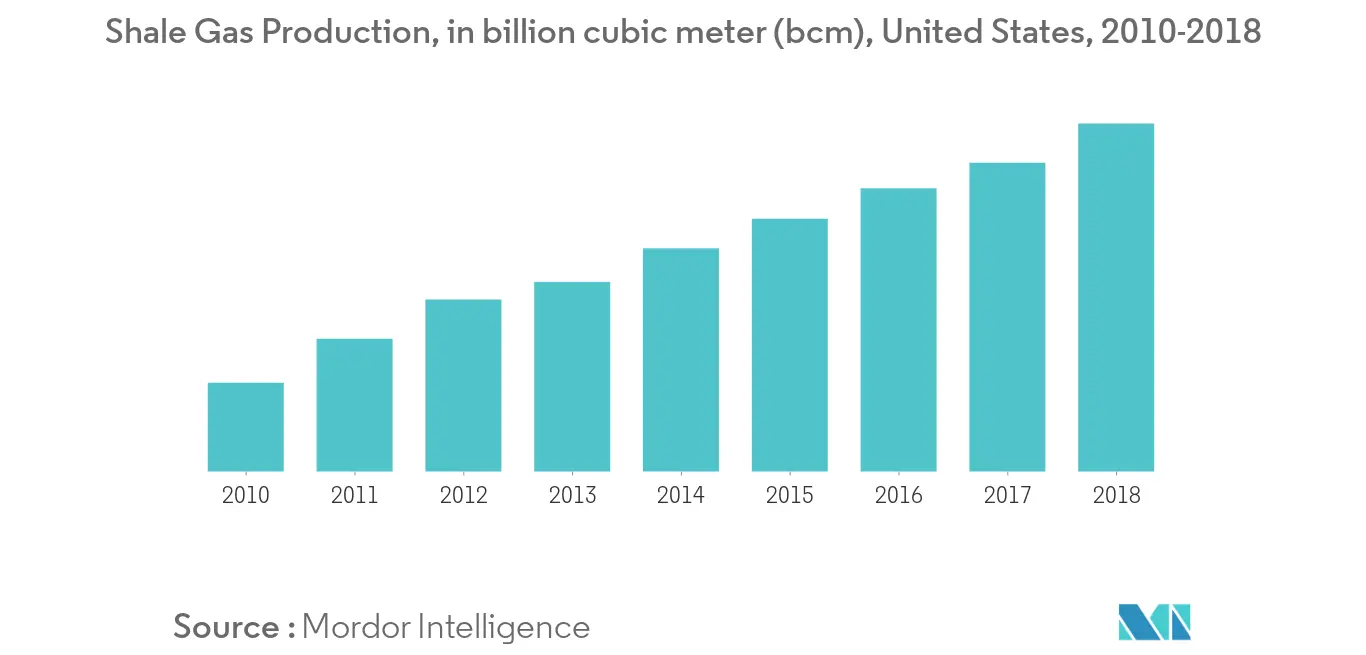
- In 2018, EIA estimate that only the US had produced 20.012 trillion cubic feet of natural gas from shale and Coal bed methane (CBM).
- The United States now wants to increase its exporting capacity by developing more advanced infrastructure in transportation and increase its share in the natural gas exporting market.
- Canada is known to have significant conventional gas reserves, and the country was a key supplier of natural gas to the United States for decades until the recent shale boom in the United States. However, with conventional natural gas sources in decline, the Canadian industry is turning to unconventional sources, including shale gas.
- Many oil and gas industries are now exploring and developing shale gas resources in Alberta, British Columbia, Quebec, and New Brunswick, which could balance the difference in shale gas production in the coming future.

Regulatory Landscape
Regulation of unconventional gas continues to tighten around methane, VOCs, and flaring, with the United States remaining a key reference market due to US EPA rules for new and existing oil and gas sources. In March 2024, the US EPA finalized NSPS OOOOb/c standards covering greenhouse gas and VOC controls. In December 2025, it issued a final rule extending certain compliance deadlines, including for control devices, equipment leaks, and storage vessels, into 2026 (June 1, 2026 and November 30, 2026, depending on the requirement). In April 2026, the US EPA finalized technical revisions that adjust operational details such as limited emergency flaring allowances and net heating value monitoring requirements for flares and enclosed combustion devices, indicating ongoing rulemaking iteration rather than a settled compliance endpoint.
China is also shaping the operating envelope for shale gas and related unconventional production through national standards and safety specifications. SAMR/SAC released GB/T 33296-2025 (quality requirements and test methods for shale gas products), effective November 1, 2025, while the Ministry of Emergency Management issued AQ 2076-2025 in January 2026 for safety specifications related to shale gas platform capacity expansion. SAMR/SAC further updated upstream planning requirements with GB/T 34163-2026 (technical specifications for shale gas development plans), effective December 1, 2026, reflecting an emphasis on standardization of development planning and safer scaling of domestic shale operations.
Value Chain Analysis
The unconventional gas value chain runs from acreage access and licensing to subsurface appraisal, drilling and completions (including hydraulic fracturing), and then field production operations. After that, gas gathering and processing feed long-haul transport via pipelines, before delivery to domestic users or LNG export chains. Upstream execution depends on oilfield services and equipment, including rigs, pressure pumping fleets, proppant, chemicals, and monitoring systems, while midstream constraints often determine realized wellhead economics.
In the United States, takeaway additions have been used to unlock upstream volumes. The Matterhorn Express Pipeline began operations in October 2024 with 2.5 Bcf/d of Permian Basin takeaway capacity, addressing a recurring bottleneck between shale output and downstream demand centers. Project structures in emerging unconventional basins increasingly connect upstream shale development with downstream LNG monetization and export infrastructure. In Argentina, YPF, Eni, and XRG signed a joint development agreement in February 2026 for the Argentina LNG project tied to Vaca Muerta resources, targeting 12 MMtpy and aligning upstream supply with LNG offtake. In Australia, Formentera Partners and INPEX announced a March 2026 joint venture to accelerate development in the Beetaloo Basin, with the value chain extending through appraisal infrastructure and potential incremental LNG integration. Technology is also shifting from discrete tools to system-level workflows: in June 2026, Chevron and Halliburton reported deployment of a fully autonomous, closed-loop fracturing system in an unconventional asset in Colorado, reinforcing the role of data, sensing, and automation in lowering cycle time and improving consistency in tight reservoirs.
Competitive Landscape
The unconventional gas market is fragmented due to many companies operating in the industry. The key players in this market include Royal Dutch Shell Plc, Exxon Mobil Corporation, Chevron Corporation, PetroChina Company Limited, ConocoPhillips, Arrow Energy, and Total SA.
Unconventional Gas Industry Leaders
Royal Dutch Shell plc
ExxonMobil Corporation
Chevron Corporation
ConocoPhillips
- *Disclaimer: Major Players sorted in no particular order

Market Opportunities and Future Outlook
Opportunities in unconventional gas are increasingly linked to (a) scaling recovery and operational efficiency in mature shale basins and (b) integrating newer unconventional provinces into gas and LNG value chains. Government-backed technology programs create near-term whitespace for operators and service companies focused on fracture characterization and produced-water solutions. In July 2026, the US Department of Energy announced up to USD 150 million in funding for cost-shared projects aimed at enhancing unconventional oil and gas recovery, including hydraulic fracture characterization and produced water management. This supports demand for advanced subsurface diagnostics, water handling and recycling, and field-scale pilots that can translate into repeatable completion designs.
National resource development and contracting activity is also creating entry points for services and supply chains beyond North America. In Saudi Arabia, Aramco awarded Halliburton a multi-year contract for integrated stimulation and completion services for unconventional gas development at the Jafurah field (July 2026), highlighting sustained demand for large-scale pressure pumping, integrated completion workflows, and digital-enabled execution. In China, ongoing unconventional development is supported by both resource confirmation and standardization: PetroChina reported progress in Shanxi with over 4 bcm per year capacity at the Daji Gas Field (March 2026), and authorities approved over 50 bcm of proven reserves for a major coalbed methane field (July 2026). Updated national standards (GB/T 34163-2026) also formalize shale development planning requirements. Together, these actions point to opportunities for operators, service providers, and equipment vendors that can localize fracturing fleets, electrification-ready power systems, methane-control solutions, and midstream connectivity for new and expanding unconventional gas hubs.
Recent Industry Developments
- June 2026: Chevron submitted a USD 13.8 billion unconventional oil and gas development proposal for its El Trapial-Este block in Argentinas Neuquen province under the countrys Large Investment Incentive Regime (RIGI). The filing puts a major capital program into an incentive-backed framework that can accelerate infrastructure buildout and supply chain commitments for Vaca Muerta-scale development.
- February 2026: Shell entered into a definitive agreement to acquire ARC Resources Ltd, adding scale in Canadas Montney shale and expanding access to low-cost gas resources. The deal strengthens integration options between upstream shale supply and downstream LNG-related demand, while reshaping competitive positioning among unconventional gas producers in North America.
- October 2024: The Matterhorn Express Pipeline commenced operations, adding 2.5 Bcf/d of natural gas takeaway capacity from the Permian Basin. By easing a key midstream bottleneck, the project improves evacuation optionality for associated gas from shale-focused liquids plays and supports higher utilization across gathering, processing, and long-haul transport assets.


Research Methodology Framework and Report Scope
Market Definition and Coverage
For this study, the unconventional gas market covers natural gas produced from unconventional reservoirs and then sold or consumed as a gas commodity. It includes shale gas, tight gas, and coal bed methane (CBM), with global coverage across major producing and consuming regions.
Scope exclusions: This sizing does not include midstream transportation and storage fees, LNG liquefaction and regasification services, or downstream gas distribution margins.
Segmentation Overview
- Type
- Shale gas
- Tight gas
- Coal Bed Methane (CBM)
- Others (Gas Hydrate, Synthetic Natural Gas, Etc.)
- Geography
- North America
- Asia-Pacific
- Europe
- South America
- Middle-East and Africa
Data Sources, Market Sizing, and Validation
Desk Research
Desk research was used to build the starting data spine for the model, with assumptions anchored to observable gas market signals. Public sources such as the US Energy Information Administration, International Energy Agency releases, national energy ministries, and regulator-level production statistics helped align on production volumes and regional activity patterns.
We also reviewed datasets and commentary from trade bodies and open industry portals, including methane and flaring programs, upstream licensing updates, and petroleum statistics bulletins, to sense-check turning points. Company filings, annual reports, and investor presentations were used to understand capital allocation, drilling and completion pace, and exposure to shale, tight, and CBM plays. Where needed, paid subscriptions for company financials and intelligence, plus a patent database, supported cross-checks on operator scale and technology direction. These examples are not exhaustive, and other public sources were reviewed for data collection, validation, and clarification.
Primary Interviews and Surveys
Primary work focused on validating what the desk data cannot fully explain, especially cost curves, price realization practices, and near-term activity changes that do not yet appear in annual statistics. We spoke with upstream operators, service-side participants, and industry experts across APAC, EMEA, and the Americas so regional supply dynamics and demand pull (power, industrial, and city-gas exposure) could be interpreted consistently.
Distribution of primary research fieldwork respondents
| Company type | Respondent position | Region |
|---|---|---|
| Top tier: 37% | CXOs: 18% | APAC: 52% |
| Mid tier: 41% | Functional/Unit leaders: 27% | EMEA: 29% |
| Smaller Players: 22% | Managers: 55% | Americas: 19% |
Market-Sizing & Forecasting
Sizing starts with a top-down build that reconstructs the addressable unconventional gas pool using country and basin-level production indicators, then translates the pool into market value using realized gas price references and regional mix. The total is then corroborated with selective bottom-up approximations, such as sampled volume by play multiplied by typical price realizations, and channel checks on marketed gas versus reinjection and flaring, so totals can be adjusted when gaps appear.
Key inputs used in the model include unconventional gas production volumes by type (shale, tight, and CBM), rig and completion activity as a directional leading indicator, well productivity trends, regional gas price markers and contract structures, and policy signals that influence supply such as methane rules and permitting pace. When data is missing for smaller producing pockets, proxies such as neighboring basin productivity and published reserve and resource commentary are applied, then normalized back to national totals.
For forecasting, scenario analysis is used, then translated into a single base case after primary feedback confirms the likely drilling cadence and price outlook. In practice, volumes are projected first, and value is calculated with a clear assumption set for price progression and regional mix, which keeps year-to-year changes explainable.
Data Validation & Update Cycle
Validation is done through repeated cross-checks between the model outputs and independent signals, including production statistics, price movements, and activity indicators that usually move earlier than annual reports. If a region shows an abnormal jump, the drivers are traced back to volume, price, or mix changes, and the assumption is re-tested through follow-up expert outreach.
Before sign-off, the work is reviewed in steps so unit logic, currency conversion timing, and year mapping stay consistent across regions. The report is refreshed annually, and interim updates are done when there are material events such as policy shifts, sharp price resets, or major supply disruptions. Right before delivery, a final data pass is completed so the numbers reflect the latest available public releases.
Mordor Intelligence's Unconventional Gas Market Size Versus Other Published Estimates
Published market values for unconventional gas can look far apart even when the topic sounds identical, because scope and counting logic can shift in small but important ways. Differences usually show up in whether an estimate is tied to upstream gas commodity value, a wider energy value chain, or a mixed approach that blends production and services.
Some sources extend the market to include midstream and LNG value chain items, and that naturally inflates the USD total. For Mordor Intelligence, the estimate is limited to unconventional gas types (shale, tight, and CBM) and is sized using production-linked value signals, rather than adding infrastructure or downstream distribution margins.
Benchmark comparison
| Source | Market Size | Gaps in Research Methodology |
|---|---|---|
| Mordor Intelligence | USD 0.00 B (2024) | |
| Trade Journal B | USD 230.50 B (2024) | This estimate is presented as a broad global unconventional gas market value and may include application-led interpretations that can blend upstream gas value with adjacent infrastructure economics, which can lift totals in high price years. |
| Industry Association A | USD 178.20 B (2021) | The figure is anchored to an earlier base year and a different price environment, and the publication style suggests it may not apply the same consistent price realization and regional mix checks across shale, tight, and CBM. |
The table shows that year selection, included value-chain elements, and the way gas prices are carried into the model can explain a wide spread. By keeping variables traceable to production, mix, and price signals, we get an estimate that is easier to replicate and to update when the underlying market indicators change.


Key Questions Answered in the Report
What is the current Unconventional Gas Market size?
The Unconventional Gas Market is projected to register a CAGR of 2.05% during the forecast period (2026-2031)
Who are the key players in Unconventional Gas Market?
Royal Dutch Shell plc, ExxonMobil Corporation, Chevron Corporation and ConocoPhillips are the major companies operating in the Unconventional Gas Market.
Which is the fastest growing region in Unconventional Gas Market?
Asia Pacific is estimated to grow at the highest CAGR over the forecast period (2026-2031).
Which region has the biggest share in Unconventional Gas Market?
In 2025, the North America accounts for the largest market share in Unconventional Gas Market.
What years does this Unconventional Gas Market cover?
The report covers the Unconventional Gas Market historical market size for years: 2020, 2021, 2022, 2023 and 2024. The report also forecasts the Unconventional Gas Market size for years: 2026, 2027, 2028, 2029, 2030 and 2031.
Page last updated on:


 Your data is secure and never sold or shared.


