Market Overview
| Study Period | 2021 - 2031 |
|---|---|
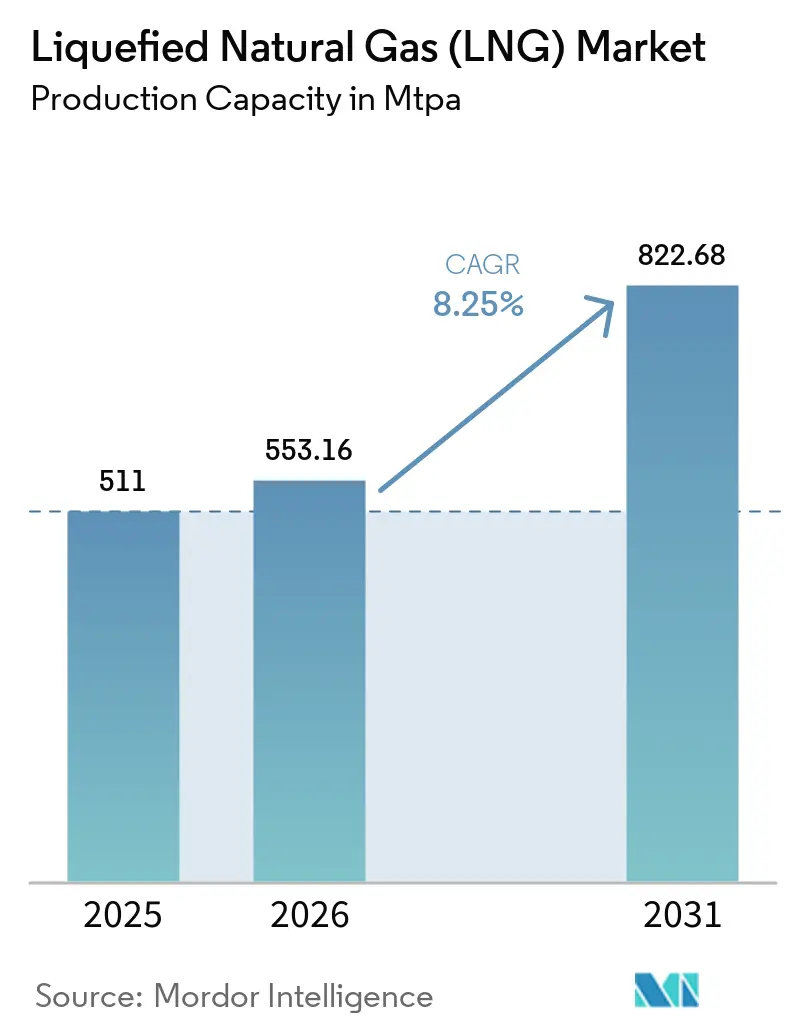
| Market Volume (2026) | 553.16 MTPA |
| Market Volume (2031) | 822.68 MTPA |
| Growth Rate (2026 - 2031) | 8.25% CAGR |
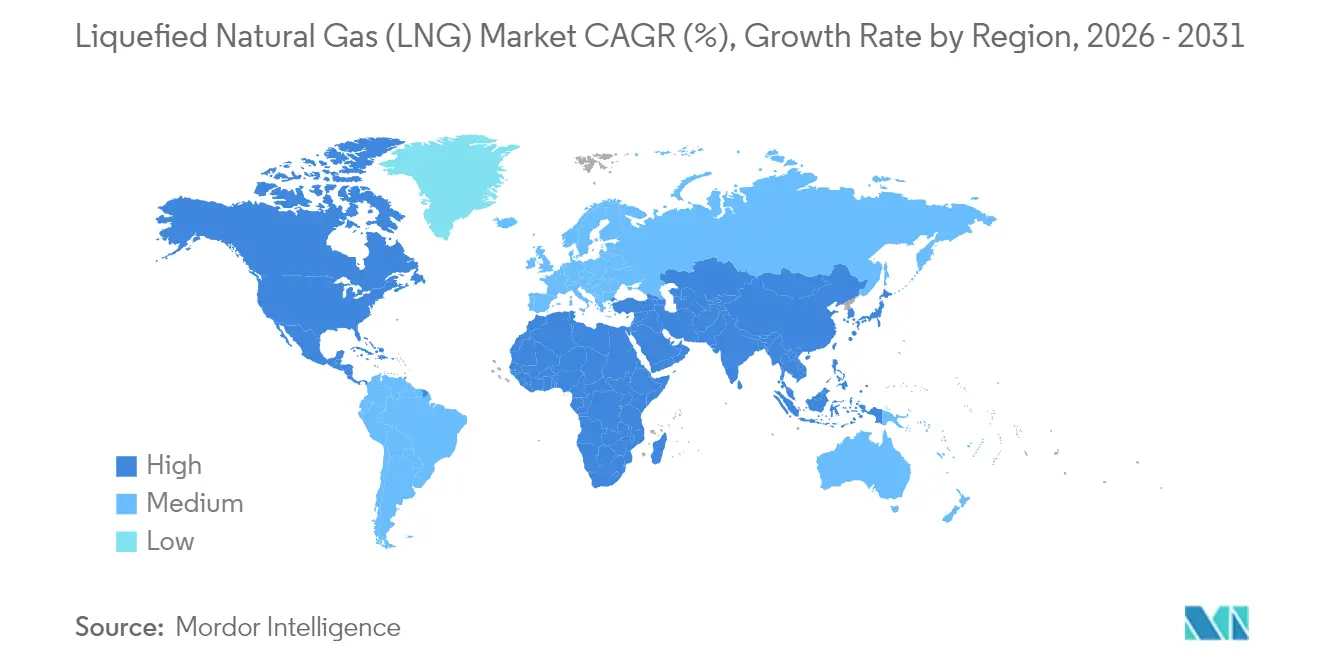
| Fastest Growing Market | North America |
| Largest Market | Middle East and Africa |
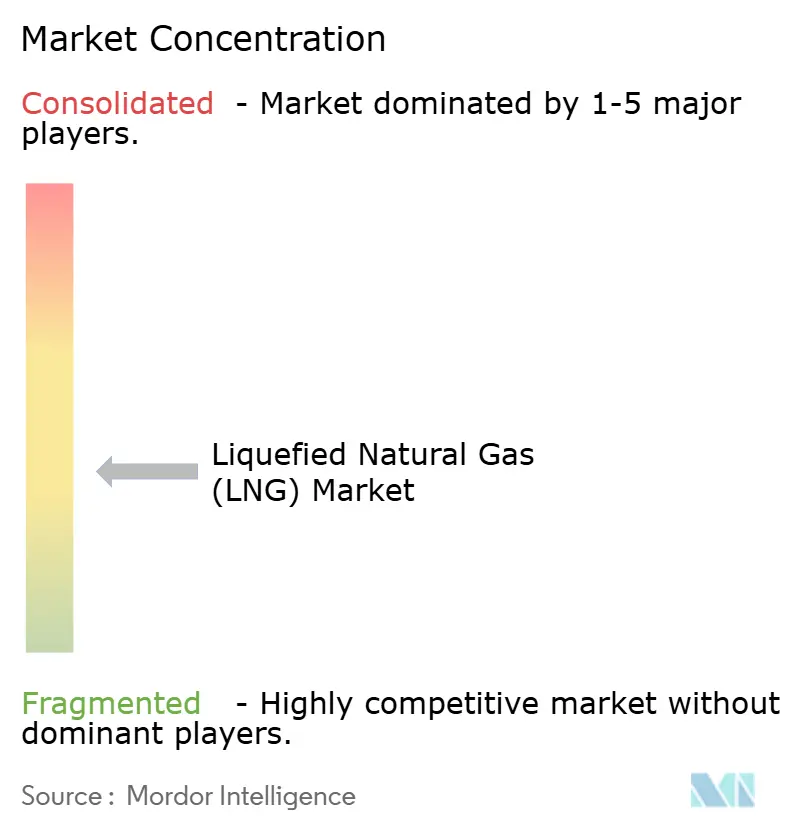
| Market Concentration | Medium |
Major Players *Disclaimer: Major Players sorted in no particular order Image © Mordor Intelligence. Reuse requires attribution under CC BY 4.0. | |
Liquefied Natural Gas (LNG) Market Analysis by Mordor Intelligence
Liquefied Natural Gas Market size in 2026 is estimated at 553.16 MTPA, growing from 2025 value of 511 MTPA with 2031 projections showing 822.68 MTPA, growing at 8.25% CAGR over 2026-2031.
Energy-security goals and decarbonization mandates are steering governments and utilities toward LNG as a transitional fuel, while the rapid adoption of floating LNG technology broadens supply options and unlocks previously stranded offshore resources. North American export terminals enjoy low-cost feedgas from the Permian Basin, marine shipping is pivoting to LNG for sulfur-cap compliance, and electrification plus carbon-capture upgrades are advancing operational sustainability. Technology-driven cost management and flexible contract structures are reshaping trade patterns, yet prolonged EPC inflation and the rise of renewable hydrogen remain watchpoints for the lng market.
Key Report Takeaways
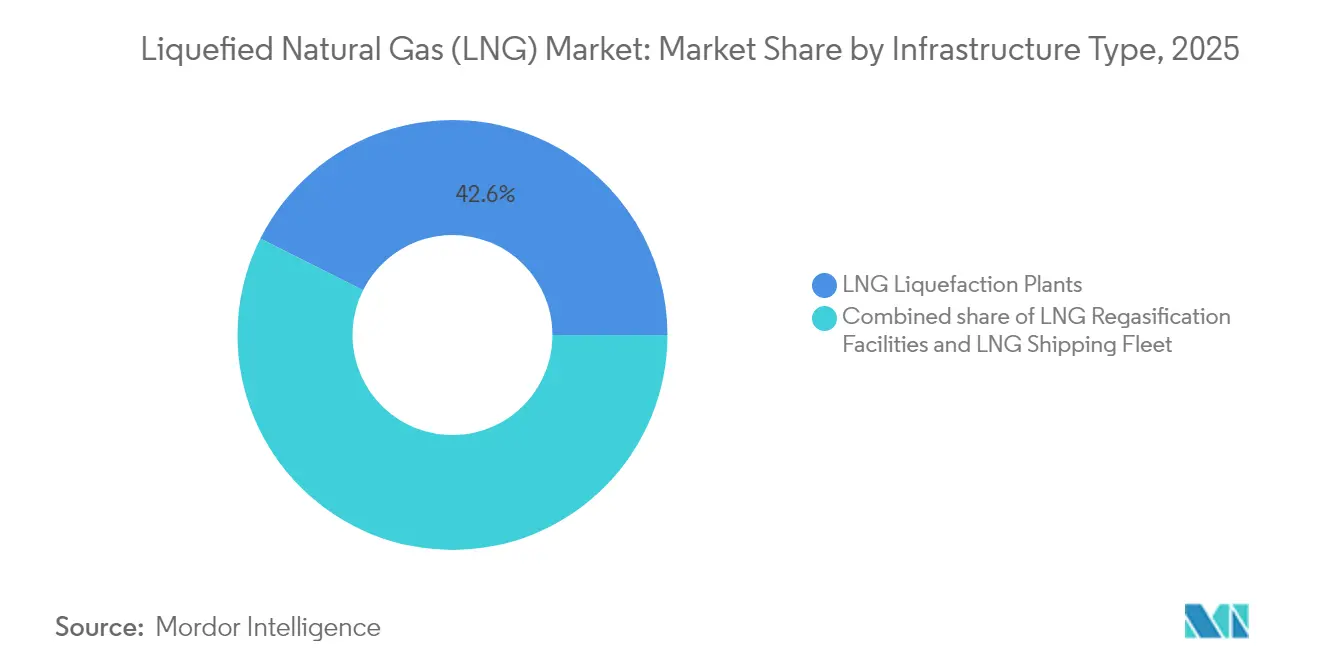
- By infrastructure type, liquefaction plants led with a 42.60% liquefied natural gas market share in 2025, and the segment is expected to post the highest 10.75% CAGR to 2031.
- By end-use application, power generation held 37.70% of the lng market size in 2025, while marine bunkering is projected to expand at a 13.55% CAGR through 2031.
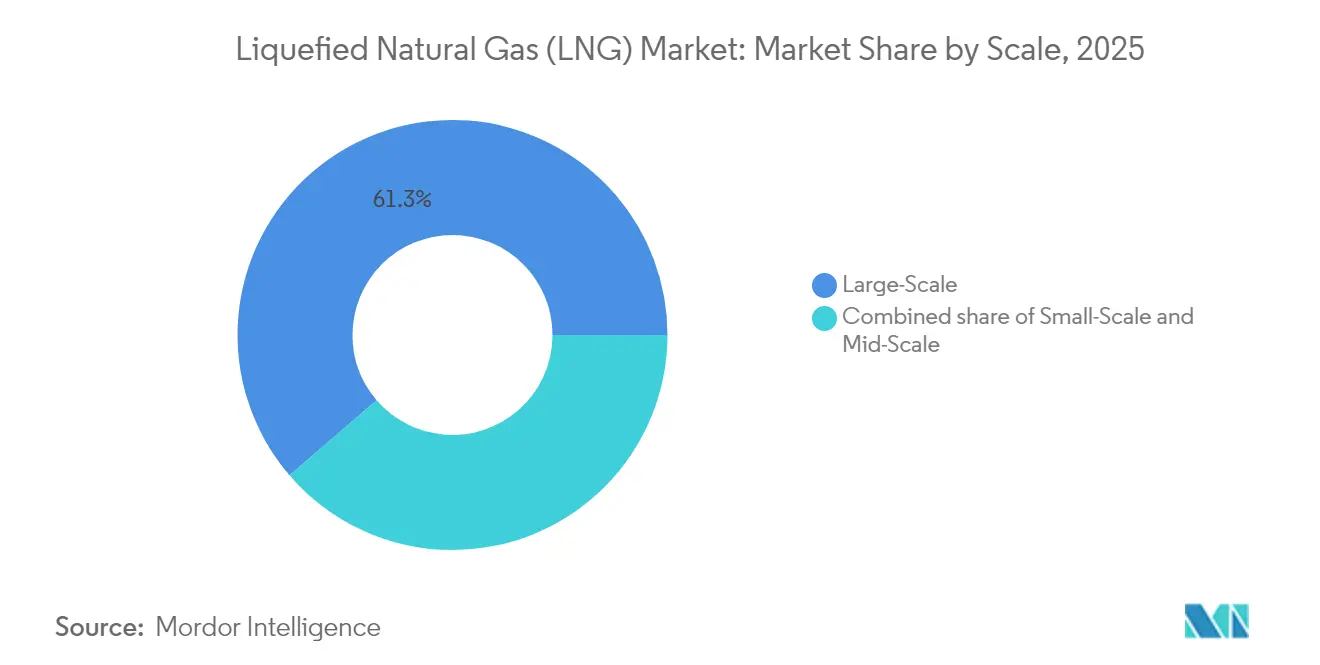
- By scale, large-scale facilities accounted for 61.30% of the liquefied natural gas market size in 2025; small-scale units are forecast at a 14.4% CAGR between 2026-2031.
- By location, onshore facilities captured 77.40% of the lng market share in 2025, whereas offshore solutions will grow at a 10.45% CAGR.
- By geography, the Middle East & Africa commanded 27.60% of 2025 revenue, and North America is set to record a 10.25% CAGR to 2031.
- Shell controlled 16.80% of global LNG trading volume in 2025, the largest single-company share in the liquefied natural gas market
Note: Market size and forecast figures in this report are generated using Mordor Intelligence’s proprietary estimation framework, updated with the latest available data and insights as of 2026.
Global Liquefied Natural Gas (LNG) Market Trends and Insights
Drivers Impact Analysis*
| Driver | (~) % Impact on CAGR Forecast | Geographic Relevance | Impact Timeline |
|---|---|---|---|
| Surge in Asia-Pacific Gas-to-Power Projects | +2.50% | Asia-Pacific, Middle East & Africa | Medium term (2-4 years) |
| Rapid Uptake of LNG as Marine Bunker Fuel | +1.80% | Europe, North America, Asia-Pacific | Short term (≤ 2 years) |
| Permian Basin Associated Gas Output | +1.30% | North America, global | Medium term (2-4 years) |
| Floating LNG Technology Unlocking Stranded Fields | +0.90% | Middle East & Africa, Asia-Pacific | Medium term (2-4 years) |
| China coal-to-gas switching for boilers | +0.7% | Asia-Pacific | Short term (≤ 2 years) |
| Data-center demand for firm low-carbon supply | +0.6% | North America, Europe | Long term (≥ 4 years) |
| Source: Mordor Intelligence | |||


Surge in Asia-Pacific Gas-to-Power Projects Seeking Midstream LNG Offtake Agreements
Asia-Pacific utilities are adding over 100 bcm of new regasification capacity, and India plans to lift gas consumption 60% by 2030. National decarbonization targets are accelerating coal-to-gas switching and prompting integrated contracts that link LNG supply directly to power-purchase deals. This tight coupling lowers financing risk, improves project bankability, and reinforces long-run demand for the liquefied natural gas market.
Rapid Uptake of LNG as Marine Bunker Fuel Following IMO-2020 Sulfur Cap in Europe
The global LNG-fueled fleet grew 33% in 2024 to 638 vessels and is expected to exceed 1,200 ships by 2028.[1]SEA-LNG, “2025 LNG Bunkering Infrastructure Update,” sea-lng.org Container lines represent 60% of LNG-propelled deadweight tonnage, driving accelerated bunker-infrastructure rollout in 198 ports. The liquefied natural gas market is picking up additional momentum from bio-LNG initiatives that extend compliance into future emissions-control regimes.
Permian Basin Associated Gas Output Unlocks Low-Cost Feedgas for U.S. Gulf-Coast Export Terminals
Permian gas production touched 25 Bcf/d in 2024, underpinning Henry-Hub-linked export contracts that attract buyers looking for pricing diversity[2]U.S. Energy Information Administration, “Short-Term Energy Outlook,” eia.gov .Pipelines such as Matterhorn Express are easing takeaway constraints, stabilizing feedgas costs, and reinforcing the competitiveness of the liquefied natural gas market.
Floating LNG Technology Unlocking Stranded Offshore Gas Fields in Africa
Projects like Tortue FLNG started service in late 2024, proving modular liquefaction’s ability to monetize remote fields quickly.[3] International Energy Agency, “Gas 2025 Market Report,” iea.org Lower upfront capital, faster schedules, and access to European buyers diversify supply and strengthen Africa’s role in the liquefied natural gas market.
Restraints Impact Analysis*
| Restraint | ( ) % Impact on CAGR Forecast | Geographic Relevance | Impact Timeline |
|---|---|---|---|
| Prolonged FID delays due to EPC-cost inflation | −1.2% | North America, Australia | Medium term (2-4 years) |
| Renewable hydrogen reducing long-term LNG appetite | −0.8% | Northeast Asia | Long term (≥ 4 years) |
| Regulatory moratoria on new export permits | −0.6% | North America | Short term (≤ 2 years) |
| Geopolitical risk raising insurance costs | −0.4% | Middle East & Africa, Europe, Asia-Pacific | Short term (≤ 2 years) |
| Source: Mordor Intelligence | |||
Prolonged FID Delays Owing to EPC-Cost Inflation & Module Fabrication Bottlenecks
Just 14.8 MTPA of capacity reached FID in 2024, down sharply amid 20-30% cost jumps and labor shortages. Modular construction is gaining favor despite higher equipment prices, yet delays could open a supply gap in 2027-2029, inducing volatility across the liquefied natural gas market.
Competitiveness of Renewable Hydrogen Eroding Long-Term LNG Contract Appetite in Northeast Asia
Japan’s LNG imports have slid 20% since 2018, and South Korea could cut purchases a similar proportion by the mid-2030s as hydrogen economics improve. Buyers shorten contract terms, pressuring sellers of the liquefied natural gas market to enhance flexibility and sustainability credentials.
*Our forecasts treat driver/restraint impacts as directional, not additive. The impact forecasts reflect baseline growth, mix effects, and variable interactions.
Segment Analysis
By Infrastructure Type: Liquefaction Plants Drive Capacity Expansion
Liquefaction plants held 42.60% of 2025 revenues, the highest within the liquefied natural gas market. Capacity boosts in Qatar, the United States, and Australia underpin a forecast 10.75% CAGR to 2031. Electrified compressors and carbon capture trim emissions and sharpen competitive edges for integrated majors.
The segment’s ecosystem now includes 904 LNG carriers, many fitted with low-methane-slip engines that curb greenhouse-gas intensity. FSRUs are accelerating import growth, especially in Europe, adding 77 MMtpy of regas capacity since 2021 and validating modular deployment for the lng market.


By End-Use Application: Marine Bunkering Breaks Out
Power generation retained 37.70% of demand in 2025 and is expanding through integrated LNG-to-power projects in Asia. These setups consolidate terminal, storage, and generation assets, lowering credit risk and deepening the lng market footprint.
Marine bunkering is poised for a 13.55% CAGR, the fastest among applications. Fleet counts, port bunkering networks, and bio-LNG pilots signal durable growth, positioning shipping as a dynamic contributor to the liquefied natural gas market.
By Scale: Small-Scale Solutions Unlock New Segments
Large-scale assets (above 5 MTPA) held 61.30% of 2025 capacity and remain cost leaders. Projects like Woodside’s 16.5 MTPA Louisiana LNG will anchor future export growth and integrate carbon capture initiatives in the lng industry.
Small-scale plants (below 1 MTPA) will grow 14.4% annually, lifting the liquefied natural gas market size for decentralized use in islands, mining sites, and emerging economies. Construction cycles under 18 months allow rapid demand fulfillment and gas-field monetization.
By Location: Offshore Solutions Accelerate Access
Onshore facilities delivered 77.40% of 2025 volumes and continue to benefit from established pipelines and storage. Modular, electrified process trains are cutting build times and shrinking carbon footprints for the liquefied natural gas market.
Offshore capacity, including FLNG and FSRUs, in the LNG industry will grow 10.45% each year. Their agility in sidestepping land-based permitting challenges and quick hook-ups to pipeline grids tie directly into Europe’s security agenda and Asia’s remote-field development.
Geography Analysis
The Middle East & Africa held 27.60% of the 2025 market. Qatar’s North Field build-out from 77 MTPA to 126 MTPA by 2027 cements regional leadership and improves routing flexibility between Europe and Asia. New UAE and Mauritanian ventures add depth, though tanker insurance costs through Hormuz remain an operational concern for the liquefied natural gas market.
North America is set for a 10.25% CAGR through 2031 in the lng market, driven by abundant shale gas and 13.3 MTPA of export trains entering service in 2025. Canada’s Kitimat start-up and Henry-Hub-linked contracts amplify buyer interest, although temporary permitting pauses temper mid-decade FID outlooks.
Asia-Pacific remains the largest import center in the lng market, with China purchasing 78.64 million t in 2024. First-time importers in the Philippines and Vietnam broaden the customer base, while small-scale LNG distribution gains traction for archipelagic supply. Renewable energy growth and hydrogen pilots in Japan and South Korea inject longer-term uncertainty into regional consumption.
Europe expanded regas capacity by 44% since 2021, installing multiple FSRUs to replace Russian pipeline volumes. Seasonal demand spikes sustain premium pricing, and impending EU methane rules will intensify supply-chain monitoring across the liquefied natural gas market.

Competitive Landscape
Global supply shows moderate concentration. Leading LNG companies like QatarEnergy, Shell, Cheniere Energy, and TotalEnergies use vertical integration and robust trading desks to consolidate influence. Shell traded 50 million t in 2024, equating to 17 % of spot and long-term activity. QatarEnergy plans to market 40 million t of third-party cargoes by 2030, extending reach beyond its own production slate.
Carbon-reduction initiatives are emerging differentiators in the lng market. ExxonMobil targets 30 million t of CO₂ capture by 2030, and TotalEnergies allocates up to USD 18 billion annually for low-carbon projects. Digital optimization tools such as Honeywell Forge raised production at Qatargas by 3.6% in 2024, indicating data analytics is an operational advantage.
Contract structures are evolving. Henry-Hub-indexed U.S. volumes provide pricing diversity, though EPC-cost inflation and permitting delays challenge pre-FID exporters. Small-scale LNG, bunkering logistics, and bio-LNG production remain open niches where specialized players can enter the liquefied natural gas market without confronting integrated majors head-on.
Liquefied Natural Gas (LNG) Industry Leaders
QatarEnergy LNG (Qatargas)
Shell plc
Cheniere Energy Inc.
TotalEnergies SE
Petronas
- *Disclaimer: Major Players sorted in no particular order

Recent Industry Developments
- May 2025: QatarEnergy outlined plans to trade 30-40 million t of non-Qatari LNG by 2030, broadening its global footprint.
- May 2025: The U.S. Department of Transportation launched the PHMSA National Center of Excellence for LNG Safety at McNeese State University.
- April 2025: Woodside Energy sanctioned a three-train, 16.5 MTPA Louisiana LNG project with USD 17.5 billion in capital outlays.
- April 2025: Mubadala Energy acquired a stake in Kimmeridge’s U.S. gas and LNG assets, signaling Middle-East investment interest in North American exports.


Research Methodology Framework and Report Scope
Market Definitions and Key Coverage
Mordor Intelligence defines the global liquefied natural gas market as all activities that convert natural gas into a cryogenic liquid at -162 deg C, ship it across oceans, and return it to gaseous form for downstream use. Our study sizes the market on the basis of installed and planned liquefaction and regasification capacity, measured in million tons per annum (MTPA), alongside associated carrier fleet additions and infrastructure spending.
Scope exclusion: retail pipeline gas sales after city-gate regasification are not counted.
Segmentation Overview
- By Infrastructure Type
- LNG Liquefaction Plants [Onshore Liquefaction, Floating LNG (FLNG), Mid-Scale (1-5 mtpa), and Small-Scale (<1 mtpa)]
- LNG Regasification Facilities [Onshore Import Terminals, and Floating Storage & Regasification Units (FSRU)]
- LNG Shipping Fleet [LNG Carriers by Containment (Moss and Membrane), Carrier Size (Q-Max, Q-Flex and Standard), LNG Bunkering Vessels]
- By End-Use Application
- Power Generation
- Industrial and Manufacturing
- Residential and Commercial
- Transportation (Marine Bunkering, Heavy-Duty Road Transport and Rail)
- By Scale
- Large-Scale (Above 5 mtpa)
- Mid-Scale (1 to 5 mtpa)
- Small-Scale (Below 1 mtpa)
- By Location
- Onshore
- Offshore (FLNG and FSRU)
- By Geography
- North America
- United States
- Canada
- Mexico
- Europe
- United Kingdom
- Germany
- France
- Spain
- Nordic Countries
- Russia
- Rest of Europe
- Asia-Pacific
- China
- India
- Japan
- South Korea
- ASEAN Countries
- Australia
- Rest of Asia-Pacific
- South America
- Brazil
- Argentina
- Colombia
- Rest of South America
- Middle East and Africa
- United Arab Emirates
- Saudi Arabia
- Qatar
- South Africa
- Egypt
- Rest of Middle East and Africa
- North America
Detailed Research Methodology and Data Validation
Primary Research
Interviews with shipbuilders, EPC contractors, terminal operators, and Asian power utilities let us validate capex benchmarks, utilization ramps, and delivered prices in the spot and term markets. Follow-up surveys in North America, Europe, and the Middle East refine regional acceptance timelines for floating liquefaction and small-scale bunkering, closing gaps left by desk work.
Desk Research
Our analysts start with open datasets from sources such as the International Gas Union, International Energy Agency, United Nations Comtrade, and the U.S. Energy Information Administration, which supply production, trade, and price histories that ground the capacity calculus. Industry-specific repositories, for example, the Global LNG Project Tracker and Questel's patent filings, help us map fresh project pipelines and technology shifts. Complementary signals come from corporate 10-Ks, LNG buyer tenders, and port authority traffic logs that clarify vessel turn-round rates and berth constraints. We also draw on D&B Hoovers and Dow Jones Factiva to pull consistent financial disclosures for operators and yard builders. This list is illustrative; many other public and subscription assets support the evidence base.
Market-Sizing & Forecasting
A top-down build begins with 2024 global liquefaction nameplate capacity, then adjusts for weighted average utilization, expected project commissioning schedules, and decommissioning risks to estimate effective supply. Results are cross-checked bottom-up through sampled carrier fleet capacity × voyage cycles and through terminal-level send-out where data exist. Key variables in the model include Henry Hub and JKM price spreads, shipbuilding order books, FID lead times, and regional gas-to-power additions. Multivariate regression with scenario overlays (base, delayed FIDs, accelerated decarbonization) projects capacity through 2030, and experts review elasticities before the forecast locks.
Data Validation & Update Cycle
Mordor analysts run variance scans against IGU trade volumes and EIA export figures; any anomaly above a 5 percent band triggers re-work and senior review. The model is refreshed annually, with intra-year updates if major FIDs, sanctions, or safety incidents shift effective supply. Before release, one more analyst pass ensures clients receive our latest view.
Why Mordor's LNG Baseline Commands Reliability
Published LNG figures often diverge because some firms track revenue from cargo sales while others, like us, anchor on capacity fundamentals and real project timing.
Currency translations, assumed average selling prices, and refresh lags widen those gaps.
Benchmark comparison
| Market Size | Anonymized source | Primary gap driver |
|---|---|---|
| 511 MTPA (2025) | Mordor Intelligence | - |
| USD 122.60 bn (2024) | Global Consultancy A | Measures trade revenue, omits pre-FID projects, uses fixed 2023 ASP |
| USD 128.44 bn (2024) | Industry Association B | Blends pipeline gas, applies uniform 26.8 % CAGR, refreshes biennially |
These comparisons show that capacity-based modeling, rolling ASP updates, and yearly refreshes give Mordor's baseline a dependable, decision-ready edge for strategists evaluating investment timing and supply security.


Key Questions Answered in the Report
What is the current liquefied natural gas market size?
Global LNG production capacity stood at 511 MTPA in 2025 and is estimated to reach 553.16 MTPA in 2026, reflecting an 8.25% CAGR toward 822.68 MTPA by 2031.
Which region owns the largest liquefied natural gas market share?
The Middle East & Africa held about 27.60% of 2025 global revenue, anchored by Qatar’s North Field expansion.
Which application segment is growing fastest in the liquefied natural gas market?
Marine bunkering is projected to expand at a 13.55% CAGR from 2026-2031 as shipping lines switch to LNG for sulfur-cap compliance.
How are EPC cost pressures influencing new LNG supply?
EPC inflation and module-fabrication delays curtailed FID approvals to 14.8 MTPA in 2024, risking a supply gap in the 2027-2029 window.
What role does floating LNG play in future supply growth?
FLNG unlocks stranded offshore gas, offers faster deployment than onshore plants, and is expected to underpin a 10.45% CAGR in offshore capacity through 2031.
Are renewable hydrogen developments a threat to the liquefied natural gas industry?
Improving hydrogen economics in Japan and South Korea are shortening LNG contract tenors, putting modest downward pressure on long-term demand yet raising premiums for flexible, low-carbon cargoes.
Page last updated on:


