Oil and Gas Infrastructure Market Size and Share
Market Overview
| Study Period | 2021 - 2031 |
|---|---|
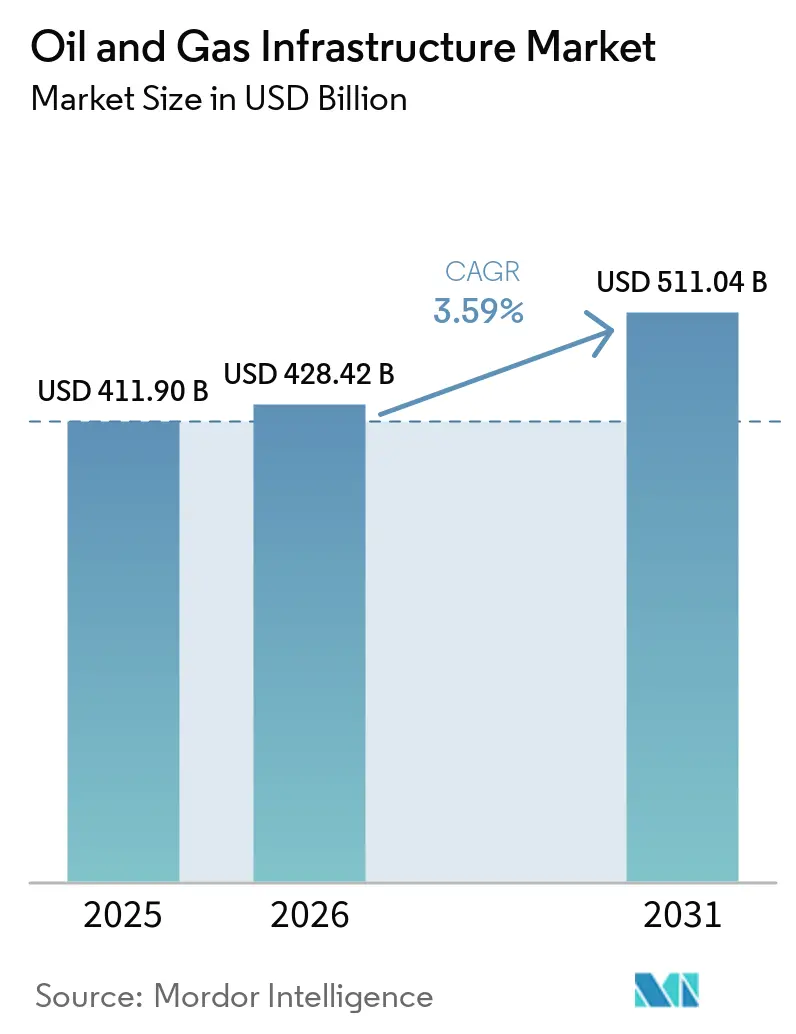
| Market Size (2026) | USD 428.42 Billion |
| Market Size (2031) | USD 511.04 Billion |
| Growth Rate (2026 - 2031) | 3.59% CAGR |
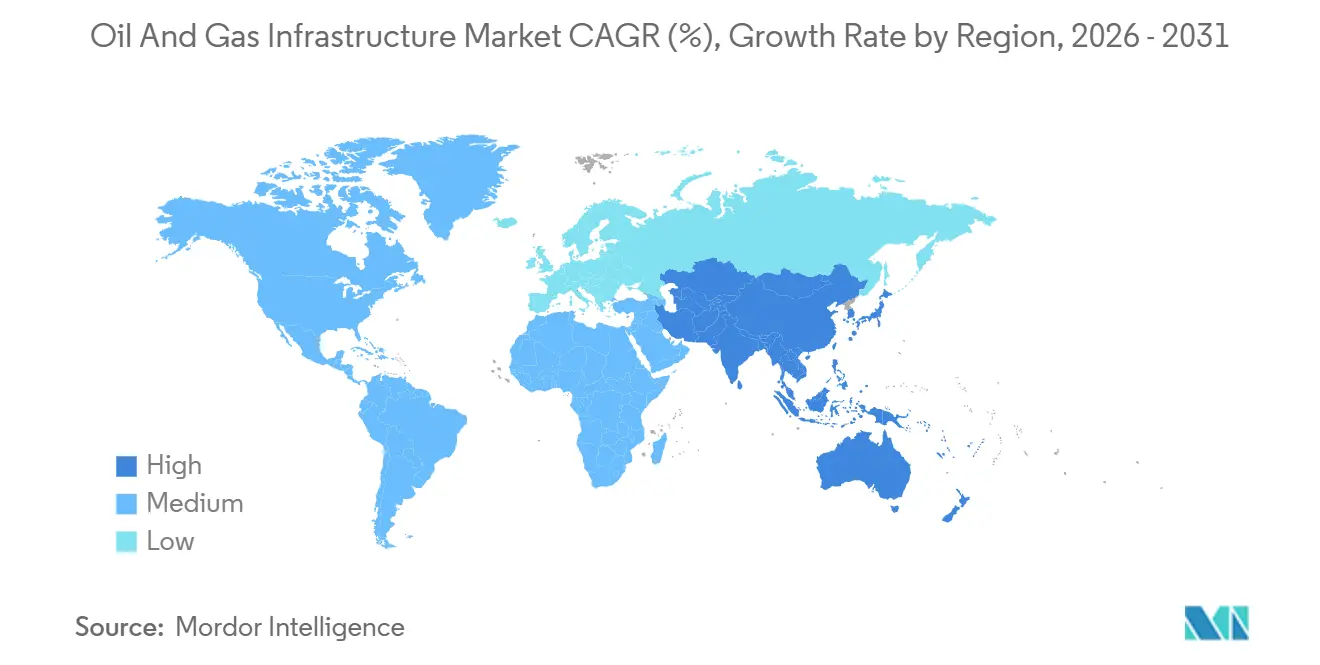
| Fastest Growing Market | Asia-Pacific |
| Largest Market | Asia-Pacific |
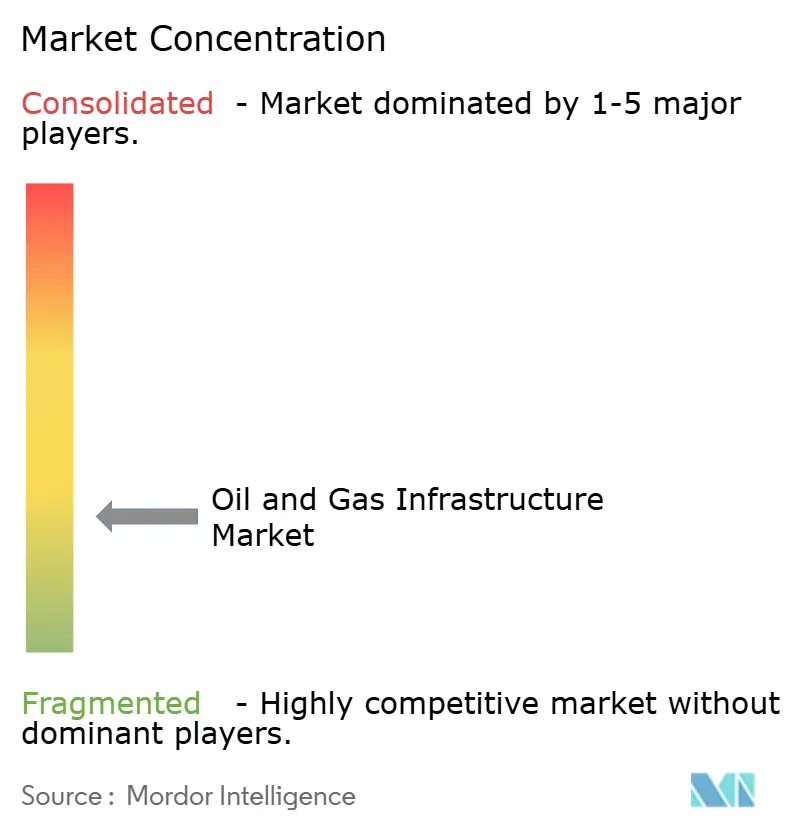
| Market Concentration | Low |
Major Players *Disclaimer: Major Players sorted in no particular order Image © Mordor Intelligence. Reuse requires attribution under CC BY 4.0. | |
Oil and Gas Infrastructure Market Analysis by Mordor Intelligence
The Oil And Gas Infrastructure Market size was USD 411.90 billion in 2025 and is expected to reach USD 428.42 billion in 2026 and reach USD 511.04 billion by 2031, growing at a CAGR of 3.59% over 2026-2031. Heightened energy-security concerns following the March 2026 Strait of Hormuz incident, which removed up to 7 million barrels per day from global supply, are prompting operators to channel capital toward LNG terminals, deep-water platforms, and hydrogen-ready pipelines rather than exclusively expanding legacy lines. Integrated majors allocated an estimated USD 110 billion to upstream and midstream projects in 2025, with a noticeable tilt toward liquefaction plants and deep-water developments aimed at making supply chains more resilient to geopolitical shocks. Pipelines still dominate the installed base, yet Europe’s rapid pivot away from Russian gas and Asia’s persistent demand for flexible cargoes are propelling LNG infrastructure at a notably faster clip. At the same time, technology adoption is accelerating: digital-twin deployments on 15 rigs cut non-productive time by 12% in 2025, illustrating how predictive maintenance is becoming a mainstream cost-control lever.
Key Report Takeaways
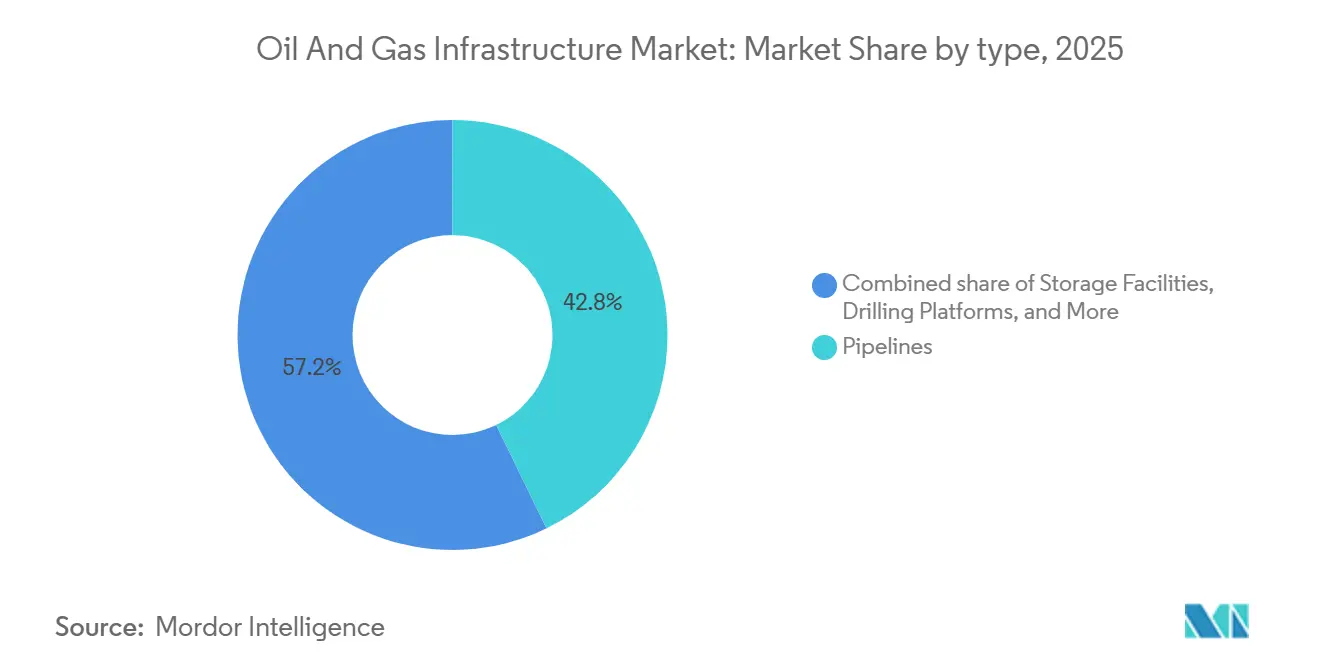
- By type, pipelines commanded 42.8% of oil & gas infrastructure market share in 2025; LNG import and export terminals are advancing at a 7.0% CAGR through 2031.
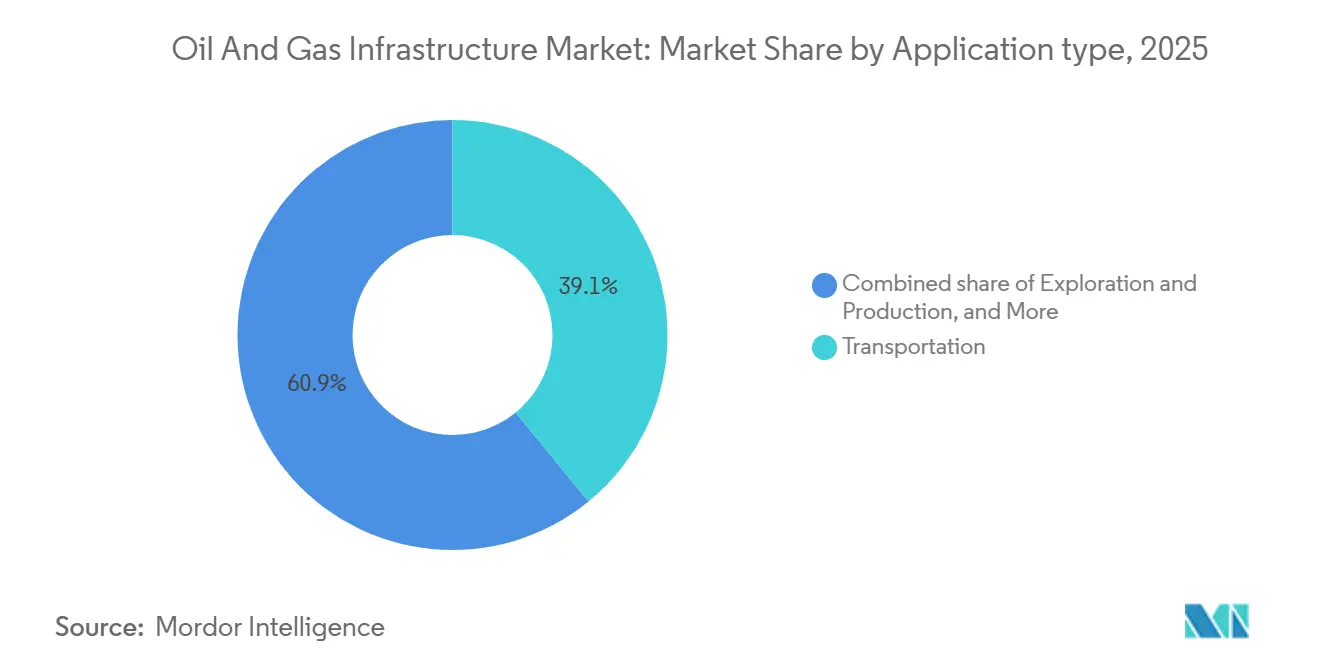
- By application, transportation held a 39.1% slice of the oil & gas infrastructure market size in 2025, while storage and distribution is growing at a 6.6% CAGR through 2031.
- By geography, North America led with a 34.7% revenue contribution in 2025, whereas Asia-Pacific is forecast to log a 6.3% CAGR to 2031.
Note: Market size and forecast figures in this report are generated using Mordor Intelligence’s proprietary estimation framework, updated with the latest available data and insights as of January 2026.
Global Oil and Gas Infrastructure Market Trends and Insights
Drivers Impact Analysis*
| Driver | (~) % Impact on CAGR Forecast | Geographic Relevance | Impact Timeline |
|---|---|---|---|
| Ageing Pipeline Replacement Cycle | +0.8% | North America, Europe, Russia | Medium term (2-4 years) |
| Rising Global LNG Trade | +1.2% | Global, Asia-Pacific, Europe, Middle East | Long term (≥4 years) |
| Deep- & Ultra-Deep-water CAPEX Upswing | +0.6% | South America, Africa, Asia-Pacific | Medium term (2-4 years) |
| National Energy-Security Programs | +0.7% | Europe, Asia-Pacific, Middle East | Short term (≤2 years) |
| Pipeline Hydrogen-Blending Retrofits | +0.3% | Europe, North America | Long term (≥4 years) |
| Digital-Twin-Based Predictive O&M | +0.4% | Global early adoption in North America, Middle East | Medium term (2-4 years) |
| Source: Mordor Intelligence | |||
Ageing Pipeline Replacement Cycle
North American operators added 6.3 billion cubic feet per day of new gas-line capacity in 2025, yet most construction simply swapped out corroded segments installed in the 1960s and 1970s [1]U.S. Energy Information Administration, “Natural Gas Pipeline Capacity Additions 2025,” eia.gov. Washington disbursed USD 196 million of federal grants to 19 states for corrosion control and steel-line upgrades that same year [2]U.S. Department of Transportation, “Federal Pipeline Safety Grants 2025,” transportation.gov. Across the Atlantic, about 40% of Europe’s high-pressure grid predates 1980, encouraging regulators to tighten inspection intervals under ISO 16708, a move that is driving short-cycle demand for high-grade steel and automated welding equipment. Gazprom intends to retire 8,000 kilometers of trunk lines by 2028 and redirect funds toward newer Arctic routes, illustrating how aging assets are being de-prioritized in favor of projects that match shifting trade patterns. Collectively, the replacement wave is a durable catalyst for pipe mills and corrosion-protection vendors even though steel-price spikes occasionally delay orders.
Rising Global LNG Trade
LNG trade climbed to 412 million tons in 2025, a 4.8% year-over-year rise that reflected Europe’s need to offset the loss of 155 billion cubic meters of Russian pipeline volumes and Asia’s ongoing coal-to-gas switch [3]International Gas Union, “2026 World LNG Report,” igu.org. Three U.S. export terminals, Calcasieu Pass 2, Golden Pass, and Plaquemines, gained final approval in 2025 and will collectively add 39.6 million tons per annum of nameplate capacity by decade-end. Europe commissioned an additional 85 billion cubic meters of regasification space between 2022 and 2025, one-third of which was realized via floating storage and regasification units, enabling rapid deployment and lowering upfront costs [4]ENTSOG, “European LNG and Storage Map 2025,” entsog.eu. Qatar retained a 20% global export share in 2025 but was forced to declare force majeure on specific cargoes during the March 2026 Strait of Hormuz disruption, exposing concentration risk in the Strait’s narrow shipping lane. Although the build-out strengthens system resilience, it also amplifies stranded-asset concerns should renewable penetration curb long-term gas demand.
Deep- & Ultra-Deep-Water CAPEX Upswing
Brazil’s Petrobras sanctioned Búzios 9 and Mero 4 floating production units in 2025, each designed to process 180,000 barrels per day, and simultaneously awarded USD 1.2 billion of subsea work to McDermott and Subsea 7. In Africa, Mozambique’s Coral Norte floating LNG vessel came onstream, processing 3.4 million tons per annum from the Area 4 block, underscoring that ultra-deep-water gas can be competitive when paired with modular liquefaction. Chevron committed USD 7 billion to a portfolio of deep-water ventures in 2025, including the high-pressure Anchor platform in the U.S. Gulf of Mexico. These technically complex projects sustain demand for advanced subsea processing equipment, remotely operated vehicles, and specialized installation vessels. However, cost overruns remain common once contractors confront unexpected geology or permitting delays.
National Energy-Security Programs
India unveiled a USD 500 billion energy-sector investment roadmap to 2030, allocating roughly USD 100 billion for upstream exploration to cut import dependence, which stood at 85% in 2025. New coastal refineries in Gujarat and Odisha will push national refining output toward 300 million tons per annum by 2028 and create additional demand for jetty expansions and product pipelines. Japan and South Korea raised mandatory LNG stockpile minimums to 90 days in 2025, triggering a leasing spree for underground caverns and above-ground tanks. Meanwhile, the European Union legislated a 90% storage-fill rule every November 1, a target first tested successfully in 2024-2025 despite lower Russian gas inflows. These programs create immediate demand for storage caverns, import jetties, and intra-regional connectors even as they expose state budgets to price swings.
Restraints Impact Analysis*
| Restraint | (~) % Impact on CAGR Forecast | Geographic Relevance | Impact Timeline |
|---|---|---|---|
| Extreme Oil-Price Volatility | -0.9% | Global, with acute effects in North America shale, Latin America | Short term (≤ 2 years) |
| Net-Zero & ESG Capital-Allocation Shifts | -0.6% | Europe, North America, with spillover to global majors | Long term (≥ 4 years) |
| Modular Floating-LNG Competition | -0.4% | Global, particularly Asia-Pacific, Africa, South America | Medium term (2-4 years) |
| Cyber-security Driven Project Delays | -0.3% | Global, with higher exposure in North America, Europe, Middle East | Short term (≤ 2 years) |
| Source: Mordor Intelligence | |||
Extreme Oil-Price Volatility
Brent averaged USD 62 to USD 65 per barrel in early 2026 amid a 1.4 million- to 2.5 million-barrel-per-day global surplus. The March 2026 Strait of Hormuz scare briefly lifted prices to USD 78, but values normalized within ten days following strategic-reserve releases and route diversions around the Cape of Good Hope. Operators typically need a USD 70-plus threshold to green-light long-cycle platforms and cross-border pipelines; therefore, prolonged sub-USD 70 pricing defers final investment decisions. U.S. shale drillers cut budgets by 8% in early 2026, prioritizing shareholder returns over volume growth, which then suspends related gathering-system expansions. Latin American national companies felt similar pressure: Petrobras postponed two floating production vessels in 2025, and YPF deferred a USD 2.5 billion trunk-line expansion serving Vaca Muerta.
Net-Zero & ESG Capital-Allocation Shifts
BP trimmed its renewables budget by USD 5 billion in 2025, pivoting cash back into Gulf of Mexico upstream projects following shareholder calls for faster payouts. Shell halted a USD 1.55 billion sale of its Sprng Energy stake in India during September 2025, flagging adverse market conditions and a strategic rethink of renewables. European lenders such as BNP Paribas and ING announced in 2025 that they would only fund new hydrocarbon pipelines or LNG export plants if projects aligned with Paris-agreement trajectories, effectively raising the cost of debt for developers in emerging economies. Although reduced low-carbon spending may slow hydrogen and carbon-capture networks, it prolongs the useful life of conventional assets, paradoxically sustaining near-term demand for oil & gas infrastructure market projects.
*Our forecasts treat driver/restraint impacts as directional, not additive. The impact forecasts reflect baseline growth, mix effects, and variable interactions.
Segment Analysis
By Type: LNG Terminals Outpace Legacy Pipelines
LNG terminals are expanding the fastest among asset classes, clocking a 7.0% annual growth rate through 2031, even though pipelines still held 42.8% of the oil and gas infrastructure market share in 2025. Europe alone added 85 billion cubic meters of regasification capacity between 2022 and 2025, leaning heavily on floating storage and regasification units that can be moored in under a year. Storage infrastructure is rising in tandem because Brussels mandates a 90% inventory target each November 1, encouraging cavern conversions and new salt-dome leaching. Refining and processing units face mixed fortunes: global nameplate capacity touched 102 million barrels per day in 2025, but OECD utilization hovered near 82% amid rising electric-vehicle penetration, signaling potential rationalization in mature markets.
Drilling platforms and subsea systems, however, are benefiting from a deep-water renaissance. Petrobras placed orders for four floating production, storage, and offloading vessels in 2025, cumulatively worth USD 14 billion, each slated for 180,000-barrel-per-day throughput. Compressor stations are undergoing electrification retrofits; Cenovus installed 25 electric units totaling 16 megawatts at Foster Creek in 2025, lowering fuel-gas burn by 18%. Technip Energies captured a USD 1.2 billion EPC contract for Qatar’s North Field West LNG expansion in 2026, a project embracing modular trains that cut field-erection times by 18 months compared with stick-built megaprojects. The oil & gas infrastructure market size for LNG terminals is therefore poised to surpass that of new long-haul pipelines in the next decade, reshaping capex allocation across the value chain.


By Application: Storage Gains as Volatility Hedge
Transportation assets dominated with a 39.1% revenue contribution in 2025, mirroring decades of pipeline, tanker, and rail investments that move hydrocarbons from wellhead to consumer hubs. Yet, storage and distribution are growing 6.6% annually, fueled by price volatility hedging and statutory reserve requirements. India’s INR 70,000 crore (USD 8.4 billion) initiative to construct 15 LNG carriers by 2030 showcases how import-dependent nations seek logistical autonomy. Exploration and production infrastructure received a material boost from Chevron’s USD 7 billion allocation in 2025 for deep-water platforms outfitted with 20,000-psi subsea equipment, validating technology’s role in unlocking previously stranded barrels.
Processing and refining remain critical in high-growth regions. India is on track to push refining capacity toward 300 million tons per annum by 2028, thanks to new coastal complexes designed to handle heavier crude and export more diesel. The United Arab Emirates expanded Fujairah storage by 50% in 2025 via an additional 42 million-barrel project, aiming to secure more than half of the Middle East’s new storage through 2028. These examples highlight how the oil & gas infrastructure market size for storage applications is gaining heft relative to pure transportation builds, especially as intermittent renewables and carbon pricing amplify the need for flexible balancing assets.
Geography Analysis
North America captured 34.7% of 2025 spending, driven by USD 5 billion to USD 5.5 billion of midstream capex from Energy Transfer and the sanctioning of three major LNG export terminals that will consolidate the United States’ position as the world’s largest LNG shipper by 2030. Canada’s TC Energy commissioned USD 6 billion of assets in 2025 and green-lit another USD 3.63 billion, while completing Coastal GasLink to feed LNG Canada on the Pacific Coast. Mexico’s industrial southeast still relies on expensive spot LNG cargoes because pipeline capacity lags demand, underlining an untapped opportunity for cross-border expansions.
Asia-Pacific is the fastest-growing zone at a 6.3% CAGR to 2031, propelled by India’s multi-hundred-billion-dollar infrastructure drive and Indonesia’s approval of offshore hubs such as Tangkulo and Mako. Malaysia’s BIGST cluster reached final investment decision in 2025, with first gas expected in 2029, and Petronas’ Rosmari-Marjoram project aims to deliver 800 million cubic feet per day. Japan and South Korea’s stricter 90-day LNG reserves mandate is spurring additional cavern leasing, keeping import-terminal EPC order books healthy.
Europe continues to funnel capital into regasification terminals and storage expansions as it phases out 155 billion cubic meters of Russian pipeline supply. Inventory reached 83% by October 1, 2025, only one month shy of the bloc’s 90% November target despite lower Russian volumes, yet draw-down rates remain constrained during cold snaps. GASCADE’s hydrogen-ready line and Fluxys’ EUR 2 billion retrofit plan place the region at the forefront of mixed-gas transmission technology. South America’s capex is concentrated in Brazil, where Petrobras awarded USD 1.2 billion of subsea work in 2025 and is ramping up floating production vessel orders, though Argentina’s Vaca Muerta remains hampered by pipeline bottlenecks. The Middle East and Africa combine vast low-cost reserves with geopolitical risk: Qatar maintained a 20% share of global LNG exports in 2025 despite the March 2026 shipping disruption. The UAE boosted Fujairah storage by 42 million barrels, and Mozambique’s Coral Norte is proving that floating LNG can unlock deep-water fields without onshore megaprojects.

Competitive Landscape
The Oil and Gas Infrastructure Market is fragmented. SLB secured a USD 1.5 billion, five-year drilling-services award from Kuwait Oil Company in February 2026 for high-pressure, high-temperature wells, illustrating how operators outsource technical risk to service majors. Keyera’s USD 5 billion acquisition of Plains Midstream Canada in June 2025 created Western Canada’s largest independent midstream player, amassing 4,000 kilometers of pipelines and 190,000 barrels per day of processing capacity. EPC houses are differentiating through modular fabrication: Technip Energies’ North Field West LNG contract relies on standardized trains built in South Korea and shipped to the site, cutting schedule duration by 18 months.
Hydrogen infrastructure is an emerging battleground. GASCADE’s 400-kilometer hydrogen-ready line required EUR 180 million of state aid, suggesting private capital still sees policy risk. Floating LNG is also redrawing boundaries; several vessel orders now carry unit capital intensity below USD 1,000 per ton, given high utilization rates, rendering them competitive with small onshore plants. Niche contractors are finding footholds: McDermott’s subsea installation contract for Brazil’s Papa-Terra and Atlanta fields underscores the value of regional expertise and local-content compliance. Cybersecurity capability is fast becoming a differentiator; Romania’s Conpet endured a 72-hour ransomware shutdown in February 2026, prompting insurers to demand zero-trust architectures before underwriting future infrastructure.
Finally, technology is leveling the playing field. Precision Drilling’s digital-twin savings highlight how mid-tier contractors can compete on cost through data analytics. Similarly, Fluxys’ hydrogen retrofits position it ahead of larger peers that are still assessing blend economics. The oil & gas infrastructure industry is thus migrating from pure scale advantages toward integrated service, digital competency, and low-carbon optionality.
Oil and Gas Infrastructure Industry Leaders
Technip Energies NV
Saipem SpA
Schlumberger NV
Halliburton Co
Baker Hughes Company
- *Disclaimer: Major Players sorted in no particular order

Recent Industry Developments
- June 2026: Delfin Midstream approved the final investment decision (FID) for Delfin FLNG 1, the first offshore floating LNG export project in the United States. Situated offshore Louisiana, the facility is expected to have an LNG export capacity of 4.4 million tonnes per annum (MTPA) and is projected to be the world's largest floating LNG (FLNG) project.
- June 2025: Cheniere Energy announced a positive Final Investment Decision on Corpus Christi Midscale Trains 8 & 9 Project, adding 5 million tons per annum capacity and targeting over USD 25 per share run-rate Distributable Cash Flow by early 2030s.
- May 2025: Saudi Aramco awarded over USD 25 billion in strategic gas expansion contracts, targeting a 60% increase in sales gas production by 2030 through Jafurah field development and Master Gas System expansion.
- April 2025: Enstor Gas received FERC certificate approval for the Mississippi Hub Expansion Project, adding 33.5 billion cubic feet of working gas storage capacity to enhance Gulf Coast energy security.


Global Oil and Gas Infrastructure Market Report Scope
Oil and gas infrastructure comprises a network of facilities and systems that facilitate the extraction, transportation, processing, storage, and distribution of hydrocarbons. Covering upstream, midstream, and downstream operations, it ensures the efficient, safe, and uninterrupted flow of oil and natural gas from production sites to end users. This infrastructure is essential for meeting global energy demand and supporting industrial and economic activities.
The Oil & Gas Infrastructure market is segmented by type, application, and geography. By type, the market is segmented into pipelines, storage facilities, processing and refining units, drilling platforms, LNG import/export terminals, and compressor and pumping stations. By application, the market is segmented into exploration and production, transportation, processing and refining, and storage and distribution. By geography, the market is segmented into North America, Europe, Asia-Pacific, South America, and the Middle East and Africa. The report also covers market size and forecasts for the Oil & Gas Infrastructure market across major countries in these regions. For each segment, the market sizing and forecasts have been conducted on the basis of value (USD).
| Pipelines |
| Storage Facilities |
| Processing and Refining Units |
| Drilling Platforms |
| LNG Import/Export Terminals |
| Compressor and Pumping Stations |
| Exploration and Production |
| Transportation |
| Processing and Refining |
| Storage and Distribution |
| North America | United States |
| Canada | |
| Mexico | |
| Europe | Germany |
| United Kingdom | |
| France | |
| Italy | |
| NORDIC Countries | |
| Russia | |
| Rest of Europe | |
| Asia-Pacific | China |
| India | |
| Japan | |
| South Korea | |
| ASEAN Countries | |
| Rest of Asia-Pacific | |
| South America | Brazil |
| Argentina | |
| Rest of South America | |
| Middle East and Africa | Saudi Arabia |
| United Arab Emirates | |
| South Africa | |
| Egypt | |
| Rest of Middle East and Africa |
| By Type | Pipelines | |
| Storage Facilities | ||
| Processing and Refining Units | ||
| Drilling Platforms | ||
| LNG Import/Export Terminals | ||
| Compressor and Pumping Stations | ||
| By Application | Exploration and Production | |
| Transportation | ||
| Processing and Refining | ||
| Storage and Distribution | ||
| By Geography | North America | United States |
| Canada | ||
| Mexico | ||
| Europe | Germany | |
| United Kingdom | ||
| France | ||
| Italy | ||
| NORDIC Countries | ||
| Russia | ||
| Rest of Europe | ||
| Asia-Pacific | China | |
| India | ||
| Japan | ||
| South Korea | ||
| ASEAN Countries | ||
| Rest of Asia-Pacific | ||
| South America | Brazil | |
| Argentina | ||
| Rest of South America | ||
| Middle East and Africa | Saudi Arabia | |
| United Arab Emirates | ||
| South Africa | ||
| Egypt | ||
| Rest of Middle East and Africa | ||


Key Questions Answered in the Report
How large will global oil & gas infrastructure spending be by 2031?
It is projected to reach USD 511.04 billion by 2031, expanding at a 3.59% CAGR from 2026.
Which asset class is growing the fastest?
LNG import and export terminals are advancing at a 7.0% annual rate to 2031, outpacing pipelines and storage expansions.
Why are storage projects attracting more capital?
Governments now mandate higher strategic reserves, and traders seek flexibility to arbitrage volatile prices, driving a 6.6% CAGR in storage and distribution outlays.
What regions are leading new investments?
Asia-Pacific is the fastest-growing region at a 6.3% CAGR, while North America still commands the single-largest spend share thanks to LNG terminal expansions.
How is technology reshaping project economics?
Digital twins have cut rig downtime by 12% and hydrogen-ready retrofits are future-proofing 400 kilometers of German pipeline, demonstrating measurable efficiency and decarbonization gains.
Page last updated on:


