Underground Gas Storage Market Size and Share
Market Overview
| Study Period | 2021 - 2031 |
|---|---|
| Market Volume (2026) | 436 Billion cubic meters |
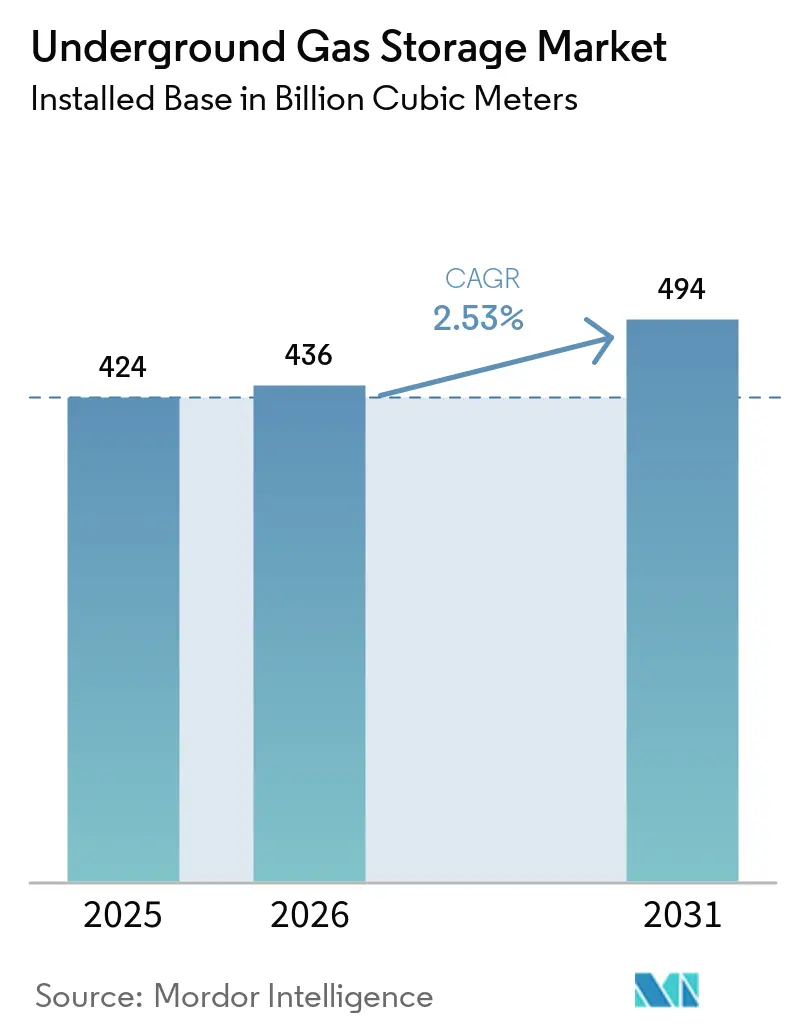
| Market Volume (2031) | 494 Billion cubic meters |
| Growth Rate (2026 - 2031) | 2.53% CAGR |
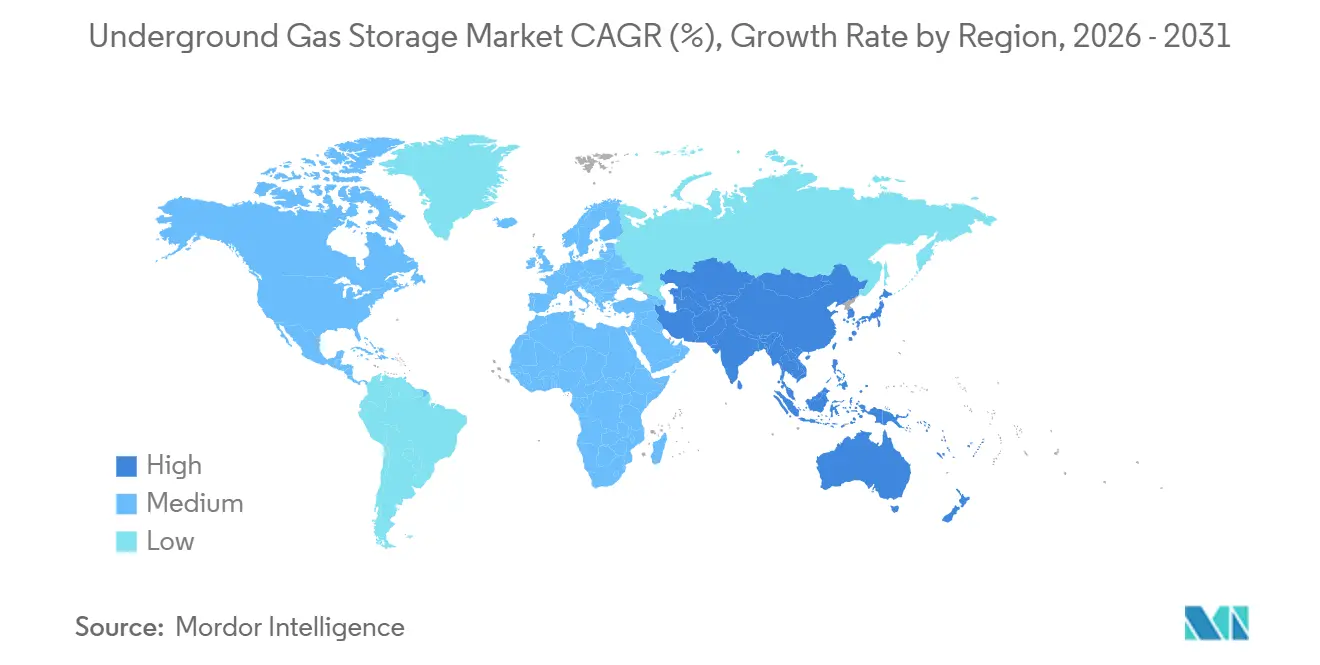
| Fastest Growing Market | Asia Pacific |
| Largest Market | North America |
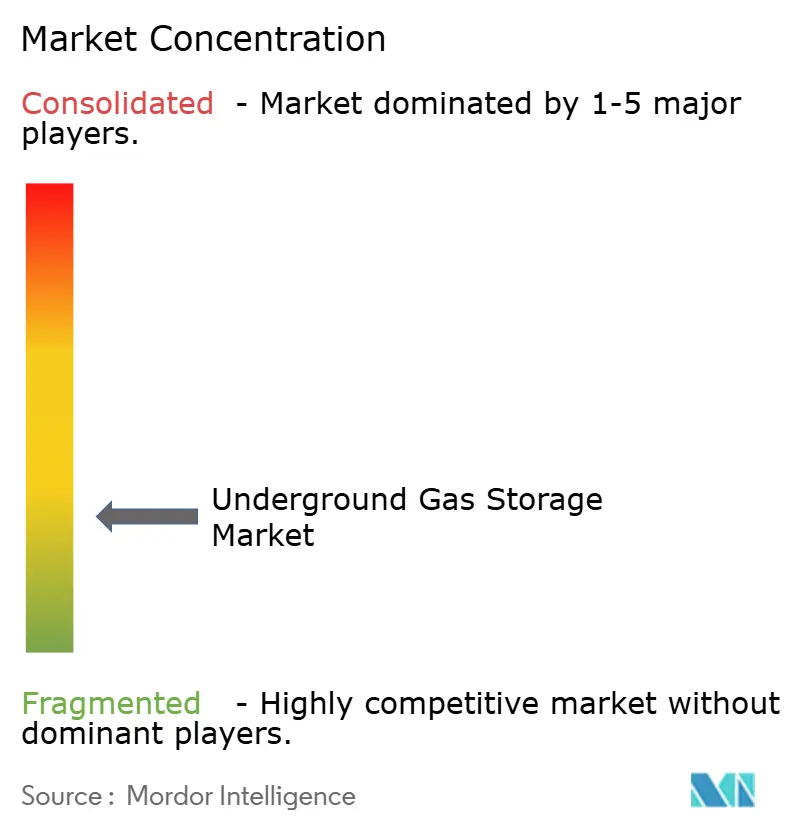
| Market Concentration | Low |
Major Players *Disclaimer: Major Players sorted in no particular order Image © Mordor Intelligence. Reuse requires attribution under CC BY 4.0. | |
Underground Gas Storage Market Analysis by Mordor Intelligence
The Underground Gas Storage Market size in terms of installed base is projected to expand from 424 billion cubic meters in 2025 and 436 billion cubic meters in 2026 to 494 billion cubic meters by 2031, registering a CAGR of 2.53% between 2026 and 2031. Operators are channeling capital into depleted-reservoir and salt-cavern retrofits that can accommodate hydrogen blends, while digital-twin monitoring improves well integrity and cushions capital locked in base gas. Methane-leakage rules finalized by the U.S. Environmental Protection Agency in November 2024 demand a 75% cut in fugitive emissions by 2030, accelerating the adoption of AI-led leak-detection systems. Europe’s analogous Methane Regulation, effective in 2024, is spurring similar retrofit cycles across the bloc. North America held a 37.9% underground gas storage market share in 2025, yet Asia-Pacific will expand fastest at an 11.5% CAGR through 2031 as China, India, and South Korea build strategic reserves against LNG-import volatility.
Key Report Takeaways
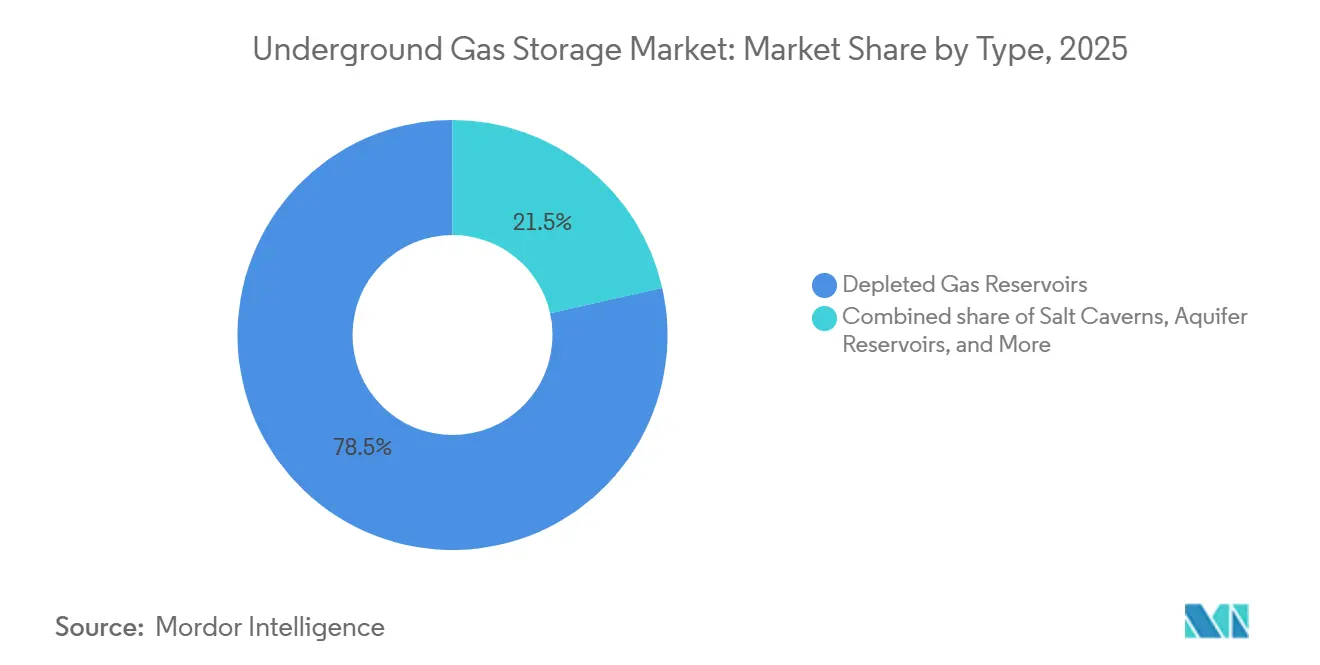
- By type, depleted reservoirs led with 78.5% of the underground gas storage market share in 2025, while salt caverns are forecast to expand at a 9.1% CAGR through 2031.
- By storage-capacity class, facilities above 20 Bcf accounted for a 54.0% share of the underground gas storage market size in 2025, whereas the 5-20 Bcf cohort is forecast to grow at a 6.8% CAGR through 2031.
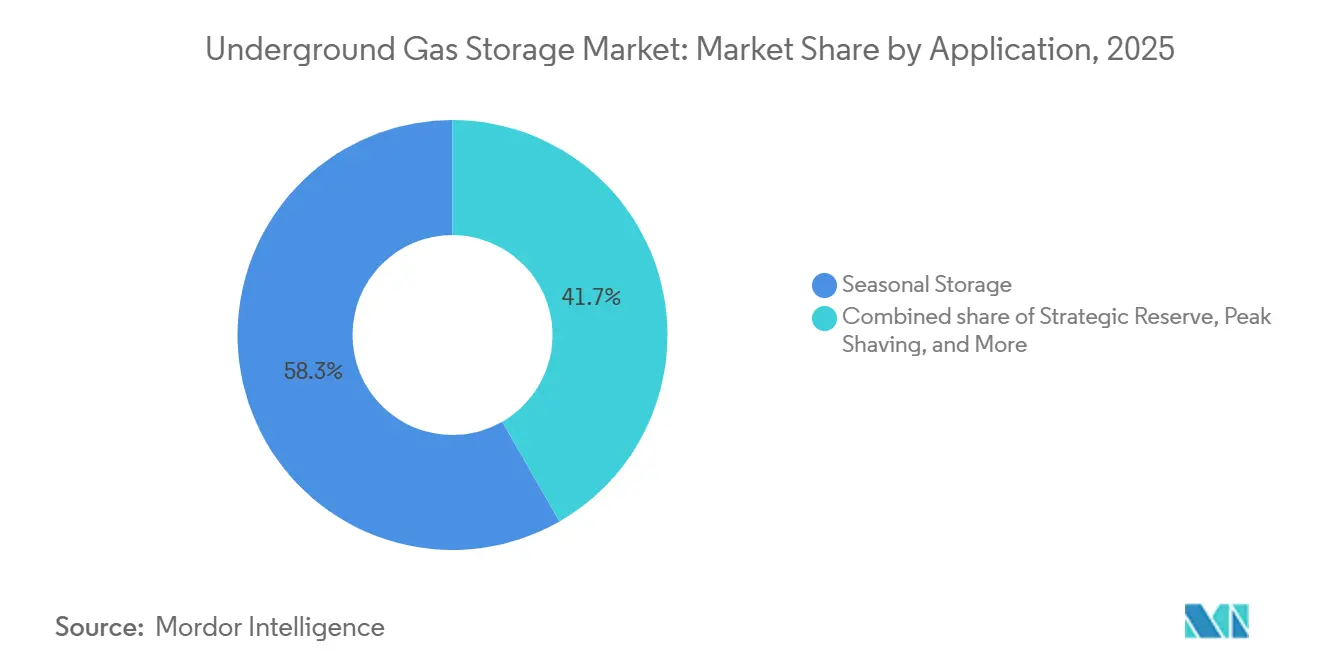
- By application, seasonal storage accounted for 58.3% of the underground gas storage market size in 2025, and peak shaving is advancing at a 7.7% CAGR through 2031.
- By end-user, utilities held 53.1% of demand in 2025, whereas industrial and petrochemical players recorded the highest projected CAGR at 7.2% to 2031.
- By geography, North America commanded 37.9% of capacity in 2025; Asia-Pacific is projected to grow at an 11.5% CAGR between 2026 and 2031.
Note: Market size and forecast figures in this report are generated using Mordor Intelligence’s proprietary estimation framework, updated with the latest available data and insights as of January 2026.
Global Underground Gas Storage Market Trends and Insights
Drivers Impact Analysis*
| Driver | (~) % Impact on CAGR Forecast | Geographic Relevance | Impact Timeline |
|---|---|---|---|
| Demand for seasonal & strategic working gas | +0.8% | Global, with concentration in North America, Europe, Northeast Asia | Medium term (2-4 years) |
| Growing gas-fired power generation & peak-shaving demand | +0.6% | North America, Europe, ASEAN, India | Medium term (2-4 years) |
| Energy-security diversification after Russia-Ukraine crisis | +0.5% | Europe, Northeast Asia, select Middle East importers | Short term (≤ 2 years) |
| Integration of UGS with low-carbon hydrogen hubs | +0.3% | Europe (Germany, Netherlands, Denmark), North America (Gulf Coast, Alberta) | Long term (≥ 4 years) |
| Digital-twin & AI reservoir optimisation boosts economics | +0.2% | Global, early adoption in North America and Western Europe | Medium term (2-4 years) |
| Methane-leakage regulations incentivising retrofit projects | +0.2% | North America (EPA jurisdiction), European Union | Short term (≤ 2 years) |
| Source: Mordor Intelligence | |||
Demand for Seasonal & Strategic Working Gas
Seasonal heating cycles and binding storage mandates underpin utilization levels. Germany required 78 TWh of reserves for winter 2024, while the European Union set a 90% fill rule each November, pushing utilities to secure more working gas and injection capacity. India earmarked USD 700 million in its 2025 budget for Phase II strategic gas reserves that will add 3-4 bcm in depleted wells, trimming LNG-import exposure. PetroChina added 6 bcm of working capacity by purchasing former production fields for USD 5.59 billion, stabilizing seasonal swings in northern provinces. Such policy-led expansions create a structural utilization floor, shielding operators from spot-price shocks and supporting long-cycle investment.
Growing Gas-Fired Power Generation & Peak-Shaving Demand
Coal-to-gas switching and renewable intermittency boost the premium on rapid-cycle storage. NERC reports that deliverability above 70 Bcf per day lets North American utilities meet intra-day ramps without over-scheduling turbines [1]North American Electric Reliability Corporation, “2025 Long-Term Reliability Assessment,” nerc.com. Salt caverns satisfy hourly cycling; Enbridge’s Dawn Hub in Ontario is investing USD 400 million to add 1.5 Bcf per day of deliverability for the province’s grid as coal plants retire [2]Enbridge Inc., “Dawn Hub Expansion Press Release 2024,” enbridge.com. India plans to triple gas-fired capacity by 2030, requiring aquifer and depleted-field projects in Gujarat and Rajasthan to modulate monsoon-related demand troughs.
Energy-Security Diversification after Russia-Ukraine Crisis
Geopolitical disruptions fast-tracked stockpiling plans. European storage dipped to 61% of capacity in early 2024 versus a 72% five-year mean, prompting emergency refills that tested injection limits. South Korea’s Yeosu LNG terminal, budgeted at KRW 1.4 trillion (USD 1.05 billion), will commission three 200,000-m³ tanks by 2028 to reduce pipeline dependence. Osaka Gas earmarked JPY 73.7 billion (USD 490 million) for FY 2025 safety upgrades that link reinforced pipelines to underground storage, guarding supply during seismic events.
Integration of UGS with Low-Carbon Hydrogen Hubs
Hydrogen blending widens the revenue base for legacy caverns. Germany’s H2CAST pilot injected 90 t of hydrogen into the Etzel cavern in March 2026, proving pressure compatibility with existing assets. Enagás and Solvay secured EUR 2.1 million under the PureH2 fund to develop the Polanco caverns, part of a 544 GWh portfolio slated for 2030. Levelized storage costs in salt caverns range from USD 0.8-1.5 per kg, beating compressed gas alternatives.
Restraints Impact Analysis*
| Restraint | (~) % Impact on CAGR Forecast | Geographic Relevance | Impact Timeline |
|---|---|---|---|
| High capital plus cushion-gas cost burden | -0.5% | Global, acute in emerging markets | Long term (≥ 4 years) |
| Environmental, seismic & brine-disposal risks | -0.3% | North America, Europe, China | Medium term (2-4 years) |
| Battery storage & LNG regasification as competing peakers | -0.4% | Asia-Pacific, Europe, select N. American markets | Short term (≤ 2 years) |
| Net-zero policy uncertainty for long-lived gas assets | -0.3% | Europe, North America, Asia-Pacific | Long term (≥ 4 years) |
| Source: Mordor Intelligence | |||
High Capital Plus Cushion-Gas Cost Burden
CEDIGAZ pegs the cumulative investment need at EUR 100-170 billion through 2035, with depleted-reservoir conversions costing EUR 190 per MWh and greenfield caverns EUR 235 per MWh [3]CEDIGAZ, “Investment Needs in Gas Storage 2035,” cedigaz.org. Aquifer projects immobilize 45-80% of capacity in base gas; at 2025 spot prices near USD 3/MMBtu, a 10 Bcf site locks up USD 15-24 million that yields no revenue. India’s government budgeted up to USD 2 billion for its strategic program, showing how fiscal pressure can delay timelines.
Battery Storage & LNG Regasification as Competing Peakers
Lithium-ion plants reach commercial operation in under two years and provide sub-second response, eroding the peaking niche of underground gas storage market assets. South Korea’s Ulsan LNG terminal, commissioned in November 2024 with 4.4 million barrels of send-out, supplies peak demand without geologic constraints. CAES systems in depleted reservoirs post levelized costs of USD 70-270 per MWh, challenging gas-based peakers where renewables exceed 30% penetration [4]International Renewable Energy Agency, “Electric-Storage Cost Outlook 2025,” irena.org.
*Our forecasts treat driver/restraint impacts as directional, not additive. The impact forecasts reflect baseline growth, mix effects, and variable interactions.
Segment Analysis
By Type: Depleted Reservoirs Anchor Capacity, Salt Caverns Lead Growth
Depleted reservoirs delivered 78.5% of capacity in 2025, reflecting their favorable cushion-gas ratios of 20-40%, yet salt caverns are on a 9.1% CAGR trajectory because they enable hourly cycling and hydrogen storage. The underground gas storage market size for salt caverns is projected to expand faster than aquifers because caverns support deliverability of 1 Bcf per day or more, a crucial attribute for balancing renewable-heavy grids.
Capital efficiency still favors depleted fields for seasonal roles, but regulatory pushes toward hydrogen raise the appeal of caverns. Germany’s BMWK foresees 250 caverns converting for 76-80 TWh hydrogen capacity by 2045. Centrica committed GBP 2 billion to ready the 54 Bcf Rough site for hydrogen by 2050, showing incumbents repositioning assets to defend the underground gas storage market share amid decarbonization.


By Storage-Capacity Class: Mega-Facilities Dominate, Mid-Tier Grows Fastest
Sites above 20 Bcf controlled 54% of installed capacity in 2025, led by mega-reservoirs such as Rough and Golden Triangle, which offer economies of scale and simplified offtake contracts. Still, 5-20 Bcf facilities will grow 6.8% annually as midstream operators acquire stranded fields near industrial clusters. Williams Companies’ USD 1.95 billion purchase of 115 Bcf in Louisiana and Mississippi illustrates this scaling tactic.
Regulation nudges consolidation upward. The EPA methane rule applies to throughput above 50 MMcf per day, adding compliance costs that smaller sites struggle to absorb. Consequently, investors gravitate to larger assets with diversified revenue and lower unit costs, reinforcing a tilt toward the upper capacity tiers of the underground gas storage market.
By Application: Seasonal Storage Leads, Peak Shaving Accelerates
Seasonal storage claimed 58.3% of the underground gas storage market size in 2025, buoyed by Europe’s 90% fill mandate. However, peak shaving is set to climb 7.7% per year through 2031 on the back of renewable volatility and coal-to-gas replacement. Enbridge’s Dawn Hub upgrade adds 1.5 Bcf per day specifically for intra-day dispatch, mirroring utility preferences for faster cycling.
Strategic reserves in the Asia-Pacific also widen the addressable base. India and China are adding 3-4 bcm and 6 bcm respectively, partially insulating against LNG-price shocks. These builds cement seasonal and emergency roles even as flexible, hourly services gain momentum, balancing the application mix within the underground gas storage market.
By End-User: Utilities Dominate, Industrials Gain Share
Utilities consumed 53.1% of underground gas storage in 2025 owing to winter heating contracts and mandated reserves. Their preference for high-reliability mega-sites underpins long-term service agreements that lower project-finance risk. Industrial and petrochemical users will grow at 7.2% through 2031, propelled by on-site hydrogen production that needs cavern storage for buffering intermittency.
Mid-stream companies increasingly serve both segments. Williams’ Gulf Coast assets feed petrochemical complexes that require 24/7 feedstock security. Government agencies in Asia-Pacific broaden the customer mix through strategic programs such as South Korea’s Yeosu and Ulsan terminals that integrate LNG send-out and underground storage for resilience.
Geography Analysis
North America held 37.9% of the underground gas storage market share in 2025, underpinned by more than 400 facilities totaling 4.8 Tcf of working capacity. The U.S. added 70 Bcf of demonstrated peak capacity after retrofits aligned with the EPA’s 2024 methane rule, while Canada’s Dawn Hub expansion targets 1.5 Bcf per day of new deliverability. Private-equity firms such as Sixth Street and Caliche bought Central Valley and Golden Triangle Storage to capture stable, inflation-hedged cash flows.
Energy-security imperatives drive Europe’s capacity build. Germany stored 78 TWh by late 2024 under its refill decree, and BMWK foresees 2-7 TWh of hydrogen storage by 2030. The UK reopened Rough and earmarked GBP 2 billion for hydrogen conversion, while Denmark’s Lille Torup caverns will tie into a 550 km pipeline to the Netherlands by 2030. Russia remains sizable but opaque as sanctions steer exports eastward.
Asia-Pacific represents the fastest-growing underground gas storage market, expanding 11.5% per year to 2031. China moved to sixth globally after adding 6 bcm of capacity and acquiring 10.97 bcm of working gas for USD 5.9 billion. India’s Phase II program funds 3-4 bcm by 2030, and Japan’s Osaka Gas invests USD 469 million for quake-proofed pipelines linked to underground storage. South Korea’s Yeosu and Ulsan LNG terminals enhance peaking supply without geological barriers, while ASEAN states explore pilots to backstop nascent gas-fired power fleets.

Competitive Landscape
The underground gas storage market is moderately fragmented. Gazprom dominates Russian capacity, PetroChina leads China with a USD 5.9 billion build-up, and European utilities like Storengy operate multi-country portfolios. In North America, Williams’ USD 1.95 billion purchase of 115 Bcf illustrates consolidation toward scale, while private equity favors mid-tier assets offering steady, regulated revenue.
Competitive differentiation is tilting toward hydrogen-ready retrofits and digital twins. Enagás secured EUR 7.7 million from the Connecting Europe Facility for its North-1 hydrogen caverns, while Uniper is investing EUR 200 million to digitize 80 TWh of storage. Cost-competitive salt-cavern conversions at EUR 190 per MWh undercut new builds, creating a white space for incumbents to lock in future-proof revenue.
Midstream operators also bundle storage with pipeline and LNG assets, enhancing one-stop logistics for utilities and industrials. Such integrated offerings, plus the need to amortize methane-rule compliance costs, push the underground gas storage market toward larger, multi-service portfolios rather than standalone wells.
Underground Gas Storage Industry Leaders
Gazprom
PetroChina / CNPC
Enbridge Inc.
Storengy (ENGIE)
Uniper SE
- *Disclaimer: Major Players sorted in no particular order

Recent Industry Developments
- January 2026: The International Gas Union’s (IGU) Storage Committee reported that global underground gas storage (UGS) capacity reached 424 billion cubic meters (bcm) across 699 facilities worldwide in 2025. This capacity serves as a critical buffer against supply disruptions and price volatility, particularly as the energy transition progresses. The Middle East contributed 9 bcm to this strategic reserve. The expansion marks an increase of 10 bcm from the 414 bcm reported in 2022, with peak withdrawal rates rising to 7,371 million cubic meters per day (mcm/d), compared to 7,221 mcm/d two years earlier. This steady growth highlights the global expansion of infrastructure and reinforces UGS as a fundamental component of energy systems.
- December 2025: The European Commission granted priority status to two significant energy projects supported by Snam, making them eligible for expedited permitting and EU funding. These projects include the South2 Corridor, a hydrogen pipeline linking Algeria to Germany, and the Callisto CO2 capture and storage hub in Ravenna, both aimed at advancing Europe's green transition. Additionally, the initiatives expand underground storage capabilities beyond natural gas to include carbon and hydrogen storage, bolstering long-term demand for underground gas storage (UGS).
- December 2025: NTPC and IIT-Bombay completed drilling the first geological well in Jharkhand to assess the feasibility of underground carbon dioxide (CO2) storage. Drilling of a second well in the area has also begun, aimed at monitoring and analyzing the behavior of injected CO2 and its containment through various monitoring techniques.
- March 2025: Eni and Vitol formed a USD 1.65 billion partnership for West African gas assets, including Baleine and Congo LNG, targeting 200 MMcf/d associated gas.


Global Underground Gas Storage Market Report Scope
Underground Gas Storage (UGS) involves storing natural gas in subsurface geological formations for future use. It plays a vital role in the natural gas supply chain by balancing supply and demand, ensuring energy security, and stabilizing prices. Natural gas is injected into storage during periods of low demand, typically in summer, and withdrawn during high-demand periods, usually in winter. This process enables utilities and energy companies to manage seasonal variations effectively.
The Global Underground Gas Storage Market is segmented by type, storage-capacity class, application, end-user, and geography. By type, the market is segmented into Depleted Gas Reservoirs, Salt Caverns, Aquifer Reservoirs, and LNG Re-injection Facilities. By storage-capacity class, the market is segmented into below 1 Bcf, 1 to 5 Bcf, 5 to 20 Bcf, and above 20 Bcf. By application, the market is segmented into seasonal storage, strategic reserve, peak shaving, and balancing and load management. By end-user, the market is segmented into gas and power utilities, industrial and petrochemical, commercial/residential distributors, midstream operators, and government and emergency agencies. The report also covers market sizes and forecasts for the global underground gas storage market across major countries within these regions. For each segment, the market sizing and forecasts have been provided on the basis of volume (bcm).
| Depleted Gas Reservoirs |
| Salt Caverns |
| Aquifer Reservoirs |
| LNG Re-injection Facilities |
| Below 1 Bcf |
| 1 to 5 Bcf |
| 5 to 20 Bcf |
| Above 20 Bcf |
| Seasonal Storage |
| Strategic Reserve |
| Peak Shaving |
| Balancing and Load Management |
| Gas and Power Utilities |
| Industrial and Petrochemical |
| Commercial/Residential Distributors |
| Mid-stream Operators |
| Government and Emergency Agencies |
| North America | United States |
| Canada | |
| Mexico | |
| Europe | Germany |
| United Kingdom | |
| France | |
| Italy | |
| NORDIC Countries | |
| Russia | |
| Rest of Europe | |
| Asia-Pacific | China |
| India | |
| Japan | |
| South Korea | |
| ASEAN Countries | |
| Rest of Asia-Pacific | |
| South America | Brazil |
| Argentina | |
| Rest of South America | |
| Middle East and Africa | Saudi Arabia |
| United Arab Emirates | |
| South Africa | |
| Egypt | |
| Rest of Middle East and Africa |
| By Type | Depleted Gas Reservoirs | |
| Salt Caverns | ||
| Aquifer Reservoirs | ||
| LNG Re-injection Facilities | ||
| By Storage-Capacity Class | Below 1 Bcf | |
| 1 to 5 Bcf | ||
| 5 to 20 Bcf | ||
| Above 20 Bcf | ||
| By Application | Seasonal Storage | |
| Strategic Reserve | ||
| Peak Shaving | ||
| Balancing and Load Management | ||
| By End-user | Gas and Power Utilities | |
| Industrial and Petrochemical | ||
| Commercial/Residential Distributors | ||
| Mid-stream Operators | ||
| Government and Emergency Agencies | ||
| By Geography | North America | United States |
| Canada | ||
| Mexico | ||
| Europe | Germany | |
| United Kingdom | ||
| France | ||
| Italy | ||
| NORDIC Countries | ||
| Russia | ||
| Rest of Europe | ||
| Asia-Pacific | China | |
| India | ||
| Japan | ||
| South Korea | ||
| ASEAN Countries | ||
| Rest of Asia-Pacific | ||
| South America | Brazil | |
| Argentina | ||
| Rest of South America | ||
| Middle East and Africa | Saudi Arabia | |
| United Arab Emirates | ||
| South Africa | ||
| Egypt | ||
| Rest of Middle East and Africa | ||


Key Questions Answered in the Report
What is the projected global volume for underground gas storage in 2031?
The underground gas storage market is forecast to reach 494 Billion cubic meters by 2031.
Which region should see the quickest capacity expansion over the next five years?
Asia-Pacific is on track for an 11.5% CAGR as China, India, and South Korea add strategic reserves.
Why are salt caverns drawing more capital than depleted reservoirs?
Caverns support hourly cycling and hydrogen storage, which drives a 9.1% CAGR versus slower growth for depleted fields.
How do the 2024–2025 methane regulations alter investment priorities?
U.S. and EU rules that mandate a 75% cut in fugitive emissions by 2030 are steering funds toward leak-detection systems and wellhead retrofits.
What part will hydrogen play in future underground storage strategies?
Projects such as Germany’s Etzel pilot and Spain’s Polanco caverns show operators converting sites to store low-carbon hydrogen at costs of USD 0.8–1.5 per kg.
Page last updated on:


