Tight Gas Market Size and Share
Market Overview
| Study Period | 2021 - 2031 |
|---|---|
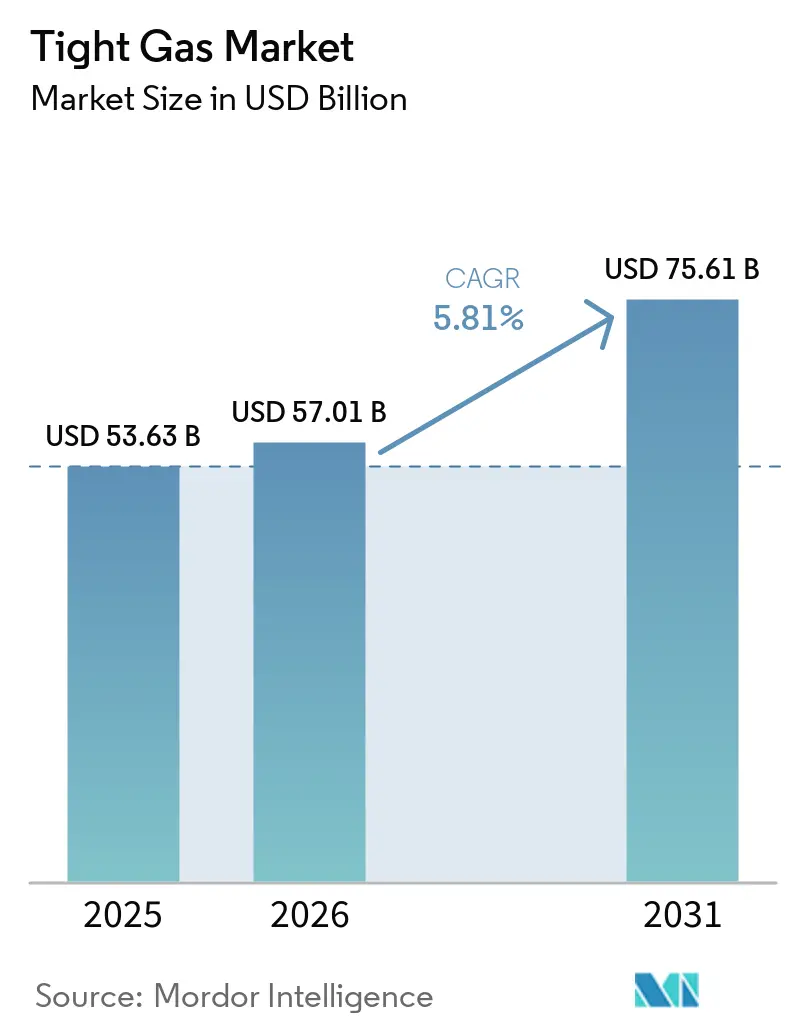
| Market Size (2026) | USD 57.01 Billion |
| Market Size (2031) | USD 75.61 Billion |
| Growth Rate (2026 - 2031) | 5.81% CAGR |
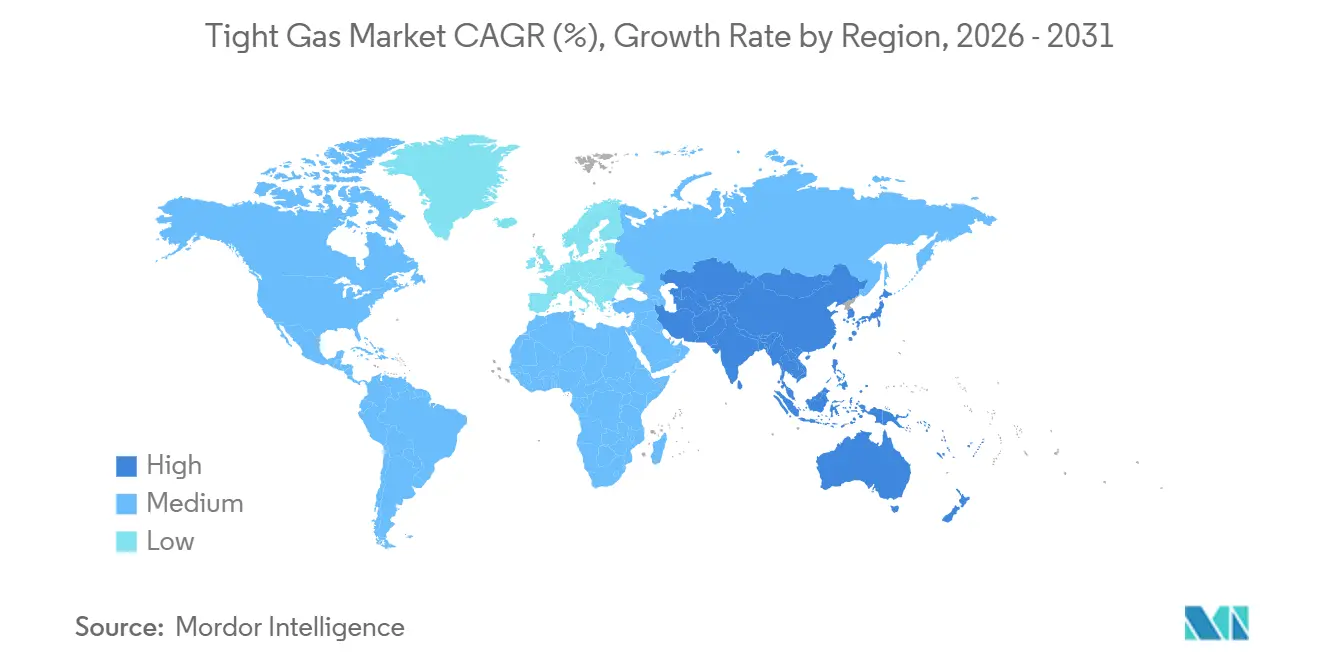
| Fastest Growing Market | Asia Pacific |
| Largest Market | North America |
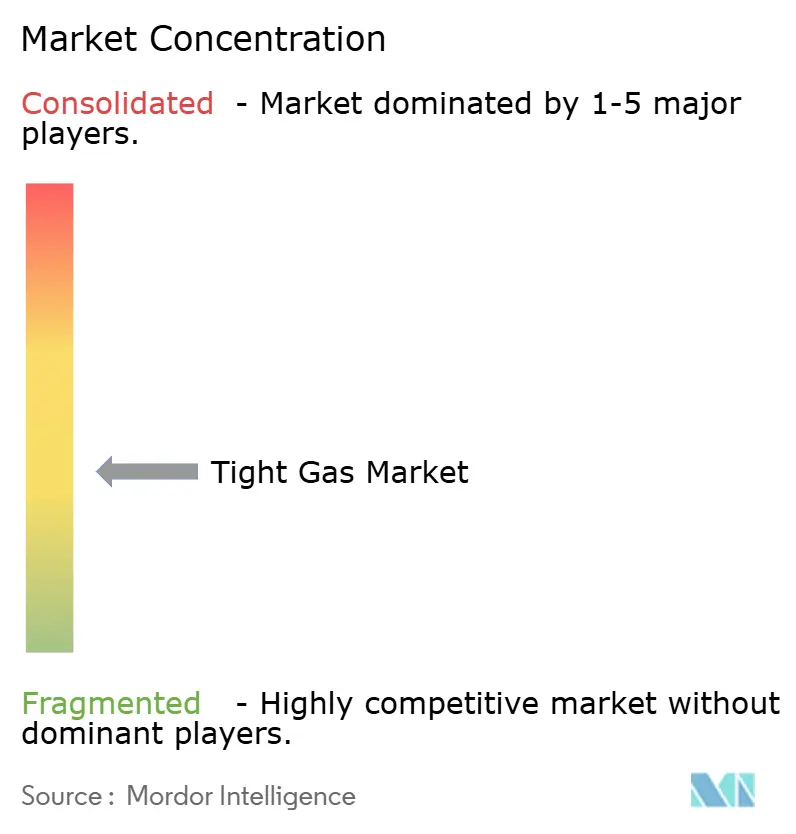
| Market Concentration | Medium |
Major Players *Disclaimer: Major Players sorted in no particular order Image © Mordor Intelligence. Reuse requires attribution under CC BY 4.0. | |
Tight Gas Market Analysis by Mordor Intelligence
The Tight Gas Market size is projected to be USD 53.63 billion in 2025, USD 57.01 billion in 2026, and reach USD 75.61 billion by 2031, growing at a CAGR of 5.81% from 2026 to 2031. Operators treat the resource as a bridge fuel that offsets conventional-field decline while providing lower carbon intensity than coal generation. Sandstone reservoirs dominated 2025 revenue, yet acid-stimulated limestone plays are accelerating, and subsea completion know-how is opening offshore targets. North American production led in 2025 on the back of multi-zone horizontals in the Permian and Haynesville, but policy-driven gas demand in Asia-Pacific positions that region as the fastest growing through 2031. Intensifying LNG export build-outs, cost-saving drilling automation, and carbon-capture integration collectively reinforce investment momentum and buffer operators from gas-price swings.
Key Report Takeaways
- By resource type, sandstone captured 64.2% revenue in 2025, whereas limestone shows the highest upside at a 6.4% CAGR to 2031.
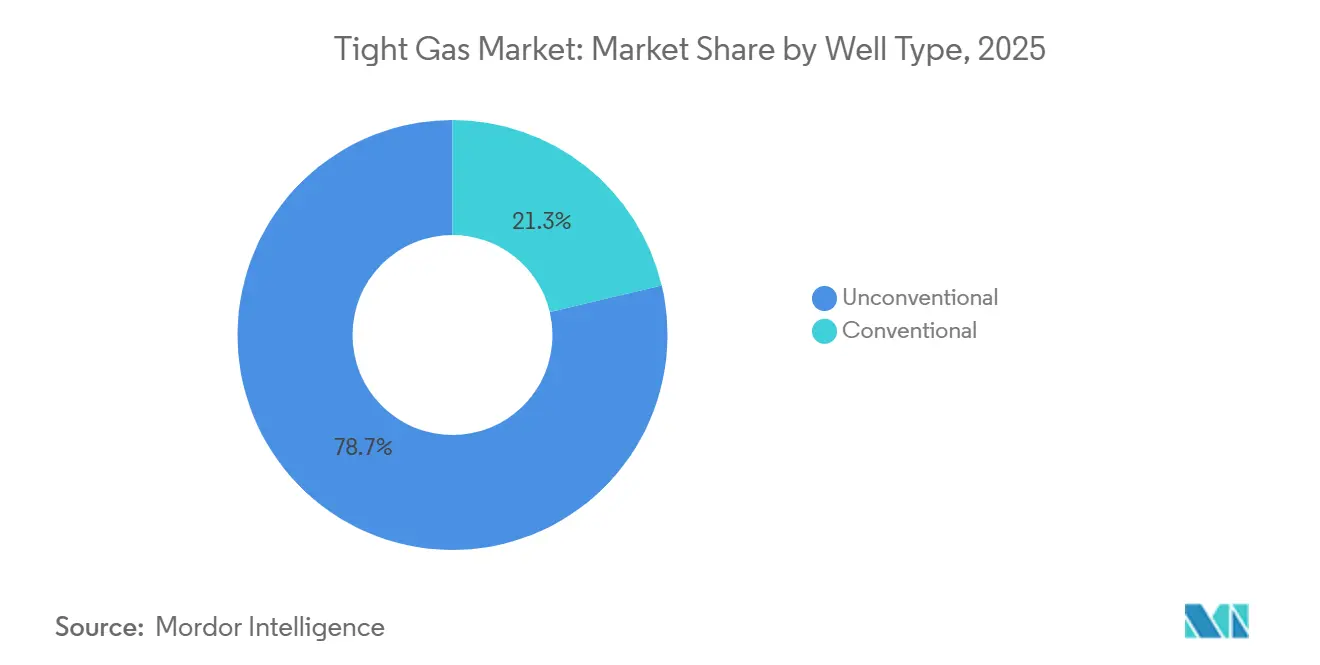
- By well type, unconventional horizontals held 78.7% of 2025 value and remain the fastest growing segment with a 6.1% CAGR through 2031.
- By location, onshore projects delivered 90.1% of 2025, while offshore tight gas grows the quickest at 6.7% to 2031.
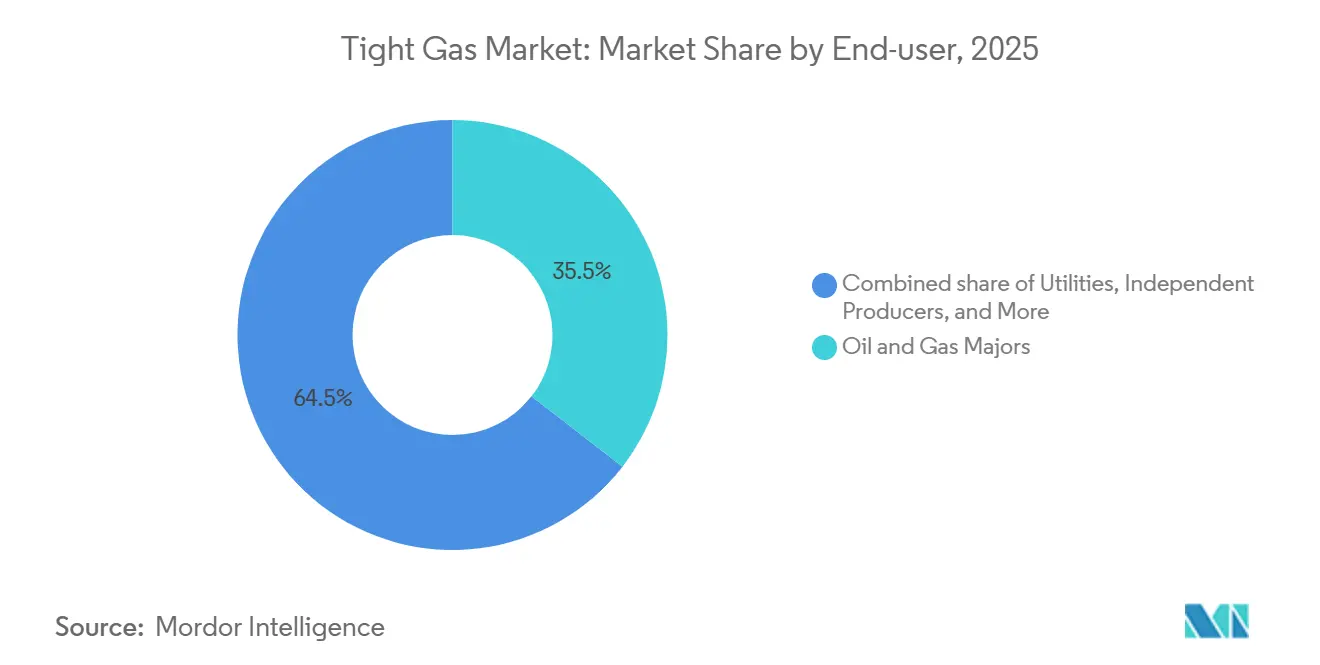
- By end-user, oil and gas majors led with 35.5% of 2025 revenue, whereas independent producers are projected to expand at 6.6% through 2031.
- By geography, North America commanded 45.3% of global 2025 tight gas market share, but Asia-Pacific leads growth at a 6.5% CAGR to 2031.
Note: Market size and forecast figures in this report are generated using Mordor Intelligence’s proprietary estimation framework, updated with the latest available data and insights as of January 2026.
Global Tight Gas Market Trends and Insights
Drivers Impact Analysis*
| Driver | ( ~ ) % Impact on CAGR Forecast | Geographic Relevance | Impact Timeline |
|---|---|---|---|
| Declining conventional gas reserves | +1.2% | Global; acute in North America and Europe | Long term (≥ 4 years) |
| Rising global gas-fired power demand | +1.5% | Global; concentrated in Asia-Pacific and Middle East | Medium term (2-4 years) |
| Technology cost deflation | +1.0% | North America; spreading to South America and Asia-Pacific | Short term (≤ 2 years) |
| Government incentives for stranded gas | +0.8% | Middle East, South America, select Asia-Pacific markets | Medium term (2-4 years) |
| Tight-gas / CCS integration | +0.6% | North America and Europe; pilots in Middle East | Long term (≥ 4 years) |
| Energy-security mandates | +0.9% | Asia-Pacific (China, India), Europe | Medium term (2-4 years) |
| Source: Mordor Intelligence | |||
Declining Conventional Gas Reserves
Legacy offshore and onshore conventional gas fields now decline 6.8% per year globally, forcing producers to redirect roughly USD 500 billion of annual upstream spending toward unconventional deposits [1]International Energy Agency, “World Energy Outlook 2024,” iea.org. North Sea facilities commissioned in the 1970s operate below 30% of their original plateau rates, while U.S. shallow-water Gulf of Mexico output has halved since 2015. A Haynesville horizontal well costs near USD 8 million versus USD 50-100 million for a new offshore platform, giving tight gas a rapid payback even at mid-cycle prices. CNPC reported Sichuan Basin tight-gas output topping 40 billion m³ in 2025, helping offset declines at Daqing and Shengli. European players are rebalancing similarly; TotalEnergies exited mature North Sea assets in 2024 to fund Argentina’s Vaca Muerta tight-gas push.
Rising Global Gas-Fired Power Demand
Global additions of 85 GW of gas-fired capacity in 2025 stemmed from coal-to-gas switching in Asia-Pacific and fast-growing data-center loads in North America [2]U.S. Energy Information Administration, “Electric Power Monthly,” eia.gov. U.S. dry-gas production is set to rise from 120.8 Bcf/d in 2026 to 122.3 Bcf/d in 2027, with tight formations supplying 60% of the increase. Long-dated LNG offtake contracts underwrite upstream economics; U.S. projects sanctioned in 2025 added more than 80 bcm/yr of liquefaction. Qatar’s North Field Phase 2 will contribute 1.2 Bcf/d of tight-carbonate feedstock by 2028. India cleared 12 GW of gas-peaking plants in 2025 that will lean on Krishna-Godavari tight gas.
Technology Cost Deflation
Average U.S. tight-gas drilling and completion cost fell 10% in 2024 thanks to rig automation and multi-stage efficiency gains. Chevron’s triple-frac system cut cycle time 25% and water usage per well, while ConocoPhillips shortened Anadarko spud-to-TD to nine days by 2025. In-basin sand sourcing removed USD 15-20 per-ton trucking premiums, and YPF trimmed Vaca Muerta cost to USD 9.5 million per well after localizing equipment.
Tight-Gas / CCS Integration Unlocking Green Finance
Pairing tight gas with carbon capture attracts sustainability-linked capital that is 50-100 bps cheaper than conventional project finance. BKV’s Cotton Cove field sequesters 90,000 t CO₂ annually and closed a USD 200 million green bond at 4.2% interest. Norway’s Northern Lights will soon carry 5 Mt CO₂/yr, offering tariff access to nearby tight-gas operators. QatarEnergy committed USD 1.3 billion in 2025 to retrofit Ras Laffan, motivated by the European Union’s 2026 Carbon Border Adjustment Mechanism that prices upstream emissions.
Restraints Impact Analysis*
| Restraint | ( ~ ) % Impact on CAGR Forecast | Geographic Relevance | Impact Timeline |
|---|---|---|---|
| Environmental and water-use opposition | -0.7% | North America, Europe, select Asia-Pacific markets | Short term (≤ 2 years) |
| Gas-price volatility vs LNG and shale | -0.5% | Global, acute in North America & Europe | Medium term (2-4 years) |
| Induced-seismicity moratoria in emerging plays | -0.4% | North America (Permian, Anadarko), select international basins | Medium term (2-4 years) |
| Proppant-supply bottlenecks in remote basins | -0.3% | South America, Asia-Pacific, Middle East | Short term (≤ 2 years) |
| Source: Mordor Intelligence | |||
Environmental and Water-Use Opposition
Average water use per Colorado tight-gas well quadrupled to 17.17 million gal in 2024, prompting permit pauses during low-reservoir months [3]Colorado Oil and Gas Conservation Commission, “Water Use Report 2024,” cogcc.state.co.us. New Mexico’s Pecos River Compact restricts industrial withdrawal, capping large-scale completions below 15 wells per year. Recycled produced water now covers 65% of Permian fracture fluid but adds USD 0.50-0.80/bbl to cost. France and Germany still ban hydraulic fracturing, blocking roughly 15 Tcf of technically recoverable European tight gas [4]European Parliament Research Service, “Hydraulic Fracturing in the EU,” europarl.europa.eu. The U.K. lifted its moratorium in 2024, yet keeps a magnitude-0.5 threshold that has stalled new wells.
Gas-price volatility vs LNG & shale
Henry Hub swung between USD 1.80 and USD 4.20 per MMBtu in 2025, a 133% band that pushed unhedged operators’ cash margins as low as USD 0.40/Mcf. Futures imply a 30% probability of sub-USD 2.50 pricing if winter demand is mild. Arbitrage dynamics add uncertainty; European TTF spikes diverted U.S. LNG cargoes in late 2025, lifting Henry Hub 35% in one week. Chesapeake Energy’s 2024 bankruptcy cited unhedged gas exposure as a core driver.
*Our forecasts treat driver/restraint impacts as directional, not additive. The impact forecasts reflect baseline growth, mix effects, and variable interactions.
Segment Analysis
By Resource Type: Carbonate Plays Narrow the Sandstone Gap
Sandstone held 64.2% of the tight gas market share in 2025, anchored by Mesaverde and Haynesville outputs that benefit from natural fracture networks. The limestone market is projected to grow at an annual rate of 6.4% through 2031, surpassing sandstone, as advancements in acid-gel treatments enhance per-well productivity by approximately 30%. ADNOC’s January 2026 SARB Deep Gas sanction underscores industry appetite for deep Khuff carbonates despite 4,500 m depths. Other resource types, such as tight coal-seam gas and hybrid shale-tight plays, significantly contributed to market revenue in 2025.
Cost curves vary sharply across rock types. Sandstone wells in the U.S. Mid-Continent drill for USD 6-8 million, while Middle East carbonate wells often exceed USD 15 million due to high-temp completions. Yet limestone offers steeper learning-curve gains; QatarEnergy lifted well productivity 22% in 2025 after switching to acid-gel systems. Australia balances coal-seam gas with tight imports to satisfy Queensland LNG, and hybrid Wolfcamp wells grant operators commodity optionality when oil-to-gas ratios widen. Overall, the tight gas market registers a gradual pivot toward carbonates outside North America, while sandstones remain dominant in U.S. basins.
By Well Type: Unconventional Techniques Cement Dominance
Horizontal wells with multi-stage hydraulic fracturing accounted for 78.7% of 2025 revenue and are projected to expand at 6.1% through 2031. A Haynesville horizontal averages 25 MMcf/d initial output versus 1-2 MMcf/d for a vertical well, justifying the 3-4× capex premium. Conventional vertical wells persist in legacy fields where surface constraints discourage horizontals.
Asia-Pacific is accelerating adoption; Sinopec completed 85 horizontals at Fuling in 2025, and India’s ONGC will drill 10 pilot wells by end-2026. In South America, YPF dropped vertical rigs to 15 in 2025 while boosting horizontals to 180, thanks to localized supply chains. Alberta’s spacing rules still favor verticals in dense townships, demonstrating that regulation, geology, and surface rights collectively determine well-type mix within the tight gas market.


By Location: Offshore Emerges as Fastest-Growing Niche
Onshore projects captured 90.1% of 2025 volume because breakevens sit near USD 2-3/MMBtu and gathering lines are accessible within 60 days of first gas. Offshore tight gas grows at 6.7% CAGR to 2031 as subsea tiebacks and artificial islands enable access to stranded continental-shelf deposits. ADNOC’s Ghasha development aims for 1.5 Bcf/d plateau by 2027, while Equinor pursues North Sea tiebacks that avoid stand-alone platforms.
Offshore wells typically cost twice the onshore average, yet they evade land acquisition delays and water-use controversy. Brazil’s Petrobras is mapping tight potential along pre-salt margins that could piggyback on existing FPSOs. The U.S. Gulf of Mexico’s tight Wilcox holds 50 Tcf of resource, though hurricane exposure raises insurance and downtime risk. Collectively, the segment’s high growth rate reflects the desire for LNG-proximate feedstock and geographic diversification within the tight gas market size.
By End-User: Independent Producers Gain Share Through M&A
Majors retained 35.5% of 2025 revenue, leveraging integrated LNG chains. Independents, however, will grow at 6.6%, aided by private-equity roll-ups and strategic asset buys from divesting supermajors. ConocoPhillips’ USD 22.5 billion Marathon Oil purchase and JAPEX’s USD 1.26 billion Verdad Resources deal illustrate the trend.
Utilities and national oil companies together constitute roughly half of the remaining revenue; they drill tight gas to hedge supply for regulated pipelines or domestic power mandates. Private-equity sponsors recycle assets every 3-5 years, drilling aggressively to book reserves before exit, which accelerates overall activity. The tight gas market continues to reward nimble operators that capitalize on short-cycle developments and hedging agility.
Geography Analysis
North America led the tight gas market with 45.3% share in 2025, producing 15 Bcf/d from the Permian and 12 Bcf/d from the Haynesville. Growth moderates to 5.2% as drilling migrates toward drier gas for LNG outlets. Canada’s Montney and Duvernay flows benefited from the 2024 Coastal GasLink start-up, unlocking westward LNG pathways. Mexico’s Burgos output stagnated as Pemex favored offshore conventional projects, leading U.S. pipeline imports to reach 6.8 Bcf/d.
Asia-Pacific posts the fastest 6.5% CAGR to 2031. CNPC expanded Ordos output by 5 bcm in 2025, and Sichuan exceeded 40 bcm/yr, displacing Beijing coal burn. India approved 12 GW of gas-peaking plants that will rely on Krishna-Godavari tight gas. Australia’s Cooper Basin stayed flat as operators prioritized coal-seam gas while eyeing tight imports for LNG commitments.
Europe faces challenges due to the fracturing bans in Germany and France. While the United Kingdom has lifted its moratorium, seismic thresholds have hindered commercial operations. Equinor is advancing North Sea subsea tieback projects, and Gazprom's Achimov tight reserves continue to supply European pipelines, although sanctions have restricted technology inflow.
Growth in South America is primarily driven by Argentina's Vaca Muerta, where YPF plans to increase output to 60 MM m³/d by 2025 and has secured USD 3 billion in pipeline funding. Shell and Equinor have committed USD 2.5 billion to local tight gas projects, targeting LNG exports by 2029. Brazil is assessing the margins of the Santos Basin, while Bolivia has launched a USD 500 million Chaco program.
In the Middle East and Africa, ADNOC has approved the SARB Deep Gas project, targeting a plateau of 200 MMscf/d by 2029. QatarEnergy has allocated 40% of its USD 150 billion budget for 2026-2030 to unconventional gas development. Saudi Aramco's Jafurah pilot aims to achieve 2 Bcf/d by 2030. Meanwhile, South Africa's Karoo Basin faces delays due to environmental reviews and water scarcity issues.

Competitive Landscape
The Tight Gas Market is moderately fragmented. Supermajors such as ExxonMobil and Shell prune non-core tight gas to finance low-carbon portfolios, whereas independents like ConocoPhillips, Diamondback, and Coterra consolidate acreage to leverage drilling efficiency. Chevron’s triple-frac system shaved 12% off well cost in 2024, letting it expand within constant capital budgets. ADNOC’s USD 17 billion SARB EPC awards reflect the national oil company's appetite for high-cost offshore tight gas when linked to domestic power or LNG strategies. Private-equity-backed firms use faster capital cycles to exploit price windows, challenging larger rivals on cost per foot drilled. Competitive advantage now centers on completion technology, CCS pairing, and access to discounted green finance.
Tight Gas Industry Leaders
Shell PLC
bp p.l.c.
Chevron Corporation
China National Petroleum Corp. (CNPC)
ExxonMobil Corporation
- *Disclaimer: Major Players sorted in no particular order

Recent Industry Developments
- March 2026: Vaquero Midstream announced the completion of pipeline and processing expansions in the Delaware Basin (Permian region). The developments include doubling pipeline capacity to 800 MMcf/d and the addition of a new gas processing plant, increasing total processing capacity to 600 MMcf/d. These expansions are driven by the rising production of associated and tight gas from shale formations.
- March 2026: YPF projected investments of USD 130 billion in hydrocarbon infrastructure by 2031 and USD 50 billion in energy exports by the same year. Argentina is actively expanding the Vaca Muerta formation, one of the largest shale and tight gas reserves globally.
- December 2025: Saudi Aramco commenced production from the Jafurah field, one of the world’s largest unconventional gas developments. Initial production was reported at 450 MMcf/d, with plans to increase output to 2 Bcf/d by 2030.
- February 2025: Bapco Energies, the integrated energy company leading the energy transition in the Kingdom of Bahrain, and EOG Resources Inc., a U.S.-based hydrocarbon exploration company, signed an agreement to evaluate a promising gas exploration prospect in Bahrain.


Global Tight Gas Market Report Scope
Tight gas is an unconventional natural gas found in low-permeability rock formations. Its extraction requires specialized methods, such as hydraulic fracturing, to enable viable production.
The tight gas market is segmented by resource type, well type, location, end-user, and geography. By resource type, the market is segmented into sandstone, limestone, and others. By well type, the market is segmented into conventional and unconventional. By location, the market is segmented into onshore and offshore. By end-user, the market is segmented into oil & gas majors, utilities, independent producers, government, and national oil companies (NOCs), and others. The report also covers market sizes and forecasts for the global tight gas market across major countries in key regions, including North America, Europe, Asia-Pacific, South America, and the Middle East and Africa. For each segment, the market sizing and forecasts have been carried out on the basis of value (USD).
| Sandstone |
| Limestone |
| Others |
| Conventional |
| Unconventional |
| Offshore |
| Onshore |
| Oil & Gas Majors |
| Utilities |
| Independent Producers |
| Government and NOCs |
| Others |
| North America | United States |
| Canada | |
| Mexico | |
| Europe | Germany |
| United Kingdom | |
| France | |
| Italy | |
| NORDIC Countries | |
| Russia | |
| Rest of Europe | |
| Asia-Pacific | China |
| India | |
| Japan | |
| South Korea | |
| ASEAN Countries | |
| Rest of Asia-Pacific | |
| South America | Brazil |
| Argentina | |
| Rest of South America | |
| Middle East and Africa | Saudi Arabia |
| United Arab Emirates | |
| South Africa | |
| Egypt | |
| Rest of Middle East and Africa |
| By Resource Type | Sandstone | |
| Limestone | ||
| Others | ||
| By Well Type | Conventional | |
| Unconventional | ||
| By Location | Offshore | |
| Onshore | ||
| By End-user | Oil & Gas Majors | |
| Utilities | ||
| Independent Producers | ||
| Government and NOCs | ||
| Others | ||
| By Geography | North America | United States |
| Canada | ||
| Mexico | ||
| Europe | Germany | |
| United Kingdom | ||
| France | ||
| Italy | ||
| NORDIC Countries | ||
| Russia | ||
| Rest of Europe | ||
| Asia-Pacific | China | |
| India | ||
| Japan | ||
| South Korea | ||
| ASEAN Countries | ||
| Rest of Asia-Pacific | ||
| South America | Brazil | |
| Argentina | ||
| Rest of South America | ||
| Middle East and Africa | Saudi Arabia | |
| United Arab Emirates | ||
| South Africa | ||
| Egypt | ||
| Rest of Middle East and Africa | ||


Key Questions Answered in the Report
How large is the tight gas market in 2026?
The Tight Gas Market size is projected to be USD 53.63 billion in 2025, USD 57.01 billion in 2026, and reach USD 75.61 billion by 2031, growing at a CAGR of 5.81% from 2026 to 2031.
What is the expected CAGR for tight gas between 2026 and 2031?
The market is forecast to grow at a 5.81% CAGR over 2026-2031.
Which region grows fastest in tight gas through 2031?
Asia-Pacific posts the quickest expansion at a 6.5% CAGR.
Which resource type gains the most share through 2031?
Acid-stimulated limestone carbonate reservoirs grow at 6.4% annually, narrowing the gap with sandstones.
How do CCS projects affect tight gas financing?
CCS integration qualifies projects for green bonds that can lower borrowing costs by 50-100 basis points.
Page last updated on:


