Fire Retardant Paper Market Size and Share
Market Overview
| Study Period | 2019 - 2030 |
|---|---|
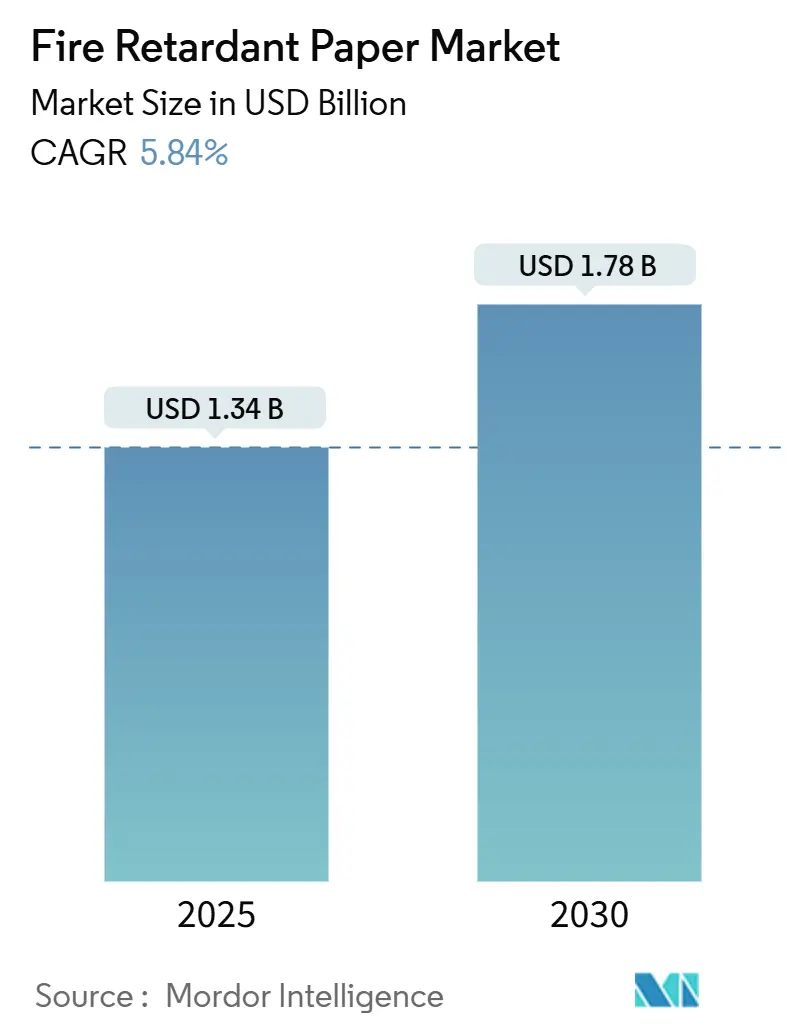
| Market Size (2025) | USD 1.34 Billion |
| Market Size (2030) | USD 1.78 Billion |
| Growth Rate (2025 - 2030) | 5.84% CAGR |
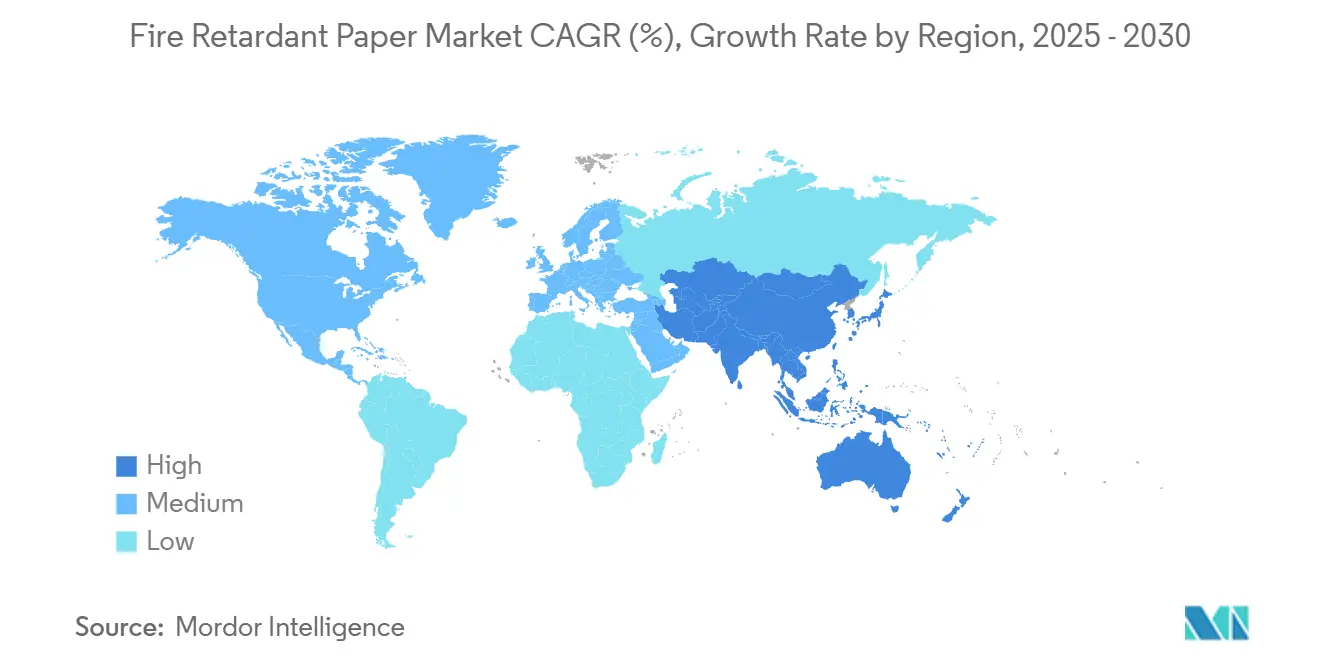
| Fastest Growing Market | Asia Pacific |
| Largest Market | Europe |
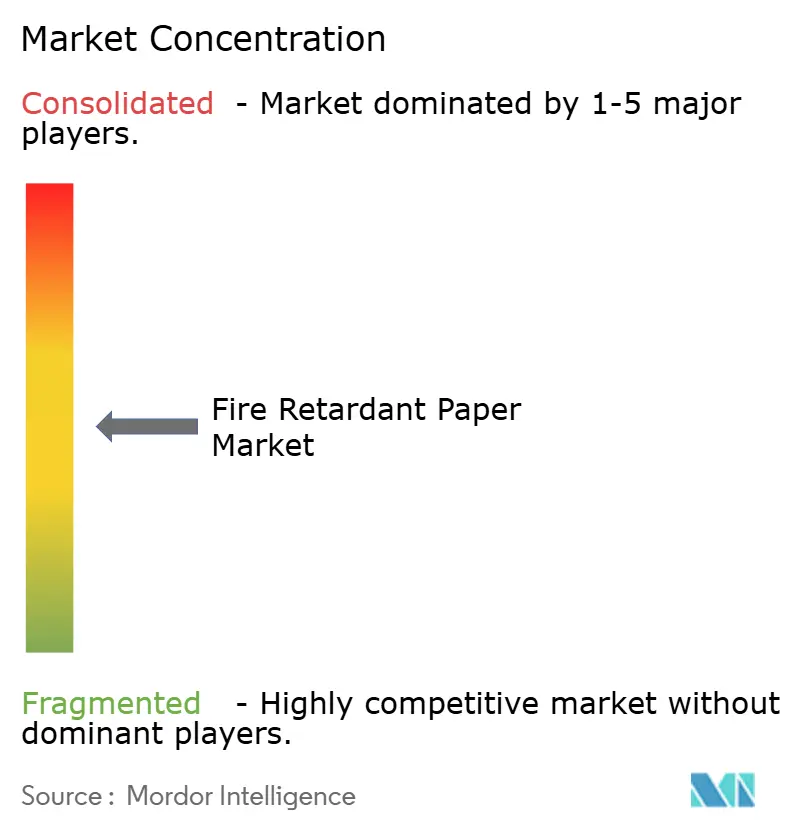
| Market Concentration | Medium |
Major Players *Disclaimer: Major Players sorted in no particular order Image © Mordor Intelligence. Reuse requires attribution under CC BY 4.0. | |
Fire Retardant Paper Market Analysis by Mordor Intelligence
The fire retardant paper market size stands at USD 1.34 billion in 2025 and is projected to reach USD 1.78 billion by 2030, reflecting a 5.84% CAGR over the forecast period. Regulatory pressure, particularly the 2021 International Building Code’s tougher fire-resistance provisions, anchors demand as architects and safety engineers gravitate toward compliant substrates. [1]International Code Council, “2021 International Building Code,” iccsafe.org Momentum is reinforced by Europe’s REACH framework and the United States Environmental Protection Agency’s 2024 risk evaluation of the flame-retardant TCEP, which accelerates the market pivot to halogen-free systems. Across industries, lithium-ion battery logistics, mass-timber construction, and data-center infrastructure add new high-value demand nodes, while cost premiums versus conventional grades linger as a widespread hurdle. Competitive intensity remains moderate because technical entry barriers—especially additive chemistry know-how—slow new entrant velocity, yet niche specialists still secure contracts through formulation agility and rapid prototyping.
Key Report Takeaways
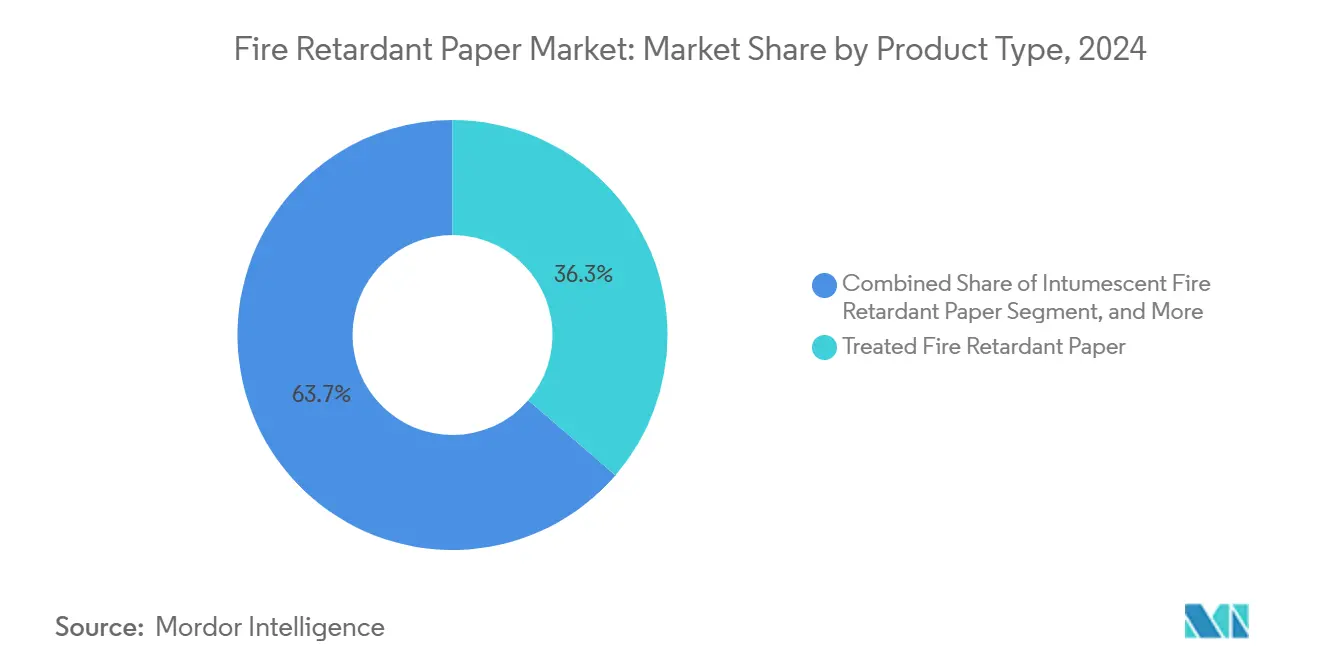
- By product type, treated grades held 36.31% of the fire retardant paper market share in 2024.
- By additive chemistry,the fire retardant paper market size for nitrogen-based systems are advancing at a 6.41% CAGR between 2025-2030.
- By end-use, construction accounted for 38.62% of the fire retardant paper market share in 2024.
- By geography, the fire retardant paper market size for Asia-Pacific region is projected to grow at a 7.63% CAGR between 2025-2030.
Global Fire Retardant Paper Market Trends and Insights
Drivers Impact Analysis*
| Driver | (~) % Impact on CAGR Forecast | Geographic Relevance | Impact Timeline |
|---|---|---|---|
| Rising stringent building and fire-safety codes worldwide | +1.2% | Global, with early adoption in North America and EU | Medium term (2-4 years) |
| Growth in flame-retardant packaging demand for lithium-ion battery logistics | +0.8% | Global, concentrated in APAC manufacturing hubs | Short term (≤ 2 years) |
| Expansion of mass-timber construction using combustible materials | +0.6% | North America and EU, emerging in APAC | Long term (≥ 4 years) |
| Increasing insurance compliance requirements for commercial printing | +0.4% | North America and EU primarily | Medium term (2-4 years) |
| Emergence of e-commerce furniture brands seeking flame-rated packaging | +0.3% | Global, concentrated in urban markets | Short term (≤ 2 years) |
| Adoption of self-extinguishing paper in data-center cable trays | +0.2% | Global, led by North America | Medium term (2-4 years) |
| Source: Mordor Intelligence | |||
Rising Stringent Building and Fire-Safety Codes Worldwide
Revisions to national and international building regulations have repositioned the fire retardant paper market as an integral element of project compliance rather than a niche upgrade. Canada’s 2020 National Building Code introduced new fire-protection clauses for encapsulated mass-timber buildings up to 12 stories, directly boosting paperwork, site signage, and surface-protection orders that specify certified flame-retardant substrates. China’s mandatory GB 55037-2022 standard, effective mid-2023, imposes updated flame-spread performance thresholds on interior components, driving local converters to procure compliant rolls. In the United Kingdom, the 2025 Timber in Construction Roadmap intertwines carbon-reduction goals with explicit fire-safety protocols, thus widening opportunities for treated liners used during timber framing. [2]UK Government, “Timber in Construction Roadmap 2025,” gov.uk Collectively, these regulations convert safety documents, protective wrappings, and temporary barriers from optional to mandatory items, enlarging baseline demand. As more jurisdictions adopt near-zero-tolerance postures on combustible paper goods, sustained volume growth becomes a regulatory certainty.
Growth in Flame-Retardant Packaging Demand for Lithium-Ion Battery Logistics
Lithium-ion packs can enter thermal runaway at temperatures above 150 °C, making flame containment critical during storage and transit. The U.S. Department of Transportation identified packaging design as the principal safeguard against propagation events, promoting multilayer solutions that include self-extinguishing paper honeycombs. Engineering guidance by A-P-T Research calls for container-in-container concepts lined with non-conductive, fire-retardant padding to manage damaged modules, accelerating high-GSM paper imports in Asia-Pacific export corridors. Japan’s Kureha is expanding PVDF output for separator films, but parallel investments spill over into flame-rated external packaging, validating adjacent paper demand. Because every gigawatt-hour of battery cell output translates into thousands of transport cycles, packaging decisions scale rapidly, ensuring that the fire retardant paper market captures a long-tail growth engine.
Expansion of Mass-Timber Construction Using Combustible Materials
Developers champion mass-timber for embodied-carbon savings, yet building officials demand proven fire-mitigation layers when exposed wood is specified. The International Building Code has permitted 12-story timber structures since 2021, provided compartmentalized fire-protection systems are documented, which has expanded orders of laminated, flame-retardant site protocols and cavity liners. British Columbia’s 2018 Fire Code updates obligate contractors to install temporary encapsulation sheets—often flame-treated paper composites—during erection phases to restrict ignition hazards before sprinkler activation. As Europe’s Cross-Laminate Timber market grows, architects increasingly specify intumescent-backed paper wraps for joint sealing, amplifying volumes. The linkage between sustainable timber and certified fire-retardant accessories cements a multi-decade demand runway for paper mills focused on treated and intumescent technologies.
Increasing Insurance Compliance Requirements for Commercial Printing
Underwriters are recalibrating property-loss models, prompting printers to adopt certified flame-retardant sheets for catalogs, signage, and manuals when housed in high-density storage. FM Global’s 2025 data-center bulletin discourages plastics due to smoke toxicity but lists fire-retardant cellulose as an acceptable cable-tray insert, offering an alternative that reduces insurance surcharges. Concurrently, OSHA fire-prevention rules dictate written fire-safety plans, and facilities that demonstrate low-ignition materials secure favourable premiums. Insurer-driven procurement policies hence tilt purchasing toward halogen-free, phosphorus-based grades, lifting average selling prices and reinforcing the fire retardant paper market’s profitability vector.
Restraints Impact Analysis*
| Restraint | (~) % Impact on CAGR Forecast | Geographic Relevance | Impact Timeline |
|---|---|---|---|
| Higher cost versus conventional paper | -1.8% | Global, most pronounced in price-sensitive markets | Short term (≤ 2 years) |
| Performance trade-offs in printability and recyclability | -0.9% | Global, particularly in packaging applications | Medium term (2-4 years) |
| Regulatory scrutiny on halogenated flame retardants | -0.6% | EU and North America leading, expanding globally | Long term (≥ 4 years) |
| Supply volatility of specialty mineral fillers (ATH, MDH) | -0.4% | Global, concentrated impact on major producers | Short term (≤ 2 years) |
| Source: Mordor Intelligence | |||
Higher Cost Versus Conventional Paper
Flame-retardant formulations rely on expensive mineral fillers ATH or MDH can occupy up to 70% of sheet mass, pushing unit costs 30–60% above commodity grades. [3]Hull T. Richard, “Fire Retardant Action of Mineral Fillers,” uclan.ac.uk 3M projected USD 340 million in environment-related capital outlays for 2025-2026, a figure that suppliers inevitably embed in product pricing. While data-center, aerospace, and defense customers absorb premiums, commodity book publishing and general packaging segments resist substitution, stalling broader penetration in developing economies where price sensitivity is acute.
Performance Trade-Offs in Printability and Recyclability
Flame-retardant additives enhance LOI values but often impair ink absorbency and fiber bonding, increasing press-room rejects. Recyclers complain of phosphorus residue contaminating de-inking effluent, prompting mills to segregate waste streams, which inflates operating overheads. Until coater chemistry advances deliver parity print gloss and recycling compatibility, certain high-volume print runs will remain on conventional paper despite fire-risk considerations.
*Our forecasts treat driver/restraint impacts as directional, not additive. The impact forecasts reflect baseline growth, mix effects, and variable interactions.
Segment Analysis
By Product Type: Intumescent Systems Drive Innovation
Treated grades dominated 2024 volume because converters can integrate them into existing calendars with limited capital expenditure, securing 36.31% of the fire retardant paper market share. Nonetheless, intumescent variants, which swell to form insulating chars at temperatures above 200 °C, are on track for a 6.03% CAGR to 2030, the fastest of all product categories. Researchers have demonstrated that electrospun polyacrylonitrile nanofibers grafted into paper matrices yield self-extinguishing times below three seconds, bolstering performance credentials for next-generation grades. Such gains invite high-margin niches like aerospace manuals and semiconductor fab clean-room supplies, areas where ignition tolerance is measured in milliseconds.
Intumescent processing demands precise synergy among acid sources, carbon donors, and blowing agents; small deviations cause foam collapse or blistering during calendaring. Mills with in-house compounding lines therefore hold a defensible edge. Furthermore, char-expansion rates double as thermal-insulation indexes, creating a marketing lever versus treated grades. Yet the higher binder load needed to anchor intumescent layers can dull print resolution, pushing R&D toward micro-encapsulated acids that release only during fire events. Over the outlook, treated grades will retain baseline dominance, but commercial proof points in mass-timber wraps and battery-shipping inserts suggest the fire retardant paper market will increasingly migrate toward intumescence for critical-risk verticals.


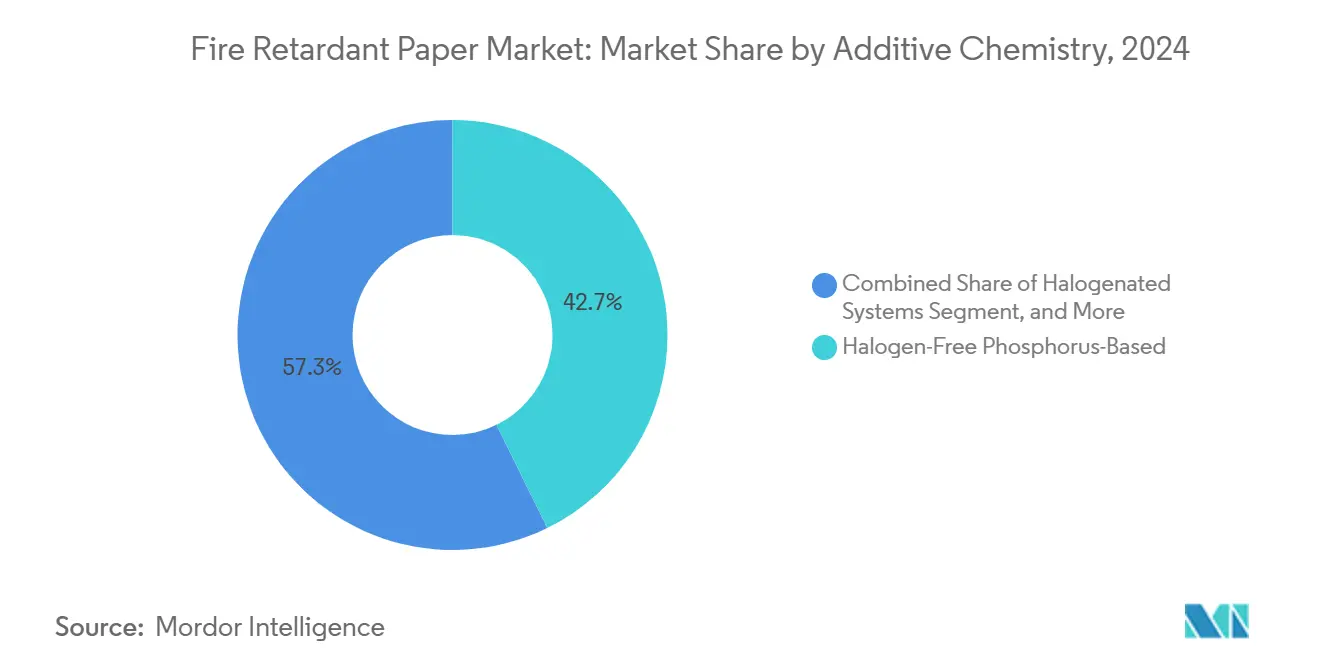
By Additive Chemistry: Phosphorus Systems Gain Regulatory Advantage
Halogen-free phosphorus formulas captured 42.73% of 2024 revenue as buyers prioritize low-smoke toxicity and compliance with REACH restrictions. Contemporary reviews show phosphorus additives operate in both gas and condensed phases, releasing PO· radicals that quench flame and generating protective polyphosphoric acid char on cellulose surfaces. [4]Yin Zheng, “Contemporary Phosphorus Flame Retardants,” frontiersin.org The synergy is amplified when nitrogen donors are co-formulated, explaining why nitrogen systems are forecast for a 6.41% CAGR through 2030.
Regulatory actions accelerate the shift. EPA’s September 2024 final TCEP evaluation declared unreasonable health risks, effectively removing a legacy chlorine-phosphate product line. Simultaneously, Japan’s quasi-non-combustible list mandates quantifiable smoke-density ceilings, which phosphorus-nitrogen hybrids meet more readily than brominated alternatives. Mineral fillers maintain share for cost-control, but their weight penalty constrains adoption in weight-sensitive packaging. Consequently, suppliers race to functionalize phosphorus esters at lower inclusion rates to preserve tensile properties while retaining V-0 ratings.
From a supply-chain lens, phosphorus pentoxide and red phosphorus feedstocks are geographically diversified, limiting shock exposure compared with ATH. Specialty chemical joint ventures—exemplified by Ahlstrom’s tie-up with independent additive houses—now co-develop proprietary oligomers, granting first-mover access and intellectual-property shields. As EU Green Deal taxonomy metrics reward low-smoke, non-halogenated products, phosphorus chemistry will likely reinforce its leadership position, steering the competitive baseline of the fire retardant paper market.
By End-Use Industry: Packaging Segment Accelerates Growth
Construction and building applications accounted for 38.62% of global volume in 2024 as building-code compliance remains the largest single purchasing trigger. However, logistics packaging tied to lithium-ion batteries and e-commerce furniture is expected to register the highest 6.92% CAGR through 2030. The battery boom alone implies every gigafactory start-up adds tens of thousands of pallet movements that demand UN 3480-compliant packaging, much of which specifies flame-retardant liners.
In parallel, upholstered-furniture standards obligate nationwide combustion tests on products destined for residential use, driving furniture shippers to adopt certified paperboard dividers that double as brandable surfaces. Compared with foil or glass-fiber mats, paperboard is lighter and yields conventional curbside recyclability, offering both sustainability and cost offset. Electronics retailers now embed flame-retardant corrugated inserts to satisfy carrier insurance mandates, broadening unit sales. Given that global parcel volumes exceeded 160 billion in 2024, even minor penetration gains translate into substantial square-meter growth for the fire retardant paper market.
Geography Analysis
Europe’s dominant 32.86% share in 2024 reflects tightly harmonised safety codes, notably Germany’s DIN 4102 and the United Kingdom’s fire-safety reforms that restrict organohalogen content. Insurance underwriters often require EN 13501-1 ratings for construction documentation and temporary protection sheets, converting code language into transactional demand. France’s push for low-smoke interiors in rail rolling-stock further broadens niche adoption. Southern markets such as Spain and Italy trail in absolute volume but record growth aligned with EU recovery-fund infrastructure outlays, underscoring steady tonnage expansion.
Asia-Pacific’s 7.63% CAGR forecast benefits from industrial diversification and regulatory modernization. China’s urban-apartment retrofits call for flame-resistant renovation materials, including paper-backed acoustic panels that integrate halogen-free phosphorus systems. Japan’s quasi-non-combustible list streamlines approval cycles for specialty grades, while India’s Bureau of Indian Standards drafts specification IS 15495 for flame-retardant cellulose boards, injecting transparency into procurement. Electronics manufacturing clusters in South Korea and Taiwan insist on UL 94-V0 documentation for outbound packaging, directly boosting demand for coated fire-retardant partitions.
North America exhibits mature volumes yet incremental growth. The 2021 International Building Code adoption drives replacement of older publications, signage, and protective wraps with compliant versions. Canada’s mass-timber push reinforces treated-paper shielding on construction sites, and Mexico’s maquiladora corridor begins mandating spark-containment packaging for cross-border battery shipments. South America and the Middle East remain emergent, but Brazil’s insurance market now discounts premiums for warehouses that adopt NFPA 701-rated pallet sheets, forecasting broader regional pickup once codes solidify.

Competitive Landscape
The fire retardant paper market shows moderate concentration: the top five vendors hold just under 35% of worldwide revenue, leaving whitespace for regional specialists. 3M’s announced PFAS exit by 2025 reshapes supplier maps, forcing brand owners to dual-source phosphorus lines amid looming halogen bans. Georgia-Pacific leverages integrated pulp assets and complementary gypsum boards to sell laminated fire-rated wraps for mass-timber projects, extracting cross-segment synergies. Ahlstrom concentrates on multi-layer structures where thin intumescent coatings combine with printable top sheets, an architecture now favored in European exhibition-hall signage.
Niche firms such as Onyx Specialty Papers and Sweden’s Billerud capture bespoke runs for battery-shipper SP codes, commanding premiums above USD 5,000 per ton through rapid design-service loops. Asian players Nippon Paper, Oji Holdings, and Lintec deploy continuous-liner technologies that embed phosphorus-nitrogen blends at lower coat-weights, clipping raw-material costs below 20% of sales and improving return profiles. Supply-chain alliances proliferate; Huntsman provides ATH slurries via dedicated pipelines to European mills, locking in contracts that shield both parties from spot-market volatility.
Sustainability narratives are gaining strategic weight. Stora Enso’s Oulu line, ramping to full capacity by 2027, positions FSC-certified biomass as a differentiator in government tenders requiring life-cycle-assessment disclosures. Lintec’s Integrated Report highlights pilot production of carbon-nanotube pellicles, hinting at cross-fertilization between semiconductor filtration media and future ultra-thin flame-retardant paper, a potential moat against commodity competition. Competitive trajectories will therefore hinge on the twin pillars of regulatory anticipation and circular-economy readiness.
Fire Retardant Paper Industry Leaders
Ahlstrom Oyj
Georgia-Pacific LLC
3M Company
Guyenne Papier
Flexlink, LLC
- *Disclaimer: Major Players sorted in no particular order

Recent Industry Developments
- April 2025: Stora Enso posted EUR 2.362 billion (USD 2.76 billion) Q1 2025 revenue, driven partly by the ramp-up of its Oulu consumer-board line slated for fire-retardant packaging.
- January 2025: 3M reported USD 6.3 billion Q4 2024 Safety and Industrial segment sales and reiterated its plan to cease PFAS production by end-2025, catalyzing alternative-chemistry uptake.
- December 2024: EPA finalized carbon tetrachloride rules under TSCA, introducing exposure-monitoring programs that indirectly affect flame-retardant facilities.
- November 2024: EPA updated decaBDE and IPP regulations, narrowing halogenated portfolios and pressing converters toward halogen-free chemistries.


Global Fire Retardant Paper Market Report Scope
| Intumescent Fire Retardant Paper |
| Non-Intumescent Fire Retardant Paper |
| Coated Fire Retardant Paper |
| Treated Fire Retardant Paper |
| Halogenated Systems |
| Halogen-Free Phosphorus-Based |
| Nitrogen-Based |
| Mineral Fillers (ATH, MDH, others) |
| Construction and Building |
| Electrical and Electronics |
| Transportation |
| Packaging |
| Commercial Printing and Publishing |
| Other End-Use Industry |
| North America | United States | |
| Canada | ||
| Mexico | ||
| South America | Brazil | |
| Argentina | ||
| Rest of South America | ||
| Europe | Germany | |
| United Kingdom | ||
| France | ||
| Italy | ||
| Spain | ||
| Russia | ||
| Rest of Europe | ||
| Asia-Pacific | China | |
| Japan | ||
| India | ||
| South Korea | ||
| Australia | ||
| Rest of Asia-Pacific | ||
| Middle East and Africa | Middle East | Saudi Arabia |
| United Arab Emirates | ||
| Turkey | ||
| Rest of Middle East | ||
| Africa | South Africa | |
| Egypt | ||
| Rest of Africa | ||
| By Product Type | Intumescent Fire Retardant Paper | ||
| Non-Intumescent Fire Retardant Paper | |||
| Coated Fire Retardant Paper | |||
| Treated Fire Retardant Paper | |||
| By Additive Chemistry | Halogenated Systems | ||
| Halogen-Free Phosphorus-Based | |||
| Nitrogen-Based | |||
| Mineral Fillers (ATH, MDH, others) | |||
| By End-Use Industry | Construction and Building | ||
| Electrical and Electronics | |||
| Transportation | |||
| Packaging | |||
| Commercial Printing and Publishing | |||
| Other End-Use Industry | |||
| By Geography | North America | United States | |
| Canada | |||
| Mexico | |||
| South America | Brazil | ||
| Argentina | |||
| Rest of South America | |||
| Europe | Germany | ||
| United Kingdom | |||
| France | |||
| Italy | |||
| Spain | |||
| Russia | |||
| Rest of Europe | |||
| Asia-Pacific | China | ||
| Japan | |||
| India | |||
| South Korea | |||
| Australia | |||
| Rest of Asia-Pacific | |||
| Middle East and Africa | Middle East | Saudi Arabia | |
| United Arab Emirates | |||
| Turkey | |||
| Rest of Middle East | |||
| Africa | South Africa | ||
| Egypt | |||
| Rest of Africa | |||


Key Questions Answered in the Report
What is the current value of the fire retardant paper market?
It stands at USD 1.34 billion in 2025 and is forecast to hit USD 1.78 billion by 2030.
Which region is growing fastest for fire-retardant paper?
Asia-Pacific is projected to grow at 7.63% CAGR through 2030, outpacing all other regions.
Which product type is expanding most rapidly?
Intumescent fire-retardant paper is expected to post a 6.03% CAGR between 2025 and 2030.
Why are phosphorus-based additives gaining traction?
Regulatory bans on halogenated flame retardants and lower smoke toxicity give phosphorus systems a compliance and safety edge.
What factor most limits wider adoption?
Premium pricing versus conventional grades remains the primary barrier, especially in cost-sensitive sectors.
Which end-use segment shows the highest growth?
Logistics packagingÑparticularly for lithium-ion batteriesÑis forecast to register a 6.92% CAGR to 2030.
Page last updated on:


