Recovered Paper Market Size and Share
Market Overview
| Study Period | 2020 - 2031 |
|---|---|
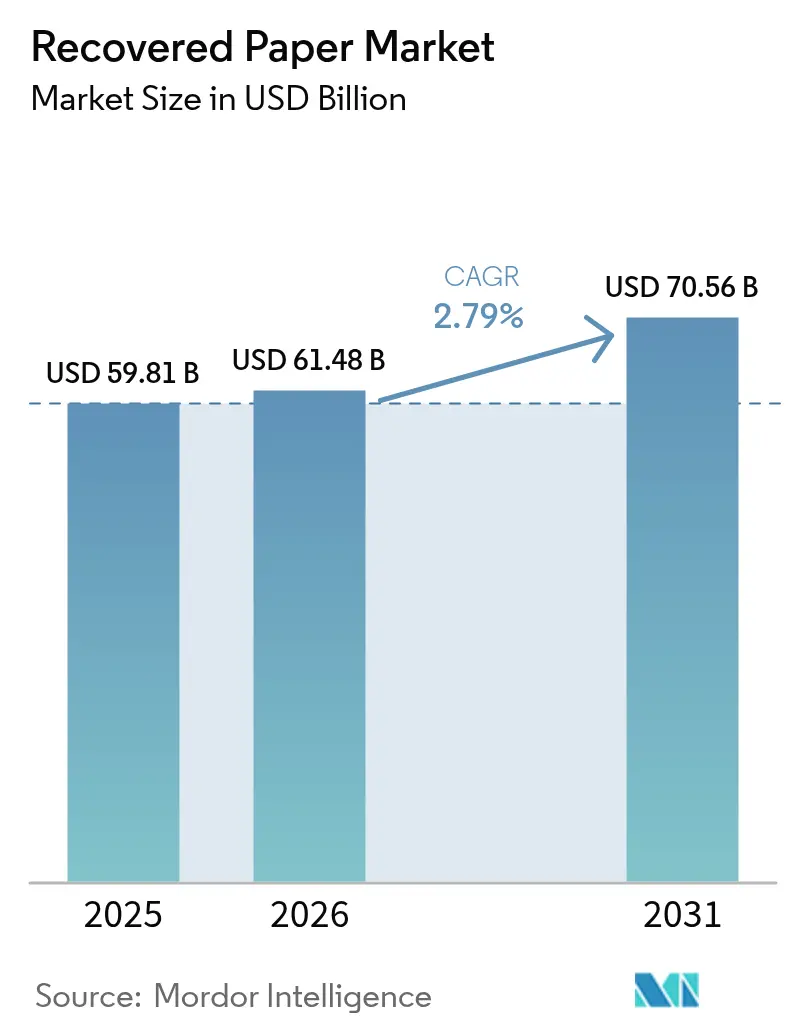
| Market Size (2026) | USD 61.48 Billion |
| Market Size (2031) | USD 70.56 Billion |
| Growth Rate (2026 - 2031) | 2.79% CAGR |
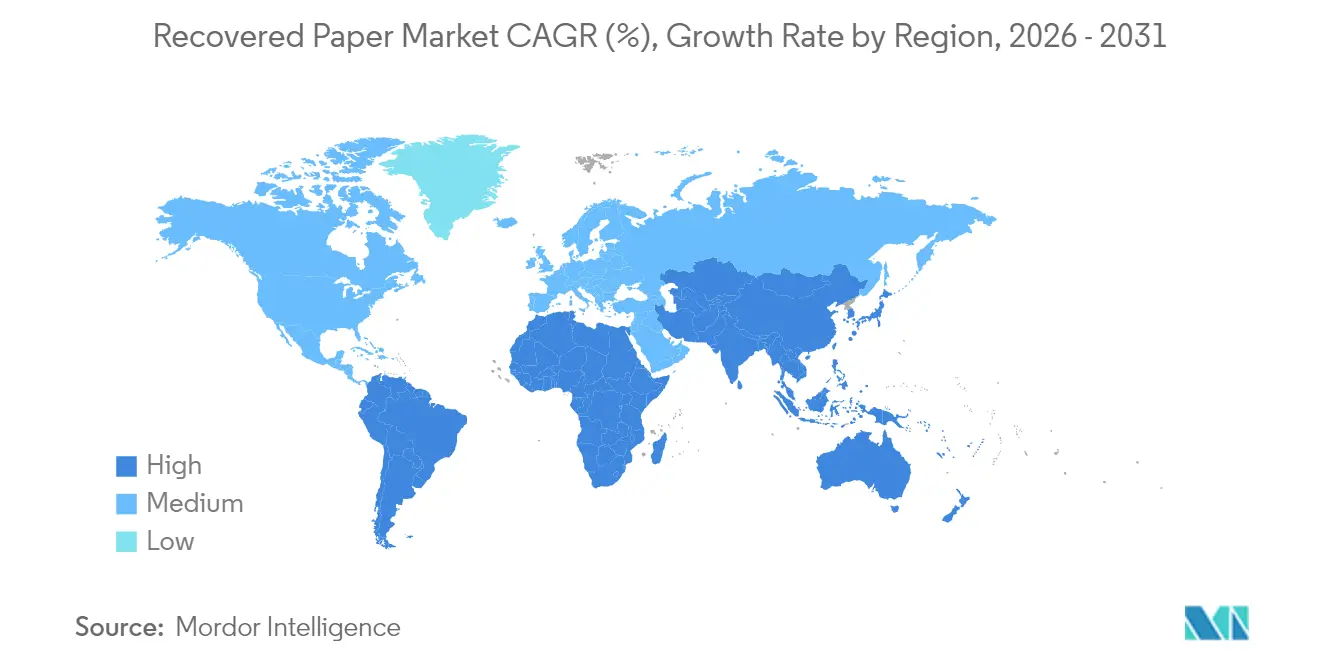
| Fastest Growing Market | Asia Pacific |
| Largest Market | Asia Pacific |
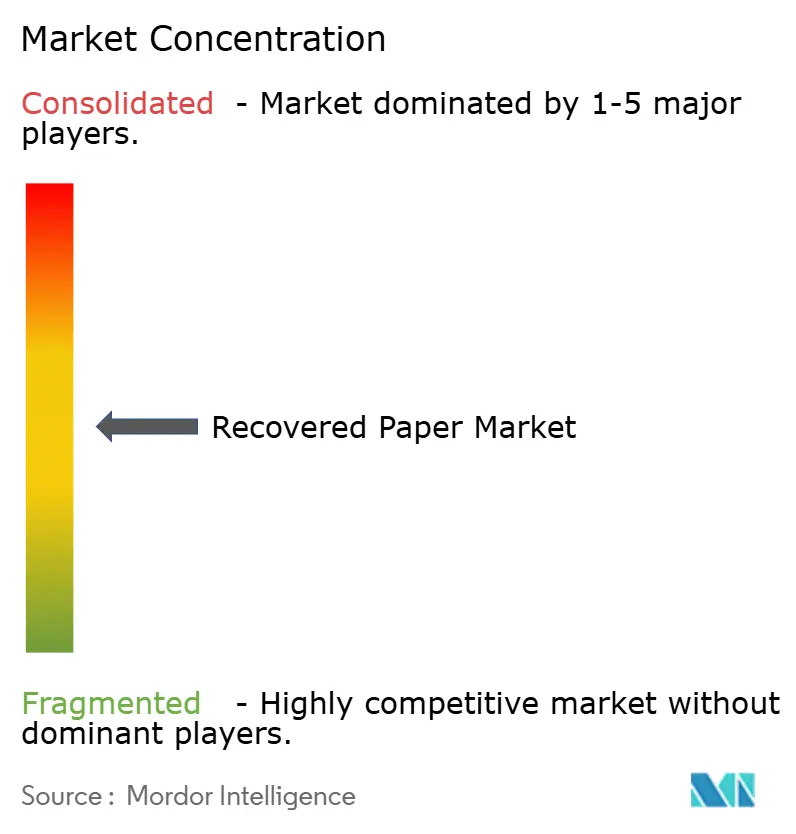
| Market Concentration | Medium |
Major Players *Disclaimer: Major Players sorted in no particular order Image © Mordor Intelligence. Reuse requires attribution under CC BY 4.0. | |
Recovered Paper Market Analysis by Mordor Intelligence
The recovered paper market size was valued at USD 59.81 billion in 2025 and estimated to grow from USD 61.48 billion in 2026 to reach USD 70.56 billion by 2031, at a CAGR of 2.79% during the forecast period (2026-2031). Containerboard demand continues to pull large volumes of post-consumer corrugated material into recycling loops, while brand owners accelerate recycled-content commitments to manage Scope 3 emissions. Processing margins remain defensible as energy-efficient equipment offsets higher logistics costs, yet fiber price volatility linked to freight disruptions forces operators to deepen inventory buffers. Technology investments in optical sorting, advanced pulping and predictive maintenance are lifting yield rates and creating competitive separation among players with the scale to finance modernization. North America, Europe and Asia-Pacific together account for the majority of installed capacity, although regional trade flows keep re-balancing in response to Chinese import curbs and shifting freight economics. Overall, the recovered paper market navigates maturing supply pools by tapping under-served residential streams and by broadening the recovered paper industry’s value proposition to adjacent fiber-based applications.
Key Report Takeaways
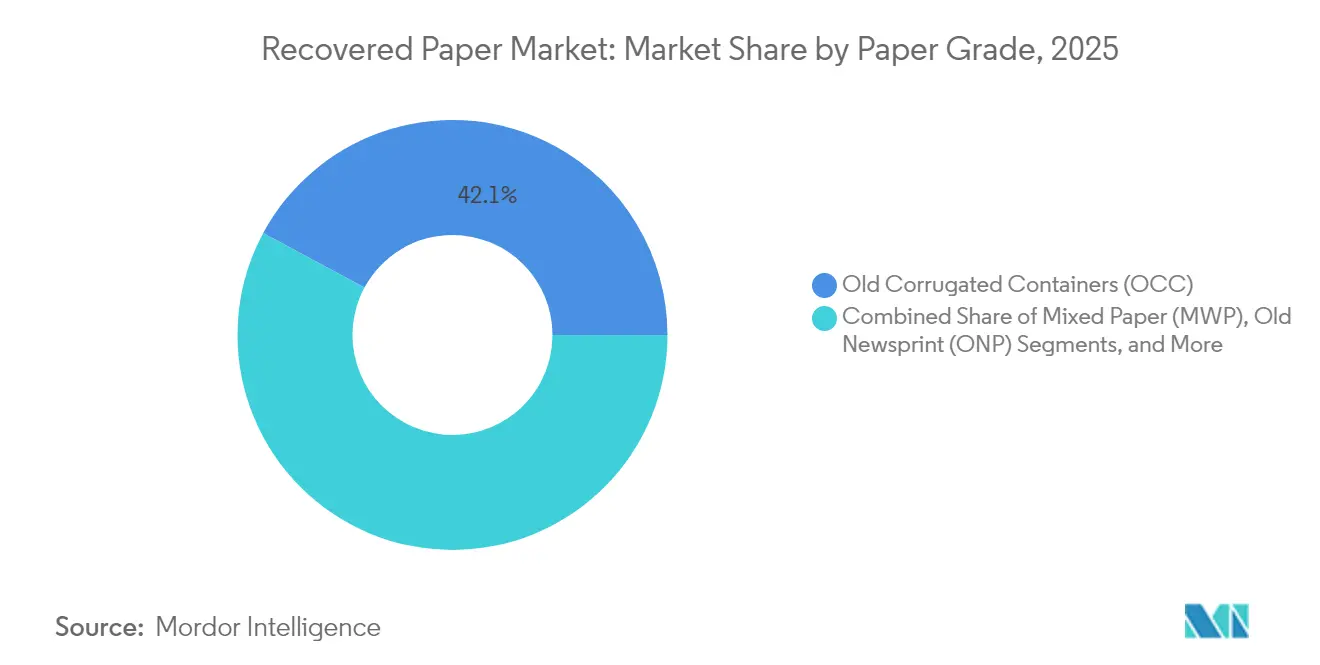
- By paper grade, Old Corrugated Containers held 42.14% of recovered paper market share in 2025, whereas Sorted Office Paper is forecast to expand at a 3.32% CAGR through 2031.
- By end-use industry, packaging and corrugated boxes commanded 57.72% of the recovered paper market size in 2025, while tissue and sanitary applications are advancing at a 3.71% CAGR to 2031.
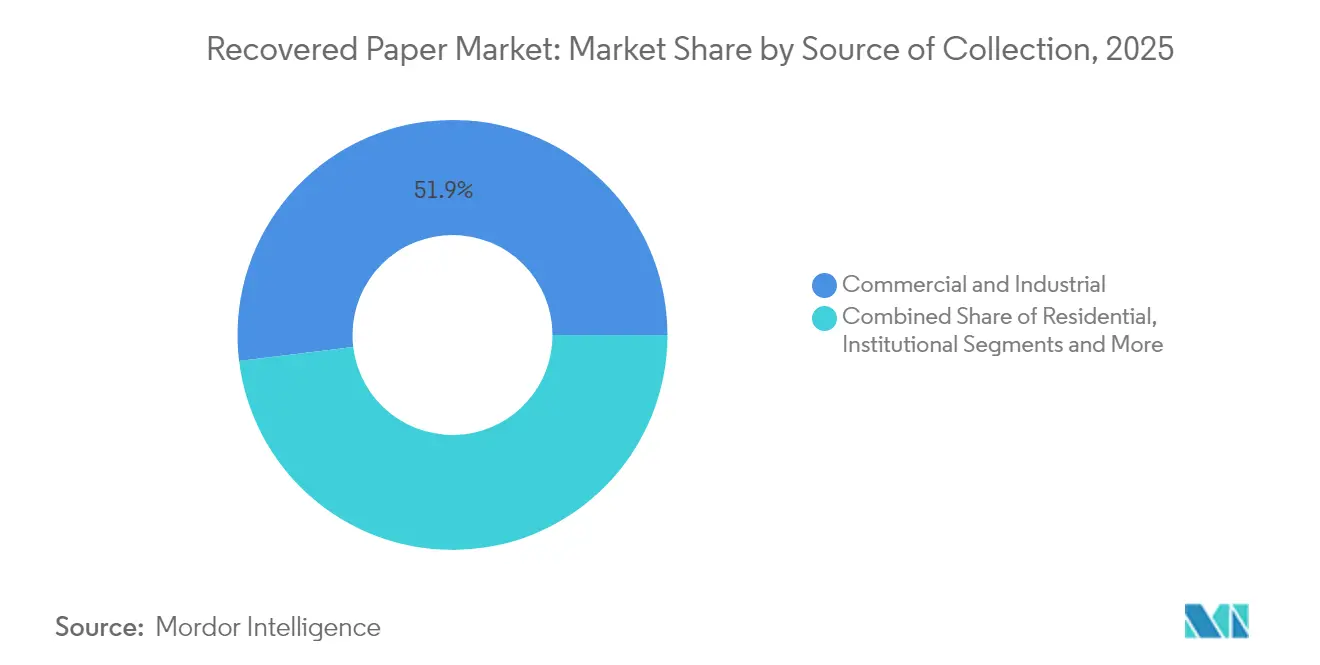
- By source of collection, commercial and industrial streams accounted for 51.93% of the recovered paper market size in 2025; residential collection is projected to register a 4.02% CAGR between 2026 and 2031.
- By processing technology, non-de-inked recycling led with 59.32% of recovered paper market share in 2025; de-inking lines exhibit the fastest growth at a 4.74% CAGR through 2031.
- By geography, Asia-Pacific commanded a significant 40.12% share of the 2025 revenue, solidifying its status as the epicenter for capacity expansions. Projections indicate that this region will also achieve the steepest CAGR through 2031.
Note: Market size and forecast figures in this report are generated using Mordor Intelligence’s proprietary estimation framework, updated with the latest available data and insights as of 2026.
Global Recovered Paper Market Trends and Insights
Drivers Impact Analysis*
| Driver | (~) % Impact on CAGR Forecast | Geographic Relevance | Impact Timeline |
|---|---|---|---|
| E-commerce surge boosting containerboard demand | +0.8% | Global; strongest in North America, Europe, Asia-Pacific | Medium term (2-4 years) |
| Regulatory push for recycled-content packaging | +0.6% | Europe, North America; spillover to Asia-Pacific | Long term (≥ 4 years) |
| Cost advantage versus virgin pulp | +0.4% | Global | Short term (≤ 2 years) |
| AI-enabled optical sorting improving yield | +0.3% | North America, Europe, advanced Asia-Pacific markets | Medium term (2-4 years) |
| Scope-3 decarbonization targets of brand owners | +0.5% | Global; led by multinationals | Long term (≥ 4 years) |
| Export curbs on wastepaper spurring local investment | +0.4% | North America, Europe, Southeast Asia | Medium term (2-4 years) |
| Source: Mordor Intelligence | |||
E-commerce Surge Boosting Containerboard Demand
Global online retail fulfilled 15.3 billion parcels in 2024, up 12% year on year, and each shipment required at least one corrugated box that ultimately enters the recycling stream. [1] Fast Company Staff, “Amazon’s Packaging Problem: 15.3 Billion Packages and Growing Environmental Impact,” Fast Company, fastcompany.com High parcel density improves collection efficiency and strengthens the recovered paper market’s feedstock security. Distribution centers now embed reverse-logistics docks that bale used boxes on-site, reducing contamination and trucking miles. Real-time sales analytics allow box converters to align run lengths with order volatility, minimizing trim waste and stabilizing fiber demand across seasons. Large retailers also fund take-back programs that gather corrugated packaging from customers at store entrances, widening the capture funnel beyond curbside pickups. These closed-loop practices anchor the recovered paper market by guaranteeing predictable OCC flows for mill re-feeds.
Regulatory Push for Recycled-Content Packaging
The European Union has adopted a binding target that 85% of corrugated cardboard and 75% of other paper packaging be recycled by 2030, while extended producer responsibility schemes make brand owners pay the full cost of collection and processing. [2]European Commission, “Single-Use Plastics Directive and Packaging Regulations,” Europa, europa.eu Similar bills are advancing in several U.S. states. These obligations accelerate procurement of recycled fiber, underpinning mill expansion projects announced across Germany, Spain and the Midwest United States. Blockchain-based tracking offered by companies such as Amcor records fiber origin, bale weights and contamination scores, thus confirming regulatory compliance at item level. Mandated disclosures also bolster investor appetite for recycling infrastructure because revenue visibility improves under minimum-content rules.
AI-Enabled Optical Sorting Improving Yield
Machine-learning classifiers paired with hyperspectral cameras now detect composite laminates and food-soiled fiber with 95% accuracy, a marked improvement over the 70-80% accuracy of early near-infrared sorters. This precision lifts average mill yield by 2-3 percentage points, translating into material cost savings of USD 6–8 per ton processed at current OCC prices. Continuous image feeds also adjust air-jet timing on the fly, lowering eject errors and cutting energy use. Operators that retrofit AI sorters report a 20% reduction in manual picking hours, easing labor constraints and enabling 24/7 shifts. The capital outlay is sizable, yet payback periods fall below four years in high-volume plants, a threshold that is re-shaping merger targets toward facilities able to accommodate optical islands.
Scope-3 Decarbonization Targets of Brand Owners
Global consumer-goods companies must confront the indirect emissions embedded in packaging. Target Corporation aims for net-zero across its chain by 2040 and stipulates recycled-content minima in paperboard purchased from converters. Samsonite overlays similar purchasing rules on luggage suppliers and tracks compliance through life-cycle assessment dashboards. Berlin Packaging guarantees recycled fiber inputs for clients’ specialty containers and signs multi-year offtake contracts with mills to secure supply. These mandates provide long-dated demand that de-risks investments in de-inking lines and energy-efficient pulpers, reinforcing the recovered paper industry’s growth runway.
Restraints Impact Analysis*
| Restraint | (~) % Impact on CAGR Forecast | Geographic Relevance | Impact Timeline |
|---|---|---|---|
| Shrinking newsprint and office-paper supply pool | −0.4% | Global; higher in developed markets | Long term (≥ 4 years) |
| Logistics-driven fiber-price volatility | −0.3% | Global; acute in island and landlocked regions | Short term (≤ 2 years) |
| Composite-packaging contaminants | −0.5% | Global; more visible in mature economies | Medium term (2-4 years) |
| Stricter de-inking effluent norms | −0.2% | Europe, North America; emerging in Asia-Pacific | Long term (≥ 4 years) |
| Source: Mordor Intelligence | |||
Shrinking Newsprint and Office-Paper Supply Pool
Digital news platforms and paperless offices are eroding high-grade fiber availability. With many metropolitan dailies switching to weekend-only print runs, tonnage of old newsprint entering recovery circuits declined further in 2025. Cloud storage adoption equally trims office-paper waste, tightening supply of Sorted Office Paper that historically fed de-inked pulp used in premium tissue. Mills compensate by diverting lower-grade mixed paper, yet contamination elevates bleach and surfactant consumption, raising operating costs. Some plants add near-infrared pre-sorters to offset quality loss, but capital needs deter smaller operators, amplifying market consolidation pressure.
Logistics-Driven Fiber-Price Volatility
Supply chains remain exposed to shipping disruptions. During 2024, Red Sea transit risks doubled freight rates on Asia-to-Europe lanes, inflating delivered OCC prices by as much as USD 50 per ton. North American mills faced drayage delays owing to port labor strikes, forcing spot purchases at inflated prices. Since trucking accounts for nearly 30% of recovered fiber cost in rural catchments, diesel price swings translate quickly into mill gate values. Operators hedge fuel exposure through index-linked surcharges, but smaller balers struggle with working-capital strain when price spikes exceed credit limits.
*Our forecasts treat driver/restraint impacts as directional, not additive. The impact forecasts reflect baseline growth, mix effects, and variable interactions.
Segment Analysis
By Paper Grade: OCC Dominance Amid SOP Growth Potential
Old Corrugated Containers contributed 42.14% of 2025 revenue, confirming their centrality to the recovered paper market. High collection rates, low ink loads and uniform sheet structure allow efficient re-pulping, driving cost leadership in containerboard furnish. The recovered paper market size for OCC-sourced furnish is projected to rise in line with e-commerce parcel volumes, while smart balers installed at distribution hubs enhance bale density and lower freight spend. Brand programs that offer box-return credits further stabilize OCC availability across holiday peaks.
Sorted Office Paper represents the fastest-expanding grade with a 3.32% CAGR to 2031. Corporate archive digitization campaigns yield large purges of legacy files, temporarily boosting feedstock quality. De-inking plants prefer SOP because its long fibers and limited mechanical wear improve tensile strength in premium tissue. To capitalize, operators sign takeback contracts with records-management providers that guarantee fiber flow and lock in pricing. Mixed Paper faces quality variability; optical sort upgrades mitigate risk, yet margin dilution persists. Old Newsprint continues to contract, encouraging mills to pivot toward specialty uses such as cellulose insulation. Advanced pulping technologies like Georgia-Pacific’s Juno system unlock higher value from difficult grades, demonstrating that innovation can extend usable fiber pools.


By End-use Industry: Packaging Leadership with Tissue Growth
Packaging and corrugated boxes held 57.72% of the recovered paper market share in 2025, anchored by robust cartonboard demand from grocery delivery and omnichannel retail. Producers integrate recycling plants adjacent to box-making units, shaving transport cost and reducing carbon footprints. The recovered paper market size tied to packaging also benefits from design-for-recyclability guidelines that favor mono-fiber solutions over plastic composites.
Tissue and sanitary products, though smaller in base, register the highest 3.71% CAGR through 2031 as consumers favor eco-labeled toilet tissue and paper towels. De-inked pulp from SOP improves brightness and softness, allowing tissue brands to market premium recycled lines. Printing and writing uses continue to slide, yet high-security documents sustain a niche that commands price premiums. Non-paper applications such as fiber-reinforced panels for construction collect momentum, underpinned by LEED credits that reward recycled content.
By Source of Collection: Commercial Dominance with Residential Growth
Commercial and industrial streams delivered 51.93% of global volume in 2025. Distribution centers bale corrugated packaging on-site, achieving contamination rates below 1% and commanding price premiums. Retail chains deploy smart compaction units with IoT sensors that trigger pickup only when bins reach threshold weight, optimizing route economics.
Residential curbside programs expand under extended producer responsibility statutes, driving a 4.02% CAGR in household-sourced fiber to 2031. Education campaigns target correct sorting of pizza boxes and coated cartons, lowering reject rates. Municipalities that switched to single-stream collection have begun partial rollbacks to dual-stream systems to cut contamination. Institutional sites such as universities and hospitals maintain steady output of sorted office paper, though volumes trail commercial generators. Reverse-logistics of e-commerce returns is emerging as an additional feedstock avenue, with pilots that pre-sort packaging at return centers to segregate clean corrugated.
By Processing Technology: Non-de-inked Leadership with De-inking Innovation
Non-de-inked recycling commanded 59.32% of 2025 throughput thanks to its lower chemical load and simplicity when producing linerboard and medium. Mills emphasize energy-curtailment upgrades, installing shoe presses and high-efficiency drives to offset power-price inflation. The recovered paper market size linked to non-de-inked outputs remains stable as long as packaging demand leads aggregate fiber consumption.
De-inking lines are growing at 4.74% CAGR owing to stricter brightness specs in tissue and printing grades. Modern flotation-plus-washing modules remove stickies and micro-plastics more effectively, widening acceptable input mix. AI-driven process-control software adjusts chemical dosing in real time, lowering peroxide usage and aligning effluent with tighter discharge limits. Hybrid chemical-mechanical systems in pilot stage could soon process polycoat paper cups at scale, broadening the feedstock base for de-inked mills.
Geography Analysis
North America anchors technology deployment, with the United States hosting the largest cluster of mill modernization projects. Irving Pulp and Paper’s USD 810 million NextGen rebuild in New Brunswick adds advanced screening and closed-loop water treatment, reinforcing regional competitiveness. Stable collection programs and abundant warehouse space enable efficient bale aggregation, yet trucking shortages raise delivered-cost volatility. Canada leverages forestry expertise to supply bleached recycled pulp to tissue converters, whereas Mexico’s near-shoring surge lifts containerboard demand and stimulates OCC recovery infrastructure.
Europe combines rigorous regulation with high consumer participation in recycling schemes, underpinning one of the world’s highest recovery rates. Germany and the United Kingdom invest in AI-assisted MRFs that flag contaminants early and divert unsuitable material. Stora Enso’s 2025 reorganization channels capital toward fiber-based packaging and away from declining paper segments, illustrating a strategic pivot to higher-margin niches. National Green Deal funding further subsidizes sorting upgrades and effluent-treatment retrofits. Regions in Southern Europe push to close collection gaps by adding deposit-return schemes for paper beverage cartons.
Asia-Pacific remains the volume heavyweight, driven by China’s demand for containerboard used in export packaging. Import curbs pushed domestic mills to source fiber locally and to expand secondary processing hubs in Vietnam, Thailand and Malaysia. Q P Group’s plant near Ho Chi Minh City demonstrates regional momentum, capturing mixed paper once re-exported to China. Japan continues to pioneer de-inking efficiencies, while Australia’s state governments fund curbside upgrades to handle rising residential feedstock. Logistics costs across archipelagic nations and inland provinces remain a restraint, but digital freight platforms start to pool backhaul capacity, easing rate spikes.

Competitive Landscape
The recovered paper industry shows moderate fragmentation. Nine Dragons Paper, Smurfit WestRock, and International Paper are some of the major players, leveraging mill networks across multiple continents to balance fiber flows and customer contracts. The 2024 merger of Smurfit Kappa and WestRock created a global packaging leader that integrates box plants, MRFs and paper mills into one system, extracting haul-back synergies and securing a consistent OCC supply.
Strategic emphasis tilts toward yield gains rather than outright tonnage expansion. International Paper is retrofitting North American mills with optical sorters and automated bale-handling to lift throughput without major footprint additions. Nine Dragons ramps up chemical-recycling pilots aimed at polycoat structures, seeking a first-mover edge in tackling composite waste. Mid-tier operators concentrate on regionally advantaged niches, such as de-inked tissue furnish in Europe or high-strength fluting in Latin America.
Sustainability credentials now influence buyer preference. UPM’s procurement wins accelerated after the group secured an EcoVadis Platinum rating in 2024, proving how third-party verification can sway packaging tenders. Equally, capital-market access favors issuers with decarbonization roadmaps, evidenced by green bonds raised by Lee & Man and Cascades to fund water-reuse systems. Technology, capital strength and verified ESG performance therefore define the competitive pecking order more than pure size.
Recovered Paper Industry Leaders
Nine Dragons Paper (Holdings) Limited
Smurfit WestRock
International Paper Company
Stora Enso Oyj
S.A. Industrias Celulosa Aragonesa S.A. (SAICA)
- *Disclaimer: Major Players sorted in no particular order

Recent Industry Developments
- March 2025: Stora Enso completed organizational restructuring to focus on sustainable packaging solutions.
- February 2025: International Paper issued 2025 guidance that prioritizes recycling capability optimization.
- January 2025: Billerud announced investments in North American mills to expand recycled-content capacity.
- January 2025: Lee & Man Paper optimized Asian capacity for efficiency.


Global Recovered Paper Market Report Scope
The recovered paper is defined as the collection of papers used for recycling or used paper collected for recycling is termed 'recovered paper.' The waste paper or the recycled paper obtained from the end-use industries and by the consumers is utilizing as raw material for the generation of recovered paper. The same is used to manufacture products such as corrugated boxes, cartons, containerboard, and others.
| Old Corrugated Containers (OCC) |
| Mixed Paper (MWP) |
| Old Newsprint (ONP) |
| Sorted Office Paper (SOP) |
| Other Paper Grades |
| Packaging and Corrugated Boxes |
| Tissue and Sanitary |
| Printing and Writing |
| Newsprint and Publishing |
| Other End-use Industries |
| Residential |
| Commercial and Industrial |
| Institutional |
| Retail and E-commerce Returns |
| De-inking Lines |
| Non-de-inked Recycling |
| Advanced High-Consistency Pulping |
| Chemical-assisted Recycling |
| North America | United States | |
| Canada | ||
| Mexico | ||
| South America | Brazil | |
| Argentina | ||
| Chile | ||
| Rest of South America | ||
| Europe | United Kingdom | |
| Germany | ||
| France | ||
| Spain | ||
| Italy | ||
| Rest of Europe | ||
| Asia-Pacific | China | |
| India | ||
| Japan | ||
| Australia | ||
| South Korea | ||
| Vietnam | ||
| Rest of Asia-Pacific | ||
| Middle East and Africa | Middle East | Saudi Arabia |
| United Arab Emirates | ||
| Turkey | ||
| Rest of Middle East | ||
| Africa | South Africa | |
| Nigeria | ||
| Egypt | ||
| Rest of Africa | ||
| By Paper Grade | Old Corrugated Containers (OCC) | ||
| Mixed Paper (MWP) | |||
| Old Newsprint (ONP) | |||
| Sorted Office Paper (SOP) | |||
| Other Paper Grades | |||
| By End-use Industry | Packaging and Corrugated Boxes | ||
| Tissue and Sanitary | |||
| Printing and Writing | |||
| Newsprint and Publishing | |||
| Other End-use Industries | |||
| By Source of Collection | Residential | ||
| Commercial and Industrial | |||
| Institutional | |||
| Retail and E-commerce Returns | |||
| By Processing Technology | De-inking Lines | ||
| Non-de-inked Recycling | |||
| Advanced High-Consistency Pulping | |||
| Chemical-assisted Recycling | |||
| By Geography | North America | United States | |
| Canada | |||
| Mexico | |||
| South America | Brazil | ||
| Argentina | |||
| Chile | |||
| Rest of South America | |||
| Europe | United Kingdom | ||
| Germany | |||
| France | |||
| Spain | |||
| Italy | |||
| Rest of Europe | |||
| Asia-Pacific | China | ||
| India | |||
| Japan | |||
| Australia | |||
| South Korea | |||
| Vietnam | |||
| Rest of Asia-Pacific | |||
| Middle East and Africa | Middle East | Saudi Arabia | |
| United Arab Emirates | |||
| Turkey | |||
| Rest of Middle East | |||
| Africa | South Africa | ||
| Nigeria | |||
| Egypt | |||
| Rest of Africa | |||


Key Questions Answered in the Report
What is the current value of the recovered paper market?
The market reached USD 61.48 billion in 2026 and is projected to climb to USD 70.56 billion by 2031.
How fast is the segment for tissue and sanitary applications growing?
Tissue uses are registering the fastest end-use CAGR at 3.71% between 2026 and 2031.
Which paper grade holds the largest share in global recovery?
Old Corrugated Containers account for 42.14% of total recovered volume, reflecting robust e-commerce box flows.
Why are AI-powered sorters important for recycling economics?
They raise contamination-detection accuracy to 95%, improve mill yield and cut manual labor requirements, which lifts profitability.
How did China’s import restrictions affect market dynamics?
National Sword reduced export outlets, prompting new capacity in North America, Europe and Southeast Asia to process fiber domestically.
Page last updated on:


