
Market Overview
| Study Period | 2024 - 2031 |
|---|---|
| Forecast Data Period | 2026 - 2031 |
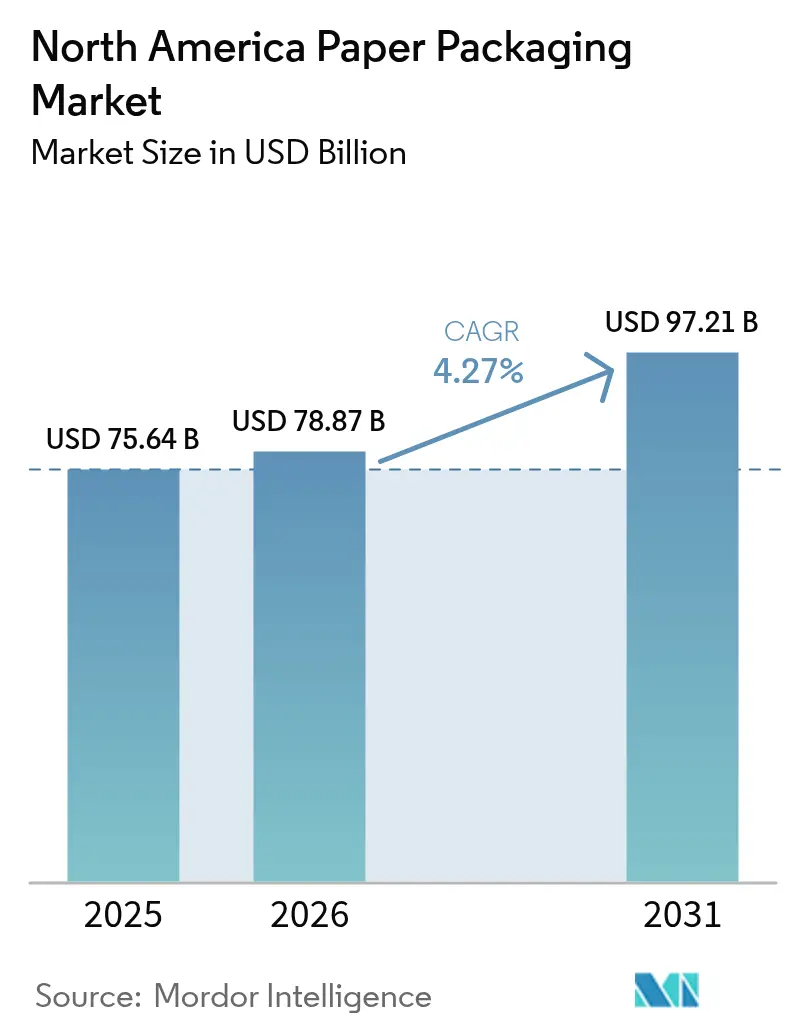
| Base Year Market Size (2025) | USD 75.64 Billion |
| Market Size (2026) | USD 78.87 Billion |
| Market Size (2031) | USD 97.21 Billion |
| Growth Rate (2026 - 2031) | 4.27 % |
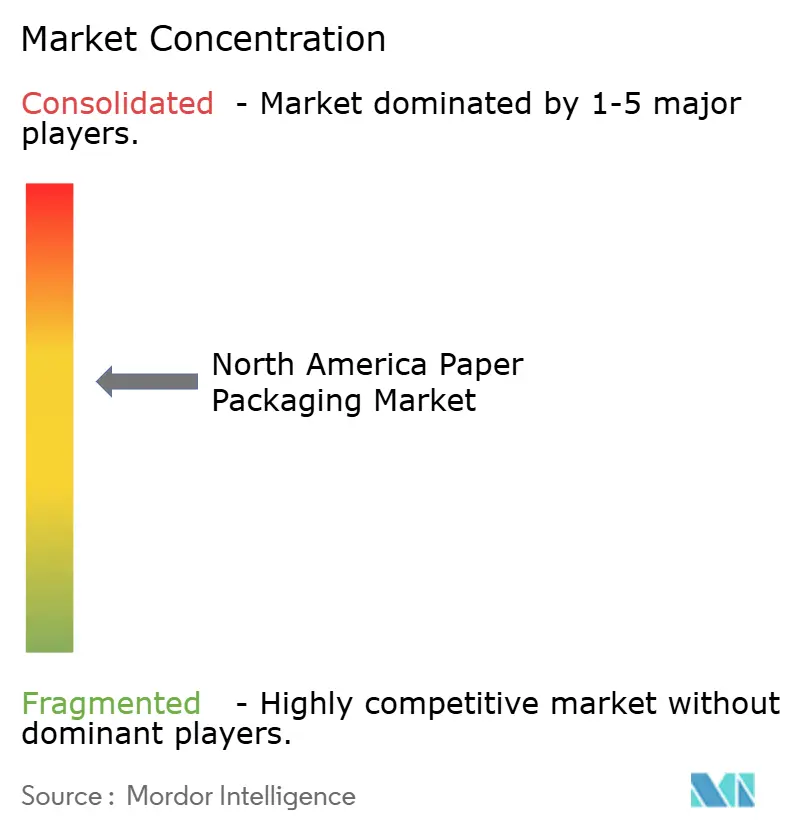
| Market Concentration | Medium |
Major Players *Disclaimer: Major Players sorted in no particular order Image © Mordor Intelligence. Reuse requires attribution under CC BY 4.0. | |
North America Paper Packaging Market Analysis by Mordor Intelligence
The North America paper packaging market size was valued at USD 75.64 billion in 2025 and estimated to grow from USD 78.87 billion in 2026 to reach USD 97.21 billion by 2031, at a CAGR of 4.27% during the forecast period (2026-2031). Rising e-commerce parcel volumes, sweeping bans on single-use plastics, and corporate sustainability mandates are the principal forces extending demand across every material and product class. Regulatory measures such as California’s SB 54 and Canada’s federal plastics prohibition, coupled with consumer willingness to pay premiums for eco-friendly packs, are accelerating the switch toward fiber-based solutions. Mega-mergers among global players have created the scale needed to meet surging volumes, yet they also heighten supply-chain sensitivities to fiber, energy, and transport shocks. Nearshoring of consumer-goods production into Mexico is further tilting demand toward localized corrugated capacity, while digital printing unlocks mass customization that bolsters brand engagement and price realization.
Key Report Takeaways
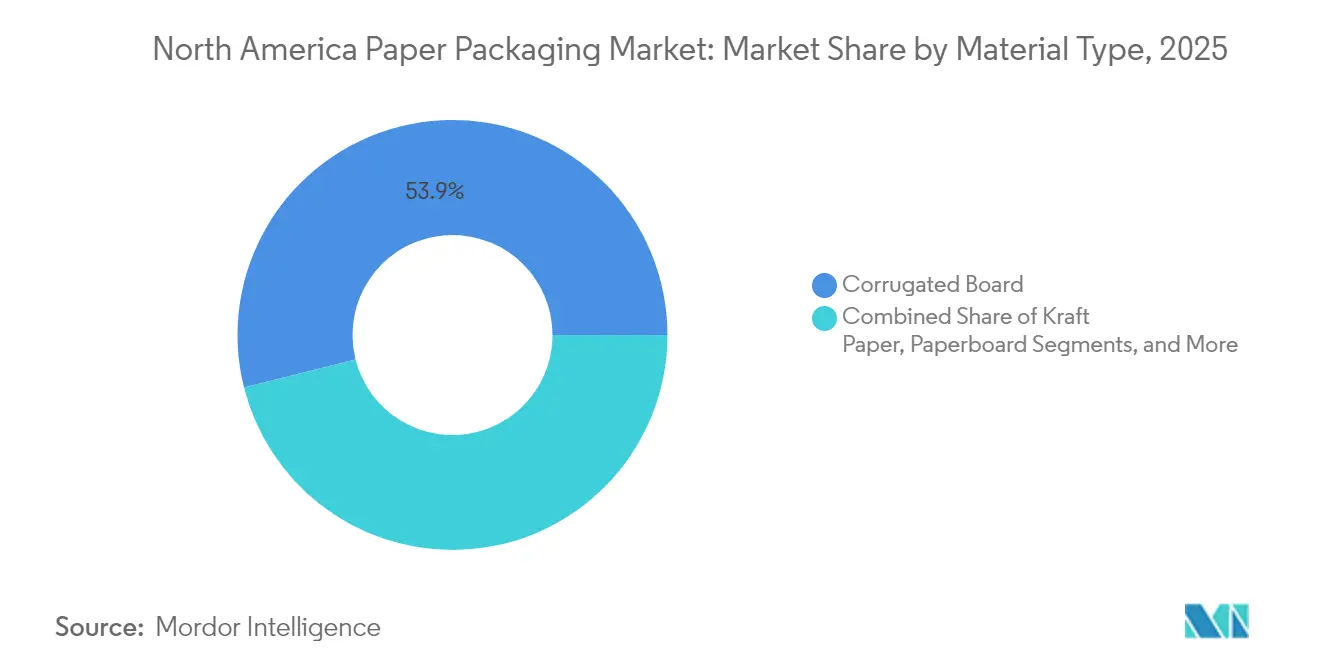
- By material type, corrugated board led with 53.92% revenue share in 2025, while paperboard is projected to expand at 6.07% CAGR through 2031.
- By product type, flexible paper packaging held 54.05% of the North America paper packaging market share in 2025, and the same segment is advancing at a 4.97% CAGR through 2031.
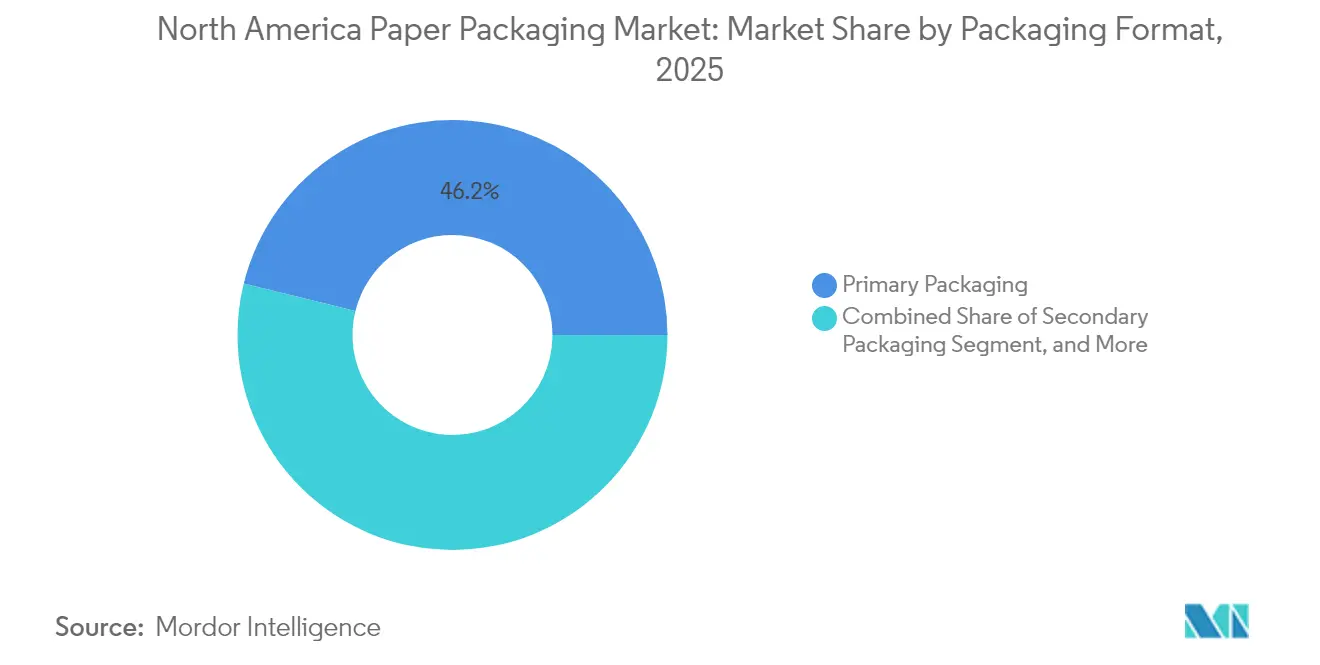
- By packaging format, primary packaging accounted for 46.15% share of the North America paper packaging market size in 2025, while secondary packaging is projected to grow at 4.91% CAGR to 2031.
- By end-use industry, food captured 32.10% revenue share in 2025, and personal care and cosmetics is forecast to grow at 6.55% CAGR through 2031.
- By geography, the United States dominated with 73.65% revenue share in 2025, whereas Mexico is set to register the fastest growth at 5.88% CAGR through 2031.
Note: Market size and forecast figures in this report are generated using Mordor Intelligence’s proprietary estimation framework, updated with the latest available data and insights as of 2026.
Market Trends and Insights
Drivers Impact Analysis of North America Paper Packaging Market*
| Driver | (~) % Impact on CAGR Forecast | Geographic Relevance | Impact Timeline |
|---|---|---|---|
| E-commerce boom elevates corrugated-box demand | +1.2% | United States and Canada, spillover to Mexico | Short term (≤ 2 years) |
| Regulatory shift from single-use plastics | +0.8% | North America-wide, strongest in California and Canada | Medium term (2-4 years) |
| Brand push for sustainable packaging | +0.6% | Global, premium uptake in U.S. urban markets | Long term (≥ 4 years) |
| Digital printing enables mass-customization | +0.4% | United States and Canada manufacturing hubs | Medium term (2-4 years) |
| Cold-chain meal-kit insulation needs | +0.3% | Urban centers across North America | Short term (≤ 2 years) |
| Scope-3 emissions accounting favors fiber | +0.5% | North America and EU, corporate-driven adoption | Long term (≥ 4 years) |
| Source: Mordor Intelligence | |||
E-commerce Boom Elevates Corrugated-Box Demand
Explosive online retail growth lifted corrugated-box shipments by 18% in 2024 and continues to reinforce the North America paper packaging market. Direct-to-consumer brands now demand right-sized, brandable boxes that protect products while showcasing eco-credentials.[1] International Paper, “International Paper Announces Fourth Quarter 2024 Results,” International Paper, internationalpaper.com International Paper’s e-commerce segment expanded 25% in Q4 2024, underscoring the scale of this tailwind. Digital presses allow high-graphics runs without lengthy setups, enabling seasonal or influencer-driven artwork at low cost. Fulfillment centers nearer to end consumers shorten delivery windows and concentrate demand around urban hubs, advantaging local sheet plants. Smart codes and NFC tags embedded on corrugated surfaces create data loops that improve inventory planning and enhance post-purchase engagement.
Regulatory Shift from Single-Use Plastics
California’s SB 54 requires a 65% reduction in single-use plastic packaging by 2032, and Canada’s nationwide ban has already removed common plastic items from shelves, redirecting volumes toward fiber solutions.[2]Environment and Climate Change Canada, “Canada Advances Fight Against Plastic Pollution,” Government of Canada, eccc.gc.ca Together with Extended Producer Responsibility laws in 12 U.S. states, these measures generate an additional USD 2.3 billion in captive demand by 2027 for the North America paper packaging market. Converters with barrier-coating expertise gain first-mover advantage as PFAS restrictions reshape food service formats. Governance certainty accelerates capital commitments in sustainable mills, giving scale players a head start over smaller rivals still reliant on legacy film laminates.
Brand Push for Sustainable Packaging
Fortune 500 firms allocated USD 4.7 billion to eco-pack transitions during 2024, reflecting surveys that show 73% of consumers reward green packaging choices. Brand owners use recyclable paperboard and molded fiber not only to meet targets but also to differentiate on shelf with tactile, natural aesthetics. Graphic Packaging recorded 40% growth in barrier-coated paperboard, proving that the North America paper packaging market converts sustainability priorities into premium price tiers. Lifecycle assessments favor renewable fiber over petrochemical substrates, and large retailers now evaluate suppliers on Scope-3 metrics, further embedding fiber in corporate strategies.
Digital Printing Enables Mass-Customization
HP Indigo and similar inkjet platforms cut make-ready waste by as much as 70%, allowing economical runs measured in dozens rather than tens of thousands. Small brands exploit this agility to align packaging artwork with social-media campaigns, boosting engagement by up to 20%. Food and beverage companies iterate seasonal flavors more often, while pharmaceuticals use variable data for anti-counterfeit features. Cost parity with flexography on short runs unlocks new opportunities for regional printers, enlarging the North America paper packaging industry’s addressable pool of micro-brands. Rapid iteration also reduces finished-goods inventory, a bonus when shelf-life is short.
Restraints Impact Analysis of North America Paper Packaging Market*
| Restraint | (~) % Impact on CAGR Forecast | Geographic Relevance | Impact Timeline |
|---|---|---|---|
| Fiber-supply volatility and deforestation risk | -0.7% | North America-wide, acute in Canada and U.S. South | Medium term (2-4 years) |
| Lightweight flexible-plastic competition | -0.5% | United States and Mexico, food packaging focus | Short term (≤ 2 years) |
| Energy-price shocks for recycled mills | -0.4% | Manufacturing regions across North America | Short term (≤ 2 years) |
| Railcar shortages bottleneck containerboard | -0.3% | United States and Canada, intermodal corridors | Medium term (2-4 years) |
| Source: Mordor Intelligence | |||
Fiber-Supply Volatility and Deforestation Risk
Pulp price swings of 22% in 2024 stemmed from wildfires in British Columbia and tighter harvest quotas aimed at biodiversity protection.[3]Natural Resources Canada, “Forest Sector Sustainability Report 2024,” Natural Resources Canada, nrcan.gc.ca Virgin supply dips force mills to rely more on OCC, yet recycling streams struggle to keep pace as e-commerce boxes circulate longer inside households. The North America paper packaging market thus absorbs higher raw-material costs that ripple into finished goods pricing. Certification schemes raise compliance expenses, while logistics disruptions-such as hurricanes hitting Southeast U.S. forests-compel converters to diversify sources across regions. Inventory buffers mitigate shocks but tie up capital in a margin-sensitive environment.
Lightweight Flexible-Plastic Competition
Monomaterial PE and PP films continue to win on weight efficiency in snacks and condiments, leveraging high barrier at minimal gauge. Brand owners chasing carbon savings sometimes overlook end-of-life trade-offs, extending flexible plastic’s tenure in certain aisles. Innovations in chemical recycling promise circularity claims that can blunt fiber’s momentum, especially where cost differentials widen. For the North America paper packaging market, head-to-head contests in shelf-stable foods remain challenging until paperboard achieves vapor and grease resistance without PFAS.
*Our forecasts treat driver/restraint impacts as directional, not additive. The impact forecasts reflect baseline growth, mix effects, and variable interactions.
North America Paper Packaging Market Segment Analysis
By Material Type:
Corrugated Board Dominance Faces Paperboard InnovationCorrugated board controlled 53.92% of the North America paper packaging market in 2025, cementing its position as the backbone of e-commerce fulfillment. Paperboard, while smaller, is slated for the fastest expansion at 6.07% CAGR as premium brands adopt high-graphics cartons that communicate sustainability and shelf appeal. The North America paper packaging market size attributable to paperboard formats is projected to widen noticeably through 2031. Barrier-coated grades, such as Billerud’s FibreForm, now match oxygen-transmission benchmarks formerly exclusive to plastic, opening entrée into fresh produce and chilled-food channels. Corrugated manufacturers leverage recycled-content mandates to market high-post-consumer liners, but fiber scarcity and OCC volatility put pressure on margins.
Lightweight micro-fluting, advanced starch adhesives, and AI-guided corrugators help box plants trim material weight without sacrificing stacking strength, translating into freight savings for brand owners. Paperboard converters bank on UV-ink systems and foil-free metallization to elevate tactile cues while keeping packs recyclable, broadening the North America paper packaging market appeal among cosmetics and nutraceuticals. Vertically integrated majors secure pulp at cost while independent carton makers strike sourcing alliances to buffer supply risk.



By Product Type:
Flexible Solutions Drive InnovationFlexible paper formats retained a 54.05% share of the North America paper packaging market in 2025, buoyed by quick-service wraps, stand-up pouches, and sachets that replace multilayer films. The segment’s 4.97% CAGR underscores its relevance as converters integrate heat-sealable coatings that rival PE’s seal strength. Rigid options like folding cartons and corrugated trays remain indispensable where on-shelf rigidity and impact resistance rule. However, demand bleeds toward flexibles when brands pursue material reduction and unboxing convenience.
Monomaterial barrier papers from Mondi let snack makers forego aluminum or EVOH, simplifying recycling streams and enhancing brand sustainability scores. Conversely, rigid producers innovate through precision die-cutting and nested designs that slash void ratios, reducing the North America paper packaging market size footprint per shipped item. Both product classes explore digital embellishment to unlock personalization at volume, but flexibles capture the lion’s share of seasonal SKUs thanks to minimal inventory risk.
By Packaging Format:
Primary Applications Lead Market EvolutionPrimary packs—direct contact cartons, wraps, and substrates-represented 46.15% of spend in 2025, reflecting rapid adoption in frozen entrées, dairy, and ready-to-eat meals. Secondary packaging, growing 4.91% annually, capitalizes on omnichannel retail that demands shelf-ready, brand-forward corrugated trays. The tertiary tier concentrates on stretch-wrap alternatives, pallet pads, and edge protectors that support warehouse safety and export specifications.
Functionality enhancements propel primary formats beyond containment into active roles that extend shelf life and signal freshness through printed time-temperature indicators. Secondary packs integrate QR codes to enable real-time inventory checks, benefiting retailers chasing labor efficiency. Box plant upgrades to high-speed die-cutters allow intricate apertures, elevating product visibility without adding plastics, thus reinforcing the North America paper packaging market's sustainability edge.
By End-Use Industry:
Food Sector Stability Meets Personal Care GrowthFood retained 32.10% of revenue in 2025 and remains the bedrock of the North America paper packaging market, owing to regulatory clampdowns on plastic serviceware. Innovation in fiber-based insulation now allows grocery delivery and meal-kits to shift fully from EPS coolers. On the upside, personal care and cosmetics clock the swiftest trajectory at 6.55% CAGR, as upscale brands migrate to molded-fiber inserts and embossed paperboard that resonate with eco-conscious shoppers.
Pharmaceutical demand hinges on child-resistant, tamper-evident designs-segments where paperboard competes once barrier coatings satisfy moisture ingress specs. Industrial applications lean on heavy-duty corrugated for chemical and automotive components, though metal-to-fiber conversions remain gradual. Cross-pollination of learnings-such as applying cosmetic embossing to chocolate boxes-broadens use-case horizons within the North America paper packaging industry.
Geography Analysis
United States Paper Packaging Market
U.S. converters, fortified by mergers such as the International Paper-DS Smith tie-up, own coast-to-coast mill and box-plant grids that shave freight miles and secure recycled fiber streams. Federal PFAS limits taking effect in 2025 eliminate plastic clamshells for ready meals, prompting retailers in New York and Illinois to trial molded-fiber trays. Urban consumers exhibit 15-20% higher willingness to pay for responsibly sourced packs, encouraging rollouts of luxury paperboard across e-grocery platforms.
Canada Paper Packaging Market
Canadian producers capitalize on abundant boreal fiber and carbon-neutral hydro power, a dual advantage that resonates with brands tallying Scope-3 metrics. However, rail labor actions and Pacific port congestion periodically delay containerboard eastward flow, compelling some converters to buffer stock. Cold-weather performance R&D remains a niche where Canadian labs pioneer moisture-resistant coatings suited to -20 °C logistics, reinforcing domestic leadership within the North America paper packaging market.
Mexico Paper Packaging Market
Mexico’s ascendancy rests on cost-competitive labor, energy, and new mill technology imported duty-free from Europe. Export-ready plants in Nuevo León secure long-term contracts with U.S. consumer staples firms seeking “Made in North America” labeling to de-risk Asian dependencies. The federal government’s tax incentives on recycling infrastructure shorten OCC loops, rising collection rates, and bolstering feedstock certainty. As domestic e-commerce penetration accelerates, local demand layers atop export flows to lift total tonnage well above historical baselines.
Regulatory Landscape
Regulation shaping paper packaging demand in North America is anchored by plastics-reduction policy and fast-expanding extended producer responsibility (EPR) frameworks. In the United States, packaging EPR is largely state-driven, with Maryland finalizing implementing regulations for its packaging and paper products producer responsibility program under COMAR 26.04.14 (adopted May 5, 2026 and effective May 25, 2026), including a producer registration deadline of July 1, 2026. In food-contact applications, paper and paperboard compliance remains tied to US FDA oversight under 21 CFR Part 176. The removal of authorization for multiple PFAS grease-proofing substances as of January 2025 is accelerating shifts toward alternative barrier technologies.
In Canada, federal reporting obligations complement provincial recycling programs through the Federal Plastics Registry (FPR) under CEPA. A notice published in the Canada Gazette, Part I on April 20, 2024, set reporting obligations across the 2024-2026 period for designated packaging categories, with reporting for the 2025 calendar year due by September 29, 2026. Together, these requirements raise the importance of auditable material data, recycled-content documentation, and supplier declarations across cross-border supply chains serving the United States, Canada, and Mexico.
Value Chain Analysis
The North America paper packaging value chain runs from fiber sourcing (virgin pulpwood and recovered fiber/OCC) and input procurement (energy, starches/adhesives, functional coatings, inks) through pulp and paper production (containerboard, kraft paper, and paperboard), and then downstream converting into corrugated boxes, folding cartons, bags, and flexible paper formats. Large integrated producers operate multi-mill networks that feed regional converting plants and distribution hubs, while independent converters rely more heavily on merchant containerboard and boxboard supply and third-party logistics. Industry bodies such as the Fibre Box Association, Paperboard Packaging Alliance, and Paperboard Packaging Council support standards alignment, technical guidance, and category rules that shape specification choices and recycled-content claims.
EPR implementation adds an administrative layer across the chain, requiring producers and brand owners to register, submit compliance plans, and manage fee payments and reporting via Producer Responsibility Organizations (PROs), including Circular Action Alliance in Maryland. On the supply side, mill operating decisions and logistics constraints remain material. Capacity reductions in 2025 tightened containerboard availability, and the mid-2026 round of packaging paper price increases announced across multiple producers underscores how finished-packaging pricing remains sensitive to mill economics, fiber availability, and transportation conditions.
Competitive Landscape
Post-merger, the five largest suppliers command roughly 45% of the North America paper packaging market, indicating moderate concentration. International Paper-DS Smith and Smurfit WestRock wield integrated forests, pulp, and converting assets that secure fiber and amplify bargaining leverage with big-box retailers. Graphic Packaging, Packaging Corporation of America, and Cascades anchor second-tier positions, each sharpening focus on sustainable barrier enhancements and digital print agility.
Strategy centers on vertical integration into recycling loops; Cascades’ 200,000-ton Quebec OCC expansion cements its circular-economy credentials. Digital capacity investments-USD 300 million by Graphic Packaging—equip converters to fulfill niche runs prized by DTC brands. Patent filings reveal intensifying work on PFAS-free grease barriers and bio-based adhesives, areas where smaller innovators like Billerud and Sealed Air–Ranpak partnerships punch above their weight.
White-space remains in cold-chain fiber insulation, pharmaceutical compliance packs, and disposable medical-device wraps. Start-ups offering molded-pulp blister cards challenge entrenched plastic in OTC drugs, spurring incumbents to accelerate R&D. Simultaneously, raw-material volatility and freight bottlenecks tilt competitive advantage toward those with diverse mill footprints and in-house logistics arms.
North America Paper Packaging Industry Leaders
International Paper Company
Smurfit WestRock
Packaging Corporation of America
Graphic Packaging Holding Company
Cascades Inc.
- *Disclaimer: Major Players sorted in no particular order
North America Paper Packaging Market Companies Covered in this Report
- International Paper Company
- Smurfit WestRock
- Packaging Corporation of America
- Graphic Packaging Holding Company
- Cascades Inc.
- Georgia-Pacific LLC
- Sonoco Products Company
- Amcor plc
- Mondi plc
- Clearwater Paper Corporation
- Sealed Air Corporation
- ProAmpac Holdings Inc.
- Pratt Industries Inc.
- Huhtamaki Oyj
- Pactiv Evergreen Inc.
- Reynolds Group Holdings Ltd.
- Kruger Packaging L.P.
- Stora Enso Oyj

Market Opportunities and Future Outlook
Barrier performance, recyclability compliance, and network optimization are creating concrete whitespace in North American paper packaging, especially where food-contact and on-the-go formats are moving away from PFAS-enabled grease barriers. The US FDA framework for food-contact substances under 21 CFR Part 176, along with the January 2025 removal of PFAS grease-proofing authorizations, is pushing converters toward PFAS-free coatings and redesigned structures. That shift supports paperboard and molded-fiber solutions in ready-meal, QSR, and takeout applications. At the same time, state-led EPR expansion is turning packaging data and material traceability into a differentiator, including Maryland’s COMAR 26.04.14 program, effective May 25, 2026, with producer registration due by July 1, 2026.
Investment and capacity actions also point to where suppliers are targeting growth and resilience. International Paper’s acquisition of North Pacific Paper (Norpac) adds a containerboard asset in Washington. Its USD 225 million greenfield corrugated packaging plant project in Mississippi expands converting footprint closer to major demand corridors. In paper bags for industrial and e-commerce applications, Mondi’s opening of a new paper bag manufacturing facility in Pittsburgh, with a targeted 300 million unit annual capacity, highlights the shift toward fiber-based mailers and sacks. In upstream paperboard, Sappi’s Project Elevate at the Somerset Mill adds significant SBS capacity, supporting premium cartons and brand-led sustainability conversions across food and personal care packaging.
Recent Industry Developments in North America Paper Packaging Market
- July 2026: Graphic Packaging Holding Company launched PaceSetter Ridgeline, an uncoated recycled paperboard product line produced at its Waco, Texas, paperboard mill. The introduction expands supply options for brands seeking recycled-content paperboard without coated-board aesthetics trade-offs, supporting broader fiber substitution in cartons and other paperboard formats.
- June 2026: International Paper completed its USD 360 million acquisition of North Pacific Paper Company (Norpac) in Longview, Washington, adding a large containerboard manufacturing asset to its footprint. The deal reinforces vertical integration into containerboard supply and supports regional network flexibility for corrugated producers and converters serving the Western United States.
- May 2026: International Paper broke ground (May 20, 2026) on a USD 225 million, 468,000-square-foot corrugated packaging facility in Rankin County, Mississippi. The greenfield build expands converting capacity nearer to high-throughput distribution corridors, aligning supply with e-commerce and consumer-goods demand centers while complementing ongoing network optimization.


North America Paper Packaging Market Report Scope and Research Methodology
Market Definition and Coverage
For this study, the market covers paper-based packaging sold in North America for protecting, transporting, and presenting goods, across packaging used in everyday consumer and industrial supply chains.
Scope exclusions: We exclude packaging made primarily from plastic, metal, and glass, and we also exclude non-packaging paper grades that are not intended to be converted into packaging.
Segments Covered in This Report
- By Material Type
- Kraft Paper
- Paperboard
- Corrugated Board
- Other Material Types
- By Product Type
- Flexible Paper Packaging
- Pouches and Bags
- Wraps and Films
- Other Flexible Paper Packaging
- Rigid Paper Packaging
- Folding Carton
- Corrugated Boxes
- Other Rigid Paper Packaging
- Flexible Paper Packaging
- By Packaging Format
- Primary Packaging
- Secondary Packaging
- Tertiary / Transit Packaging
- By End-Use Industry
- Food
- Beverage
- Healthcare and Pharmaceuticals
- Personal Care and Cosmetics
- Industrial and Electronic
- Other End-Use Industries
- By Country
- United States
- Canada
- Mexico
Data Sources, Market Sizing, and Validation
Desk Research
Desk research was used to set the factual backbone of the model, especially on production, trade, and end-market demand signals that influence paper packaging consumption in the United States, Canada, and Mexico. We relied on public data points such as the US Census Bureau, US International Trade Commission trade statistics, Statistics Canada, and Mexico national statistics releases, which helped anchor import, export, and manufacturing activity in consistent time series.
We also reviewed sources such as industry association publications (for packaging and paper), peer-reviewed journals on fiber-based packaging and recycling, and regulatory updates that affect material substitution and packaging choices. Company annual reports, investor presentations, and reputable business press were used to sanity check capacity changes, pricing commentary, and demand exposure by end use. Where needed, paid subscriptions for company financials and intelligence, shipment-level import and export records, and patent databases were referenced to fill gaps around converter activity, cross-border flows, and innovation intensity. These desk research sources are illustrative, and many additional public sources were also reviewed to collect, validate, and clarify inputs.
Primary Interviews and Surveys
Primary work focused on validating the demand drivers and pricing logic behind paper packaging across key end uses such as food and beverage, e-commerce shipping, and healthcare packaging. We spoke with a mix of packaging converters, paper and paperboard suppliers, distributors, and large buyers across the United States, Canada, and Mexico. This clarified utilization trends, grade mix shifts, and the timing of price resets that do not show up cleanly in public data.
Distribution of primary research fieldwork respondents
| Company type | Respondent position |
|---|---|
| Top tier: 33% | CXOs: 13% |
| Mid tier: 53% | Functional/Unit leaders: 36% |
| Smaller Players: 14% | Managers: 51% |
Market-Sizing & Forecasting
Sizing starts from a top-down build where production and trade data are used to reconstruct the addressable packaging paper and paperboard consumption pool in North America, and then it is translated into market value through average realized pricing. Once that structure was in place, the totals were cross-checked with selective bottom-up approximations, such as sampling converter revenues, reviewing channel checks, and applying observed price-per-ton ranges to implied volumes. Adjustments were made where the two views drifted.
A few inputs that materially shape the model include containerboard and cartonboard output trends, recycling and recovered fiber availability, import and export movements by paper- and paperboard-related codes, packaging demand tied to e-commerce shipment activity, and the mix shift between corrugated, folding cartons, and flexible paper formats. When forecasts were built, scenario analysis was used so growth could be flexed based on expected substitution away from certain plastics, capacity additions and closures, and expected pricing normalization after large cost swings. Where bottom-up data was incomplete for smaller converters, missing portions were handled using ratios derived from known capacity, regional shipment signals, and interview-based utilization assumptions.
Data Validation & Update Cycle
Outputs are validated through triangulation between the modeled market value, implied tonnage, and independent signals such as trade balances, mill operating rates, and major price announcements that move the realized average. When a variance looks unusual, the drivers are rechecked at the assumption level, followed by a second analyst review to confirm the correction is consistent with the definition and scope.
The report is refreshed annually, and interim updates are completed when material events occur, such as large capacity changes, sharp cost inflation, or sudden demand shifts from major end uses. Before delivery, a final pass is completed to ensure the latest public releases and primary feedback have been reflected in the model.
Mordor Intelligence's North America Paper Packaging Market Size Measured Against Other Published Estimates
Published market sizes for North America paper packaging can look far apart, even when the topic sounds similar at first glance. In most cases, the differences come from what is counted as paper packaging, how pricing is treated, which countries are included, and how the base year is set before the forecast starts.
By tracking production and trade linked volume signals and refreshing price and mix assumptions through primary checks, Mordor Intelligence keeps the estimate aligned to paper and paperboard packaging sold within the United States, Canada, and Mexico, rather than blending in broader packaging paper materials or adjacent non-packaging paper demand. Some sources also apply a single aggressive growth path across grades, or they use older currency timing and price points, which can lift the value materially when converted into USD.
Benchmark comparison
| Source | Market Size | Gaps in Research Methodology |
|---|---|---|
| Mordor Intelligence | USD 75.64 B (2025) | |
| Industry Publisher A | USD 73.03 B (2024) | Uses a paper packaging materials framing with a different base year, and the scope notes do not clearly separate converted packaging value from upstream material value, which can shift the total depending on pricing and conversion boundaries. |
| Consultancy B | USD 115.65 B (2023) | Starts from an earlier base year and appears to apply a broader definition that can pull in adjacent paper and paperboard demand beyond packaging conversion, thereby inflating value when compared with a packaging-only revenue boundary. |
The comparison shows that year choice and boundary setting explain most of the spread, followed by how average prices are carried forward during volatile periods. When scope is kept to packaging conversion and then checked against volume and price signals that can be independently reviewed, the resulting market size stays easier to replicate and to use for planning.


Key Questions Answered in the Report
What is the current value of the North America paper packaging market?
The market is valued at USD 78.87 billion in 2026 with a forecast to reach USD 97.21 billion by 2031.
How fast is paper packaging demand growing in Mexico?
Mexico is the fastest-growing country, expanding at a 5.88% CAGR through 2031.
Which material commands the largest share of packaging demand?
Corrugated board leads with 53.92% share, supported by e-commerce and industrial shipping needs.
What segment shows the highest growth among end-use industries?
Personal care and cosmetics packaging is advancing at a 6.55% CAGR due to premium brand sustainability goals.
How are mergers affecting supply dynamics?
Consolidations such as International Paper-DS Smith and Smurfit WestRock boost capacity but also intensify pricing power and supply-chain interdependence.
What is the main regulatory driver for fiber-based packaging adoption?
Comprehensive bans and reduction targets on single-use plastics across U.S. states and Canada are channeling demand toward recyclable paper solutions.
Page last updated on:





