
Market Overview
| Study Period | 2020 - 2031 |
|---|---|
| Market Size (2026) | USD 479.96 Billion |
| Market Size (2031) | USD 601.73 Billion |
| Growth Rate (2026 - 2031) | 4.62 % |
| Fastest Growing Market | Asia Pacific |
| Largest Market | Asia Pacific |
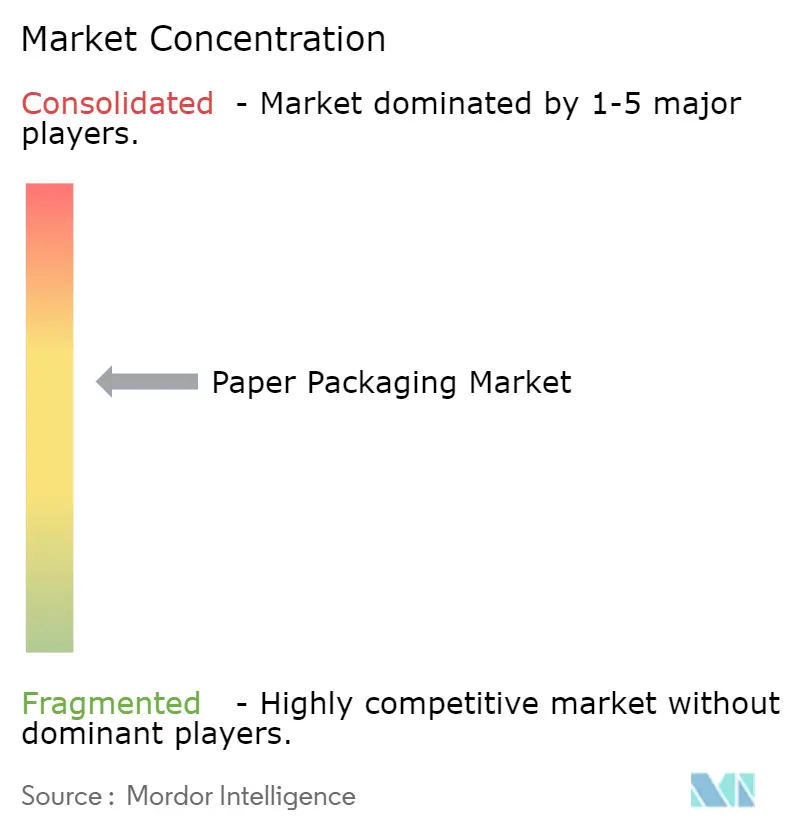
| Market Concentration | Medium |
Major Players *Disclaimer: Major Players sorted in no particular order Image © Mordor Intelligence. Reuse requires attribution under CC BY 4.0. | |
Paper Packaging Market Analysis by Mordor Intelligence
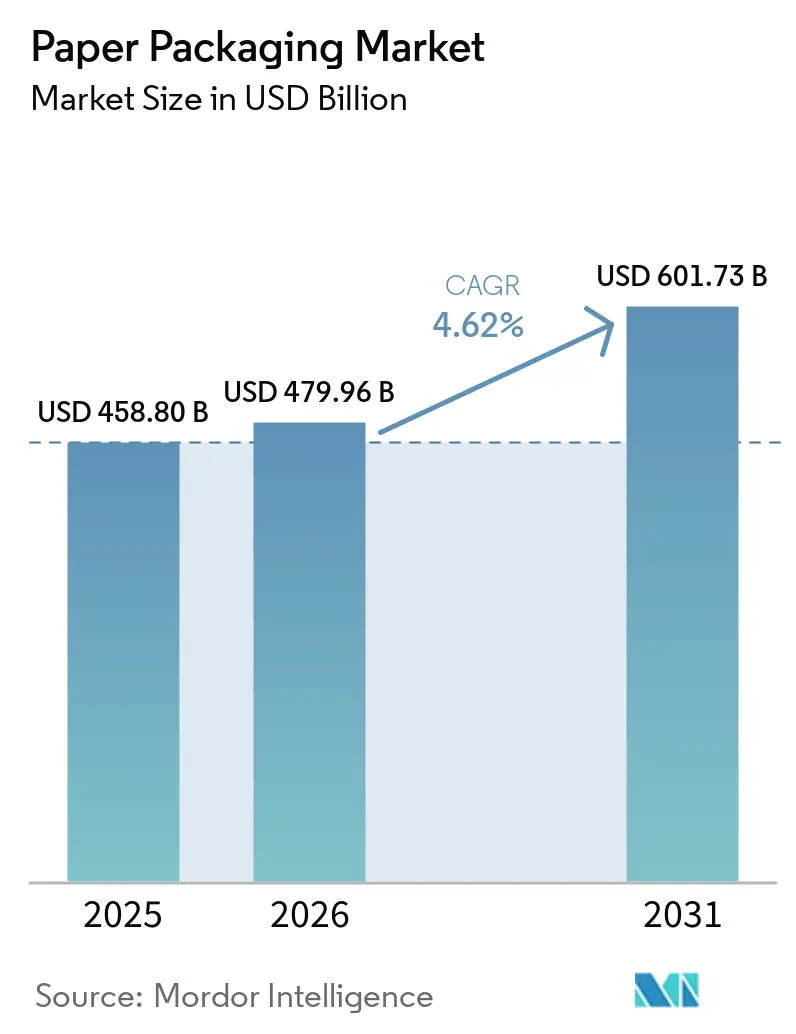
The paper packaging market size was valued at USD 458.8 billion in 2025 and estimated to grow from USD 479.96 billion in 2026 to reach USD 601.73 billion by 2031, at a CAGR of 4.62% during the forecast period (2026-2031). This expansion is propelled by environmental regulations that reward recyclable substrates, the continued rise of online retail, and rapid progress in bio-based barrier coatings that let paper compete with plastics on moisture and grease resistance. Producers benefit from Extended Producer Responsibility fee schedules that lower compliance costs for fiber-based materials relative to multilayer plastics. At the same time, investments in nano-cellulose technology promise PFAS-free performance that aligns with looming U.S. and EU chemical phase-outs. Supply-side flexibility, powered by digital printing and smaller batch economics, is enabling converters to serve short-run, highly customized campaigns at attractive margins, expanding addressable volume for the paper packaging market.
Key Report Takeaways
- By grade, containerboard captured 54.12% of the paper packaging market share in 2025.
- By product, the paper packaging market size for folding cartons is projected to grow at a 5.12% CAGR between 2026-2031.
- By end-user, food captured 39.64% of the paper packaging market share in 2025.
- By packaging format, the market size for molded fibre and pulp is projected to grow at a 6.62% CAGR between 2026-2031.
- By geography, the Asia-Pacific captured 47.62% of the paper packaging market share in 2025.
Note: Market size and forecast figures in this report are generated using Mordor Intelligence’s proprietary estimation framework, updated with the latest available data and insights as of 2026.
Market Trends and Insights
Drivers Impact Analysis of Paper Packaging Market*
| Driver | (~) % Impact on CAGR Forecast | Geographic Relevance | Impact Timeline |
|---|---|---|---|
| Development of barrier-coated paperboard solutions | +1.2% | Global; early adoption in North America and EU | Medium term (2-4 years) |
| Rise in e-commerce corrugated demand | +1.8% | Global; strongest in Asia-Pacific and North America | Short term (≤ 2 years) |
| Brand-owner shift toward mono-material packs | +0.9% | EU and North America, expanding to APAC | Medium term (2-4 years) |
| Extended Producer Responsibility mandates | +1.1% | EU, UK, select U.S. states, expanding globally | Long term (≥ 4 years) |
| Nano-cellulose barrier breakthroughs | +0.7% | North America and Nordic countries; pilot in Asia | Long term (≥ 4 years) |
| Converting-plant on-site digital printing economics | +0.6% | Global; premium applications in developed markets | Medium term (2-4 years) |
| Source: Mordor Intelligence | |||
Development of Barrier-Coated Paperboard Solutions Drive Premium Applications
Advanced water-, oxygen-, and grease-barrier coatings based on bio-polymers and nano-cellulose are elevating paper’s performance while preserving its recyclability. Laboratory trials show that cellulose nanofibril coatings can reduce oxygen transmission by more than 90% and double folding endurance compared with uncoated board.[1]“Blending of cellulose nanofibers with cotton linter pulp to enhance the mechanical and barrier properties of paper,” Nature, nature.com The U.S. Food & Drug Administration confirmed that grease-proofing agents containing PFAS have exited the food-contact market, shifting demand toward safer chemistries. In Europe, several converters are fast-tracking industrial runs of boric-acid-cross-linked poly(vinyl alcohol) coatings that deliver robust water vapor protection and meet compostability standards. As brand owners pursue plastic replacement without compromising shelf life, premium barrier-coated board is becoming the default for ready-to-eat foods, frozen meals, and personal-care gift packs, boosting value growth in the paper packaging market.
E-Commerce Corrugated Demand Surge Reshapes Production Priorities
Global online retail continues to outperform brick-and-mortar channels, and each parcel requires protective, stackable outer packaging that can withstand automated handling. Corrugated cases now account for an estimated 80% of e-commerce shipments, cementing their role as the workhorse for last-mile logistics. Asian mega-markets led by China and India added double-digit billions of parcels in 2024, prompting box-plant expansions and high-speed digital print lines dedicated to web-shop volumes. The production mix is shifting toward lightweight fluting profiles that cut freight costs yet retain compression strength, and integrated producers are prioritizing incremental containerboard tonnage over graphic paper grades to keep pace with e-commerce pull-through. This demand foundation underpins steady volume growth for the paper packaging market in both mature and emerging economies.
Brand-Owner Migration Toward Mono-Material Packaging Architectures
Consumer-product companies are redesigning packs to meet the EU Packaging and Packaging Waste Regulation target of universal recyclability by 2030. Eliminating multilayer laminates reduces separation complexity in material-recovery facilities and lowers EPR fees. Mono-material paper solutions now cover dry foods, household powders, and certain confectionery lines, using dispersion or polymer-based barriers that remain compatible with standard paper recycling loops. The design shift also simplifies communication of sustainability credentials on pack and supports carbon-footprint reporting. These dynamics channel incremental volumes toward the paper packaging market and reward converters that can certify fiber provenance and recyclability.
Extended Producer Responsibility Mandates Accelerate Market Transformation
The United Kingdom’s fee schedule, already live, charges brand owners higher rates for hard-to-recycle plastics than for readily recyclable fiber. February 2025 marks the synchronized launch of harmonized EPR across the EU, followed by a wave of U.S. state programs. Differential pricing immediately improves the total cost of ownership for recyclable paper formats, prompting pack-switch roadmaps in grocery, foodservice, and personal care. Converters are investing in material-identification printing and QR code tracking to document collection performance, while sensor enabled paper packaging can provide additional product and supply-chain data for next-generation EPR compliance. The result is an institutional tailwind that sustains the long-run CAGR of the paper packaging market.
Restraints Impact Analysis of Paper Packaging Market*
| Restraint | (~) % Impact on CAGR Forecast | Geographic Relevance | Impact Timeline |
|---|---|---|---|
| Deforestation and fibre-supply scrutiny | -0.8% | Global, particularly affecting U.S.–EU trade | Medium term (2-4 years) |
| Volatile recycled-fibre pricing | -1.1% | Global; acute impact in Europe and North America | Short term (≤ 2 years) |
| PFAS “forever-chemicals” phase-out costs | -0.6% | North America and EU, expanding to APAC | Medium term (2-4 years) |
| Limited recovery logistics in emerging markets | -0.9% | Asia-Pacific, Latin America, Africa | Long term (≥ 4 years) |
| Source: Mordor Intelligence | |||
Deforestation Scrutiny Challenges Traditional Supply-Chain Structures
The EU Deforestation Regulation obliges importers to demonstrate plot-level traceability for all wood-based inputs by the end of 2025. U.S. Kraft pulp, representing 60% of EU specialty-grade imports, must now carry geo-coordinates verified by third parties.[2]American Forest & Paper Association, “Why the EU Needs to Reconsider Their Deforestation Law,” afandpa.org Implementing satellite monitoring and chain-of-custody audits raises procurement costs and risks of shipment delays. Smaller mills lacking sophisticated data systems may cede share to vertically integrated majors with certified forests, altering competitive balances within the paper packaging market. Over time, tighter provenance rules could squeeze supply and curb the sector’s growth potential in markets that rely on imported fiber.
Volatile Recycled-Fiber Pricing Creates Margin Compression Pressures
Recovered-fiber indices in Europe swung more than USD 50 per ton between Q1 2024 and Q4 2024 as containerboard capacity additions outpaced collection growth. Converters chasing lightweight grades are particularly exposed to price spikes, while contracts indexed to virgin kraft pulp offer limited offset. Short-cycle cost inflation challenges pass-through to end users, eroding EBITDA margins for integrated players. Hedging strategies and inventory buffers mitigate volatility but tie up working capital. Persistent price swings could temper the otherwise steady trajectory of the paper packaging market unless collection rates improve and export restrictions on waste paper ease.
*Our forecasts treat driver/restraint impacts as directional, not additive. The impact forecasts reflect baseline growth, mix effects, and variable interactions.
Paper Packaging Market Segment Analysis
By Grade:
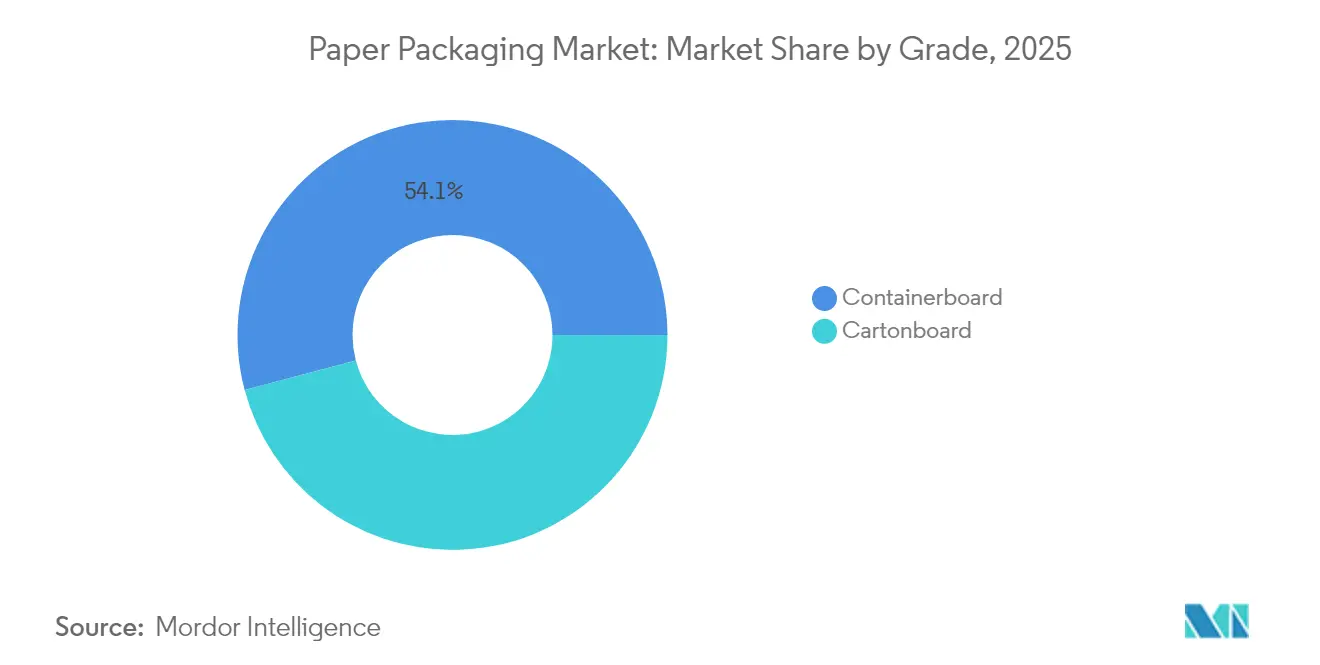
Cartonboard Innovation Accelerates Despite Containerboard DominanceContainerboard held a 54.12% paper packaging market share in 2025, supported by deep corrugated infrastructure and its central role in e-commerce shipping. Meanwhile, cartonboard is registering a 7.05% CAGR, the fastest among fiber grades. The paper packaging market size for cartonboard applications is projected to rise, reflecting premium penetration in food and personal-care sleeves. Converters are refitting idle graphic-paper machines with coating heads suited to Solid Bleached Sulfate and Folding Boxboard production, improving asset utilization. Folding Boxboard’s compatibility with high-definition digital print elevates shelf appeal, while dispersion-barrier upgrades enable chilled-food entry. At the same time, containerboard producers are investing in lightweight kraftliner to cut shipping mass, enhancing sustainability credentials. Virgin-recycled blends optimize strength-to-weight ratios and keep containerboard competitive, ensuring it remains the volume backbone of the paper packaging market.
Cartonboard’s growth profile attracts capital for rapid European and North American capacity expansions, with start-ups exceeding 1 million tons by 2026. Food-contact certification and pharmaceutical clean-room compliance boost value per ton, particularly for solid-bleached grades. Regulatory bans on black plastics in several EU countries redirect premium confectionery and cosmetic packs to white cartonboard formats, lifting demand further. Performance-enhancing additives such as nano-clays deliver moisture barriers without compromising recyclability, reducing reliance on plastic films. As retail brands demand mono-material packs that convey quality and sustainability, cartonboard emerges as the prime beneficiary within the paper packaging market.



By Product:
Folding Cartons Gain Momentum Through Digital Printing CapabilitiesCorrugated boxes occupied 61.48% of the paper packaging market in 2025 owing to their unmatched protective strength and versatility across shipping, industrial, and grocery channels. Folding cartons, however, are forecast to outpace overall growth, expanding at a 5.12% CAGR on the back of personalized graphics, quick-response seasonal campaigns, and smaller lot sizes. Digital printheads integrated into die-cutters reduce changeover times, paving the way for mass-customization without costly inventories. Premium beauty, nutraceuticals, and plant-based foods all favor folding cartons for their aesthetic flexibility and shelf-ready formats.
Corrugated producers respond with inside-print and high-color capabilities to keep hold of branding real estate, but folding cartons maintain an edge in tactile finishes and embossing. Consumer-electronics accessories increasingly shift from plastic clamshells to reinforced cartons married with molded-fiber inserts, capturing sustainability-minded shoppers. Novel tear-strip opening features borrowed from flexible pouches further boost convenience. These design and technology advances underpin steady share migration within the broader paper packaging market.
By End-User Industry:
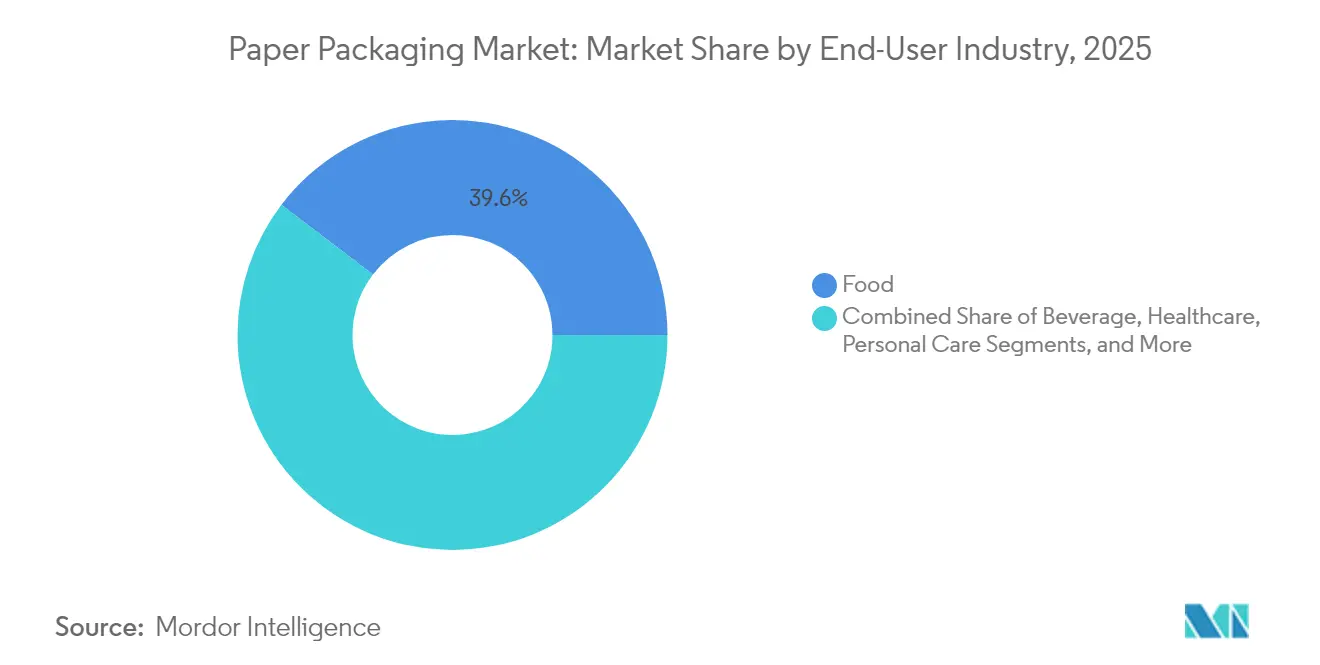
Personal Care Emerges as Premium Growth DriverFood applications provided 39.64% of paper packaging market revenue in 2025, spanning corrugated produce crates, cartonboard cereal boxes, and molded-fiber takeaway containers. Despite its maturity, the segment adds incremental volume thanks to PFAS-free grease barriers compliant with FDA guidance and single-use plastic bans in quick-service dining. The personal-care segment, while smaller, will post a 7.08% CAGR to 2031 as brands converge on sustainable, Instagram-worthy packs that align with clean-beauty messaging. Folding cartons with metallic foils swapped for recyclable dispersion coatings preserve luxury cues while meeting recycling guidelines.
E-commerce beauty subscription services demand robust yet elegant shippers, stimulating hybrid formats that pair lightweight corrugated outers with cartonboard inner trays. Meanwhile, the beverage, healthcare, and electronics sectors adopt molded-fiber bottle carriers, blister replacements, and cushioned trays, respectively, to meet corporate carbon budgets. This multi-industry uptake cements the growth runway for the paper packaging market.
By Packaging Format:
Molded Fiber Technologies Challenge Traditional HierarchiesRigid formats, chiefly corrugated cases and solid board, accounted for 45.71% of 2025 revenue, reflecting legacy dominance in shipping and bulk retail. Molded-fiber solutions, historically limited to egg cartons, are scaling rapidly with a forecast 6.62% CAGR as press-form tooling and dry-molded processes deliver crisp geometry and smooth surfaces. Rapid-cycle hot-press lines slash water usage by up to 70% compared with conventional slurry methods, and in-mold barrier sprays confer splash resistance suitable for quick-service beverage lids.
Semi-rigid folding cartons continue to exploit digital upgrades and barrier lamination for frozen-food and ready-meal categories, whereas flexible paper wraps fill niche needs for sugar sachets and instant soup pouches. With regulators tightening compostability and plastic-tax thresholds, molded fiber stands to capture incremental share, aided by lignin-reinforced formulations that elevate wet tensile strength. Together, these format innovations expand the addressable universe for the paper packaging market.
Geography Analysis
APAC Paper Packaging Market
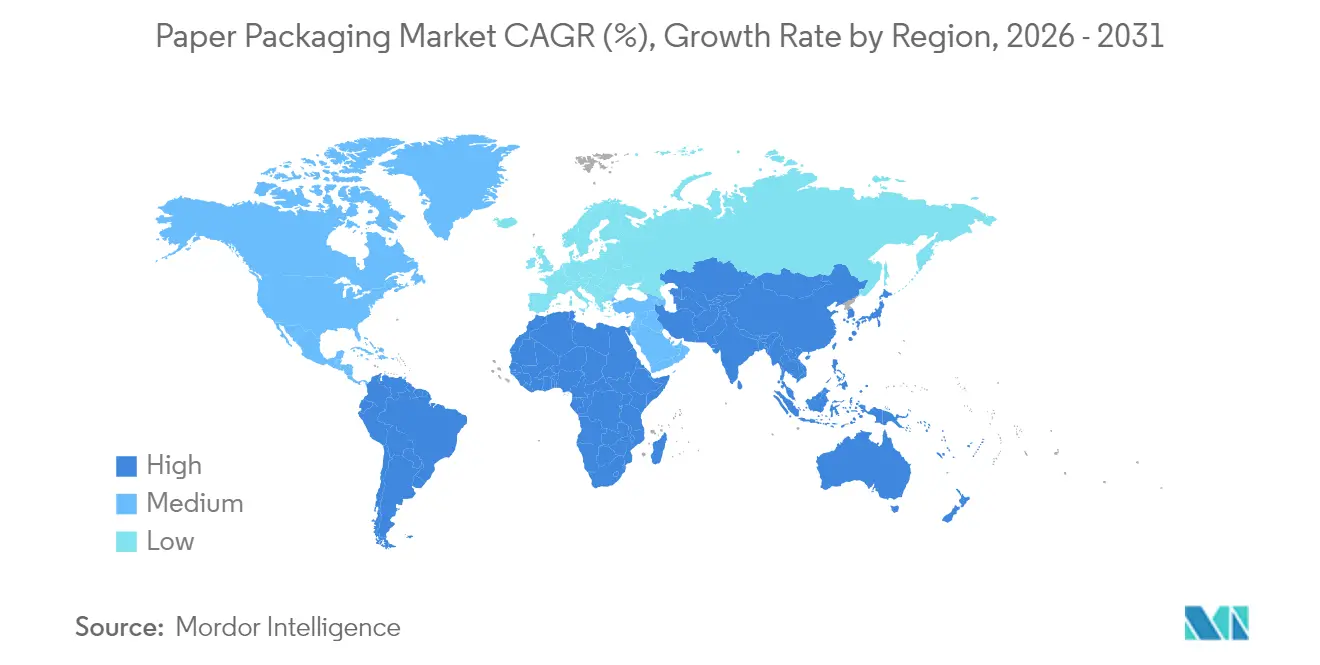
Asia-Pacific led the paper packaging market with a 47.62% revenue share in 2025 and is projected to record a 5.51% CAGR to 2031. Rapid urbanization, expanding middle-class purchasing power, and large-scale food-delivery ecosystems underpin fiber demand in South and Southeast Asia. Regional players leverage cost-efficient integrated mills that pair plantation forests with in-house converting, shortening lead times for export-oriented customers. Local governments incentivize sustainable-pack investments through duty rebates on energy-efficient machinery, further accelerating capacity additions.
North America and Europe Paper Packaging Market
North America remains an innovation nucleus, driving digital-print adoption and spearheading nano-cellulose pilot commercialization. Tightening landfill legislation in several states spurs demand for curbside-recyclable packs, bolstering domestic containerboard offtake. The United States also benefits from abundant softwood resources, ensuring steady virgin-fiber availability to blend with imported OCC. Meanwhile, Europe’s stringent recyclability targets and EPR rollouts create a predictable policy environment that favors continuous equipment upgrades. German and Scandinavian mills transition from fossil to biomass boilers, reducing Scope 1 emissions and sharpening cost competitiveness despite high energy prices.
LATAM and MEA Paper Packaging Market
Latin America and the Middle East and Africa collectively hold modest shares today, yet both regions register above-global average growth. Brazilian pulp producers integrate downstream into cartonboard to mitigate commodity cycles, while Gulf Cooperation Council economies add corrugated capacity to serve expanding e-commerce hubs. Africa’s underdeveloped collection network hinders recycled-fiber supply, but international development programs are funding pilot materials-recovery facilities, laying groundwork for future circularity. Collectively, these regional trajectories reinforce the diversified demand base that supports the long-term resilience of the paper packaging market.

Regulatory Landscape
Regulation is increasingly shaping material choice and product design in paper packaging, with the EU Packaging and Packaging Waste Regulation (PPWR), Regulation (EU) 2025/40, serving as a central anchor. PPWR entered into force on 11 February 2025 and applies from 12 August 2026. It introduces lifecycle requirements that push pack redesign toward recyclability, minimization, and harmonized consumer communication. Under PPWR, all packaging placed on the EU market must be recyclable by January 2030, and the Commission is tasked with establishing harmonized labels by 12 August 2026. This elevates the importance of standardized recyclability claims and sorting-aligned pack identification.
Food-contact compliance is also tightening for paper-based substrates. In April 2026, the U.S. Food and Drug Administration updated 21 CFR 176.170, tightening specific migration limits for certain bisphenol alternatives (BPS and BPF) in coated food-contact paper to 0.05 mg/kg. The effective date is July 2026, alongside added reliance on ISO/IEC 17025-accredited laboratory testing for imported coated paper-based food packaging batches. This raises documentation and testing requirements for converters and importers supplying grease-resistant and coated paper formats into the U.S. market.
Value Chain Analysis
The paper packaging value chain runs from upstream fiber procurement (virgin wood fiber and recovered paper) and pulp manufacturing to paper and paperboard production (containerboard and cartonboard), and then downstream converting into corrugated boxes, folding cartons, flexible paper wraps, and molded fiber. Distribution follows to brand owners, e-commerce shippers, retailers, and foodservice operators. Collection and sorting of recovered fiber, along with recycled-fiber price volatility, remain key sensitivity points for both integrated and non-integrated players, while performance additives and barrier chemistries increasingly influence specification setting for food and personal-care packs.
Vertical integration and grade diversification show up in recent capacity and portfolio moves across the chain. International Paper completed the USD 360 million acquisition of North Pacific Paper Company (NORPAC) in June 2026, strengthening supply of lightweight, high-performance packaging grades and improving service coverage on the U.S. West Coast. On the converting and adjacent-grade side, Graphic Packaging International launched PaceSetter Ridgeline in July 2026 as its entry into uncoated recycled paperboard (URB), produced at its Waco, Texas, facility, expanding options for recycled-content folding-carton style applications. In equipment and new-capacity planning, ANDRITZ received an April 2026 contract from General Emballage to supply a PrimeLine paper production line for a greenfield mill in Algeria designed for 350,000 tons per year of testliner and fluting, underscoring continued investment in containerboard-linked inputs and regionalized supply.
Competitive Landscape
The sector exhibits moderate concentration, with the top five companies controlling roughly 45% of global revenue. The newly formed Smurfit WestRock immediately became the largest integrated player, operating more than 500 converting sites worldwide and focusing on containerboard synergies.[3]Smurfit WestRock, “Merger Completion Announcement,” smurfitwestrock.com International Paper, Mondi, and Graphic Packaging extend vertical control from certified forests through high-graphic folding cartons, while investing heavily in barrier science and digital workflows. Geographic diversification shields majors from regional demand shocks, yet exposes them to varying regulatory regimes and fiber-price volatility.
Strategic maneuvers center on portfolio re-mix: International Paper’s agreed divestiture of several European plants cleared antitrust hurdles and unlocked USD 1.1 billion for North American corrugated upgrades. Suzano’s 2024 acquisition of two U.S. mills marked a downstream push that secures offtake for its Brazilian hardwood pulp. On the technology front, Mondi’s Austrian facility commissioned a pilot nano-cellulose coater capable of 220 m/min, targeting snack-food liners that conform to EU PFAS restrictions. Graphic Packaging’s Better, Every Day roadmap commits to net-zero greenhouse-gas emissions by 2050, aligning capital allocation with decarbonization.
Mid-tier independents differentiate through specialty niches such as grease-resistant wraps or molded-fiber wine shippers. Licensing deals with university spin-offs accelerate the commercialization of lignin-enhanced boards, while joint ventures with chemical suppliers secure access to compostable barrier polymers. Competitive intensity remains high in mature regions, but disciplined capital expenditure and disciplined price-setting maintain rational margins, sustaining investor confidence in the paper packaging market.
Paper Packaging Industry Leaders
International Paper Company
Smurfit Westrock plc
Mondi plc
Packaging Corporation of America
Stora Enso Oyj
- *Disclaimer: Major Players sorted in no particular order
Paper Packaging Market Companies Covered in this Report
- International Paper Company
- Smurfit Westrock plc
- Mondi plc
- Packaging Corporation of America
- Stora Enso Oyj
- Graphic Packaging International, LLC
- Nippon Paper Industries Co. Ltd.
- Sonoco Products Company
- Oji Holdings Corporation
- Georgia-Pacific LLC
- Nine Dragons Paper Holdings
- Lee & Man Paper Manufacturing
- Sappi Limited
- Ilim Group
- Klabin S.A.
- Asia Pulp & Paper (APP)

Market Opportunities and Future Outlook
Regulatory-driven redesign and compliance work are creating whitespace for paper solutions that can replace hard-to-recycle plastic laminates while staying compatible with mainstream recycling. The EU PPWR, Regulation (EU) 2025/40, applies from 12 August 2026 and sets deadlines around harmonized labeling (by 12 August 2026) and recyclability (by January 2030). It pushes brand owners and converters toward mono-material fiber architectures, verified recycled-fiber content claims, and clearer pack identification for sorting. At the same time, tighter U.S. food-contact migration limits for certain coating chemistries under the FDA update to 21 CFR 176.170 (effective July 2026) are accelerating adoption of alternative barrier and grease-resistant systems. This supports differentiation for converters that can provide accredited test documentation and compliant coating stacks.
Recent investment programs show where near-term capacity and product capability are being built. Mondi opened a new paper bag plant in Pittsburgh, Pennsylvania, in April 2026 with annual capacity of 300 million units for e-commerce and industrial uses, indicating continued substitution of plastic shipping and industrial sacks with paper-based formats. International Paper broke ground in May 2026 on a USD 225 million corrugated packaging facility in Rankin County, Mississippi, expanding North American box-system capacity. SCGP also announced an expansion investment in May 2026 for corrugated container production in Ho Chi Minh City, Vietnam, strengthening integrated supply in Asia-Pacific demand centers. In emerging and import-reliant markets, the April 2026 ANDRITZ order for General Emballage’s Algeria greenfield testliner and fluting line reflects an opportunity around localizing containerboard supply to reduce exposure to logistics costs and fiber trade friction.
Recent Industry Developments in Paper Packaging Market
- July 2026: Smurfit WestRock confirmed the closure of its SSK paper mill in Birmingham, United Kingdom, effective July 27, 2026. The company cited manufacturing footprint optimization in Europe and a shift away from higher-cost assets as major groups prioritize efficiency and grade mix for packaging markets.
- June 2026: International Paper completed its USD 360 million acquisition of North Pacific Paper Company (NORPAC). The transaction expands International Paper’s packaging-grade capability base and strengthens its West Coast supply position for lightweight, performance-driven paper packaging applications.
- July 2025: Packaging Corporation of America announced a definitive agreement to acquire Greif, Inc.’s containerboard business for USD 1.8 billion. The deal deepens vertical integration across containerboard and converting, tightening supply coordination and reinforcing scale advantages in corrugated packaging.


Paper Packaging Market Report Scope and Research Methodology
Market Definition and Coverage
For this study, the paper packaging market covers packaging products primarily made from paper or paperboard that are sold for protecting, transporting, and presenting goods across end uses like food, beverage, healthcare, and consumer goods.
Scope exclusions: We exclude plastic-only, metal, and glass packaging formats, plus upstream forestry and commodity pulp outputs that are not sold as packaging products.
Segments Covered in This Report
- By Grade
- Cartonboard
- Solid Bleached Sulphate (SBS)
- Solid Unbleached Sulphate (SUS)
- Folding Boxboard (FBB)
- Coated Recycled Board (CRB)
- Uncoated Recycled Board (URB)
- Other Cartonboard Grades
- Containerboard
- White-top Kraftliner
- Other Kraftliners
- White-top Testliner
- Other Testliners
- Semi-chemical Fluting
- Recycled Fluting
- Cartonboard
- By Product
- Folding Cartons
- Corrugated Boxes
- Other Products
- By End-User Industry
- Food
- Beverage
- Healthcare
- Personal Care
- Household Care
- Electrical and Electronics
- Other End-User Industries
- By Packaging Format
- Rigid (Corrugated, Solid Board)
- Semi-rigid (Folding Cartons)
- Flexible Paper (Sachets, Wraps)
- Molded Fibre and Pulp
- By Geography
- North America
- United States
- Canada
- Mexico
- South America
- Brazil
- Argentina
- Rest of South America
- Europe
- United Kingdom
- Germany
- France
- Italy
- Spain
- Russia
- Rest of Europe
- Asia Pacific
- China
- Japan
- India
- South Korea
- Australia
- Rest of Asia Pacific
- Middle East and Africa
- Middle East
- United Arab Emirates
- Saudi Arabia
- Turkey
- Rest of Middle East
- Africa
- South Africa
- Nigeria
- Rest of Africa
- Middle East
- North America
Data Sources, Market Sizing, and Validation
Desk Research
Desk research started with public statistics and standards that help explain how much paper and paperboard is produced, traded, and consumed for packaging uses. Sources typically include FAOSTAT for fiber and paper supply context, UN Comtrade for trade flows by paper and paperboard HS codes, and OECD or World Bank indicators to link packaging demand with industrial and consumer activity.
We also reviewed packaging and recycling references from bodies such as the US EPA and the European Commission to understand collection rates, recycled fiber availability, and policy signals that can change mix and pricing. Company filings, investor presentations, association websites, and reputable press were used to validate capacity announcements, mill conversions, and regional demand themes. Where needed, we used paid subscriptions for company financials and patent databases, and an import-export shipment-level database for directional checks on packaging-grade paper movements. The sources listed here are illustrative, and many other public references were used for cross-checks and clarification during the work.
Primary Interviews and Surveys
Primary work was used to confirm how demand is split across packaging formats, end uses, and regions, and to test price and mix assumptions that desk research cannot fully show. We spoke with participants across the value chain, including packaging converters, paperboard and containerboard suppliers, distributors, and large packaging buyers, then we rechecked inputs when responses showed large differences by geography or grade.
Distribution of primary research fieldwork respondents
| Company type | Respondent position | Region |
|---|---|---|
| Top tier: 35% | CXOs: 16% | APAC: 44% |
| Mid tier: 49% | Functional/Unit leaders: 33% | EMEA: 30% |
| Smaller Players: 16% | Managers: 51% | Americas: 26% |
Market-Sizing & Forecasting
The model begins with a top-down build where packaging-grade paper and paperboard demand is reconstructed using production and trade signals, then allocated into packaging use based on conversion patterns and end-market intensity. To keep the totals realistic, we also ran selective bottom-up approximations in parallel, such as sampled converter revenue checks, regional price-per-ton ranges, and volume sanity checks tied to corrugated box and carton demand.
Key inputs used in the model include containerboard and cartonboard production trends, import and export movements of packaging grades, recycled fiber recovery rates, e-commerce shipment intensity as a demand multiplier for corrugated, and price movement by grade (adjusted for mix shifts). We also tracked substitution signals like plastic reduction policies and adoption of barrier papers, since these can move volumes into higher-value paper packaging formats.
Forecasting relied mainly on scenario analysis supported by a simple multivariate structure, where regional GDP and industrial output trends are paired with packaging intensity indicators and recycled fiber availability. When bottom-up checks were not available for a smaller geography or niche format, gaps were handled through peer-region benchmarking and conservative price bands, followed by revalidation in interviews.
Data Validation & Update Cycle
Outputs were triangulated across several checks, including comparing implied per-capita packaging consumption, trade balance logic, and grade-level price realism versus what was heard in interviews. Large variances were flagged, reviewed, and corrected through stepwise analyst checks, with assumptions revisited when a region showed mismatched growth versus capacity additions or policy shifts.
The report is refreshed annually, with interim updates when material events occur, such as major mill conversions, sudden input cost changes, or new packaging regulations. Before delivery, a final review pass is completed so clients receive the latest view available at the time of publishing.
Mordor Intelligence's Paper Packaging Market Size Compared With Other Published Estimates
Published paper packaging market sizes can vary because groups draw the market boundary differently and apply different price and mix assumptions across grades and regions. Even small choices, such as whether molded fiber is included or how recycled content changes average selling prices, can shift a global number by tens of billions.
The table shows a spread around the 2025 market size. In Mordor Intelligence's model, the count is restricted to paper-based packaging formats, with grades and end-use demand tied back to production, trade, and conversion signals rather than broad materials packaging totals. Differences also show up when others assume faster price expansion, use a different currency timing, or do not re-check regional splits with converter and buyer feedback before finalizing the value.
Benchmark comparison
| Source | Market Size | Gaps in Research Methodology |
|---|---|---|
| Mordor Intelligence | USD 458.80 B (2025) | |
| Global Consultancy A | USD 416.07 B (2025) | This estimate appears to use a narrower included-scope or more conservative price basis for paper packaging, which can pull down the value when grade mix and regional price bands are not adjusted as tightly to packaging-grade conversion. |
| Industry Publisher B | USD 434.30 B (2025) | The lower figure is consistent with differences in which paper packaging formats are counted and how barrier and functional papers are treated, and it may also reflect a different assumed mix shift between corrugated, cartons, and flexible paper. |
Across the three figures, the main takeaway is that scope choices and grade-level pricing logic drive most of the gap, followed by how regions are weighted and refreshed. By keeping the steps traceable to production, trade, recovery, and conversion indicators, the sizing stays repeatable and easier to explain when clients want to map it to their own demand view.


Key Questions Answered in the Report
How large is the global paper packaging market in 2026?
The paper packaging market size is valued at USD 479.96 billion in 2026.
What CAGR is projected for paper-based packs between 2026 and 2031?
The market is forecast to expand at a 4.62% CAGR through 2031.
Which region contributes the highest revenue?
Asia-Pacific delivers 47.62% of global sales and is also the fastest-growing region.
Which product category is gaining the most momentum?
Folding cartons are advancing at a 5.12% CAGR due to digital printing and premium branding demands.
Why are barrier-coated boards important?
Next-generation coatings replace PFAS, offer superior moisture and oxygen resistance, and keep packs fully recyclable, satisfying brand and regulatory expectations.
How are Extended Producer Responsibility fees influencing material choice?
EPR schemes charge lower rates for recyclable fiber than for difficult-to-recycle plastics, tilting economic advantage toward paper packaging.
Page last updated on:


 Your data is secure and never sold or shared.


