
Facial Care Market Size and Share
Market Overview
| Study Period | 2020 - 2031 |
|---|---|
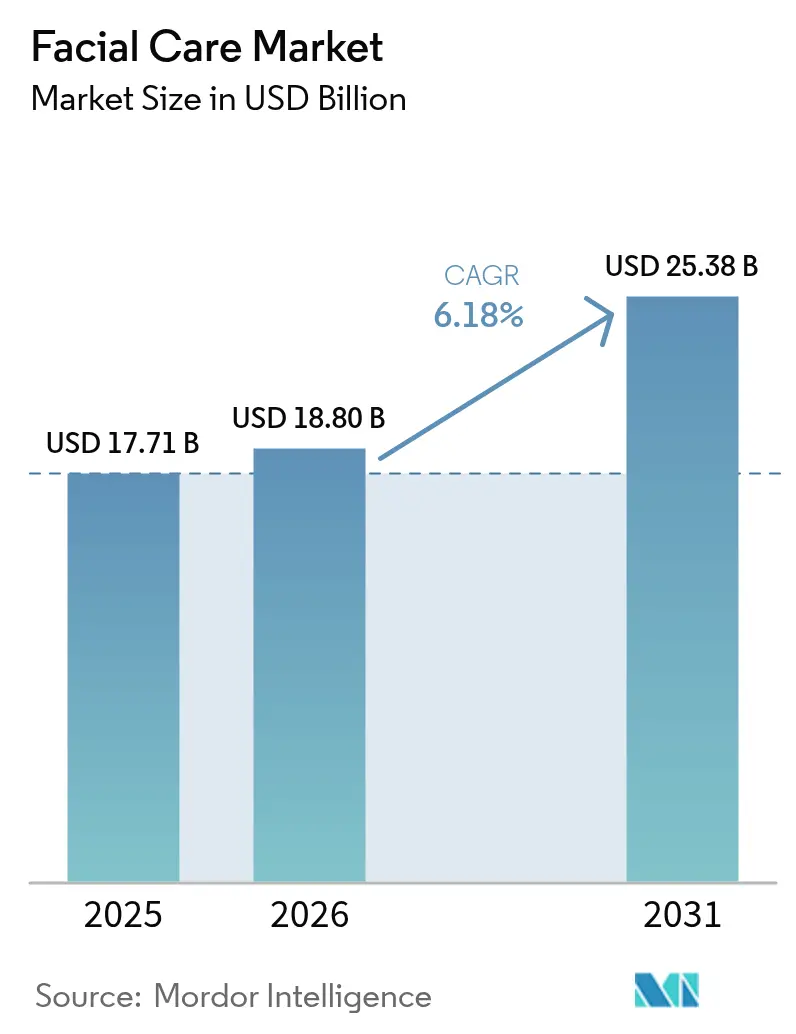
| Market Size (2026) | USD 18.8 Billion |
| Market Size (2031) | USD 25.38 Billion |
| Growth Rate (2026 - 2031) | 6.18 % |
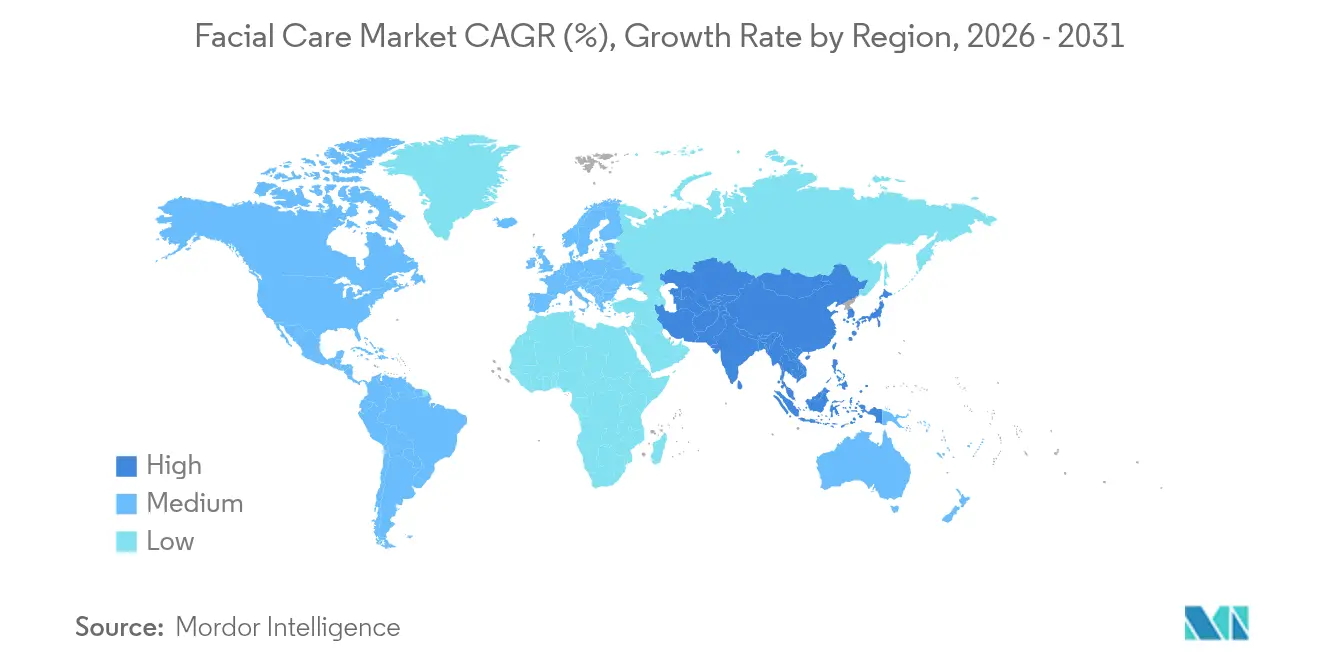
| Fastest Growing Market | Asia Pacific |
| Largest Market | North America |
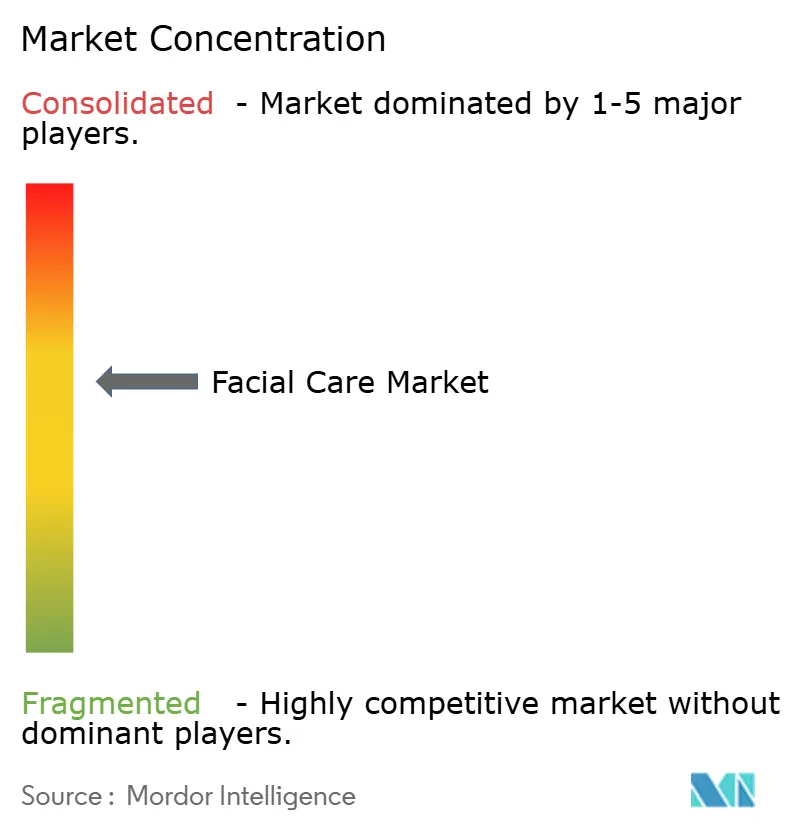
| Market Concentration | Medium |
Major Players *Disclaimer: Major Players sorted in no particular order Image © Mordor Intelligence. Reuse requires attribution under CC BY 4.0. | |
Facial Care Market Analysis by Mordor Intelligence
The Facial Care market size is expected to grow from USD 17.71 billion in 2025 to USD 18.8 billion in 2026 and is forecast to reach USD 25.38 billion by 2031 at 6.18% CAGR over 2026-2031. Rising demand for preventive aesthetics, the popularity of “lunchtime” procedures, and AI-powered skin-diagnostic tools underpin this trajectory, especially in large urban centers. Social media accelerates product discovery and peer-to-peer referrals, encouraging younger consumers to start early with minimally invasive treatments. Consolidation among device makers and injectable suppliers is producing broad technology portfolios that let clinics tailor therapies to varied skin concerns. At the same time, male participation, subscription service models, and advances in regenerative injectables enlarge the addressable base, cushioning revenue streams against seasonality.
Key Report Takeaways
- By geography, North America led with 35.88% facial care market share in 2025, while Asia-Pacific is projected to grow at an 8.08% CAGR to 2031.
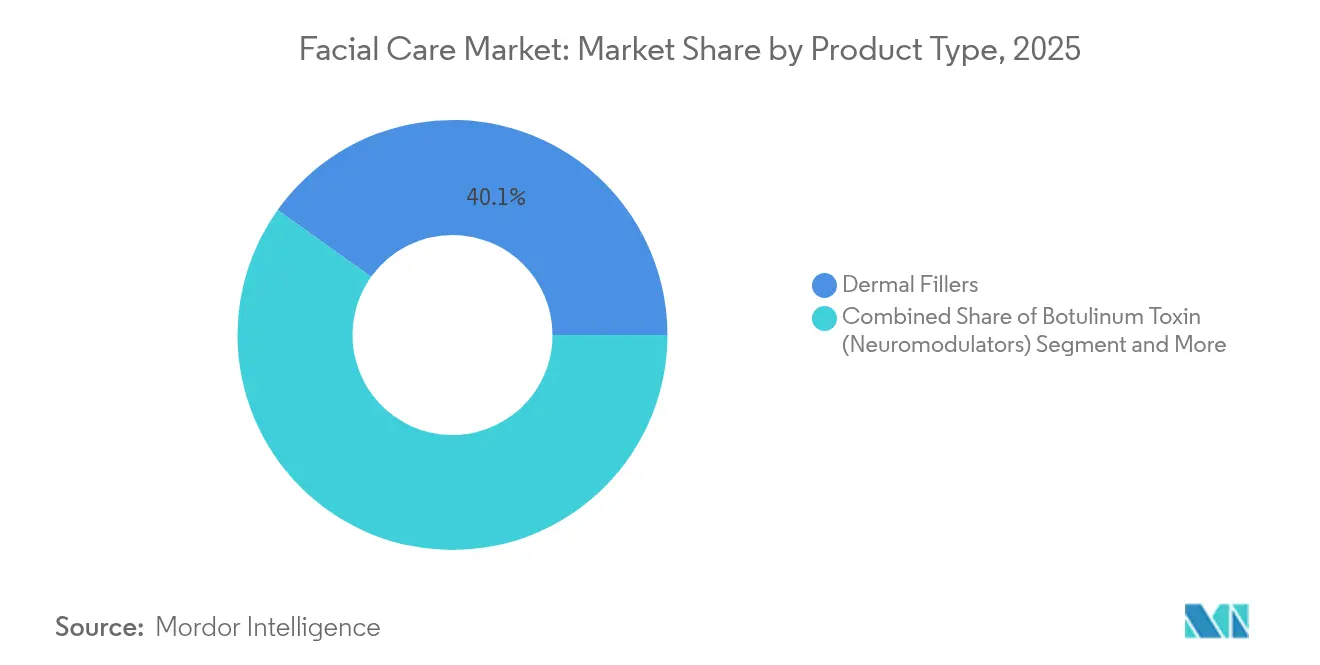
- By product type, dermal fillers captured 40.12% of the facial care market size in 2025; laser and energy-based devices are forecast to expand at a 6.24% CAGR through 2031.
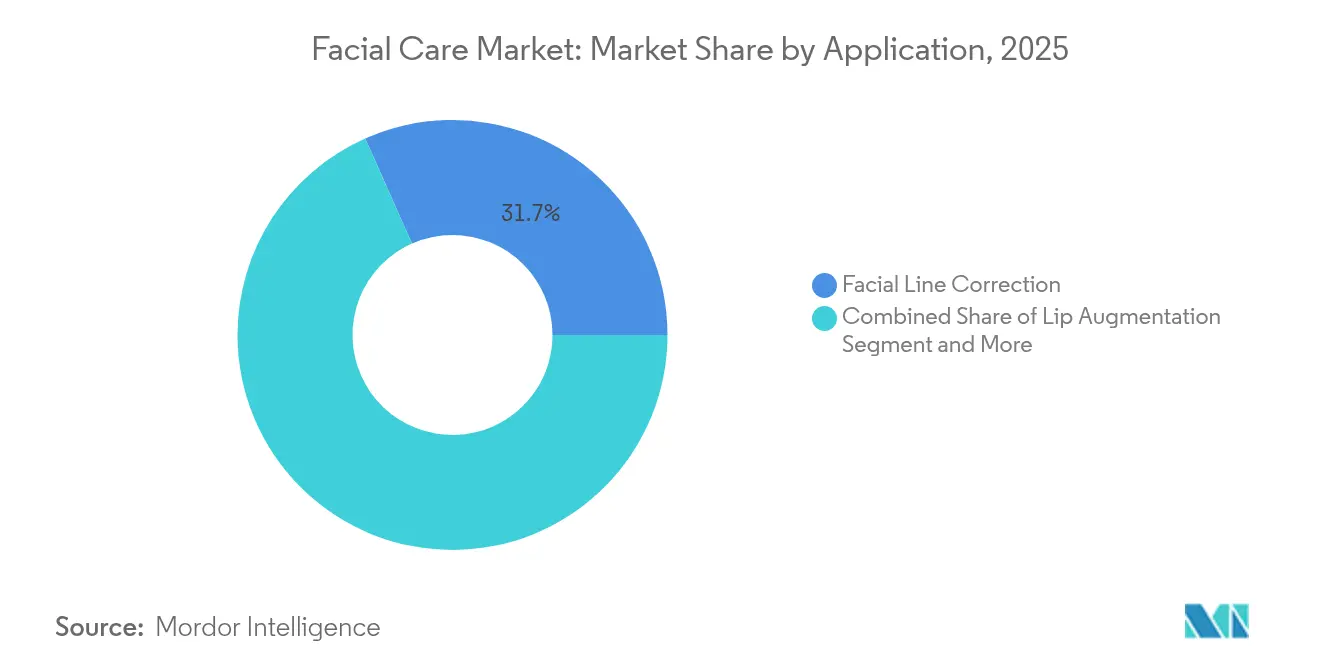
- By application, facial line correction accounted for 31.65% of revenue in 2025, whereas skin tightening and lifting is advancing at a 7.42% CAGR to 2031.
Note: Market size and forecast figures in this report are generated using Mordor Intelligence’s proprietary estimation framework, updated with the latest available data and insights as of 2026.
Market Trends and Insights
Drivers Impact Analysis of Facial Care Market*
| Driver | (~) % Impact on CAGR Forecast | Geographic Relevance | Impact Timeline |
|---|---|---|---|
| Social-Media-Fuelled "Preventive Botox" Boom | +1.2% | Global, with concentration in North America & Europe | Short term (≤ 2 years) |
| AI-Powered Hyper-Personalised Skin Diagnostics Drives Device Revenues | +0.8% | APAC core, spill-over to North America | Medium term (2-4 years) |
| Shift Toward Minimally-Invasive, Lunchtime Procedures In Urban Clinics | +1.1% | Global urban centers, led by North America & APAC | Short term (≤ 2 years) |
| Exosome-Based Regenerative Injectables Reach Commercial Scale | +0.9% | North America & EU, expanding to APAC | Medium term (2-4 years) |
| Male Aesthetic-Wellness Uptake Expands Core Customer Base | +0.7% | Global, strongest in North America & Europe | Long term (≥ 4 years) |
| Subscription-Based Treatment Plans Lock-In Lifetime Value | +0.5% | North America & Europe | Medium term (2-4 years) |
| Source: Mordor Intelligence | |||
Social-Media-Fuelled “Preventive Botox” Boom
Preventive neurotoxin use has surged, with 75% of facial plastic surgeons seeing more patients under 30 who aim to prevent static wrinkles rather than correct them.[1]Source: Kate Duffy, “Gen Z Status Symbol: Why Everyone Is Getting Botox,” Business Insider, businessinsider.com Viral “before-and-after” reels on TikTok convert interest into clinic visits, locking in multi-year treatment plans that stabilize practitioner revenues. The Zoom videoconference era amplified self-scrutiny and kept demand elevated even after offices reopened. Clinics now market conservative dosing protocols that preserve natural expression, a strategy that improves patient satisfaction and loyalty. These factors together strengthen the facial care market by embedding regular treatments into everyday grooming habits.
AI-Powered Hyper-Personalised Skin Diagnostics Drives Device Revenues
Machine-learning skin analyzers from Perfect Corp, SkinGPT, and others perform 3-D mapping and predict collagen density, allowing clinicians to match devices and injectables more accurately to individual needs. Improved diagnostic confidence reduces retreatment rates and boosts word-of-mouth referrals, directly raising per-patient revenue. The technology resonates in Asia-Pacific, where mobile-first consumers embrace virtual consultations. Manufacturers benefit because each diagnostic license or hardware bundle represents a recurring revenue stream beyond procedure fees. The capability also broadens the facial care industry’s reach to skin of color, historically underserved by legacy imaging systems.
Shift Toward Minimally Invasive, Lunchtime Procedures In Urban Clinics
Thread lifts and monopolar-bipolar RF microneedling systems like Potenza let patients return to work within hours, matching lifestyles in high-density cities. The convenience draws first-time visitors who might have avoided traditional surgery. Shorter appointment windows improve clinic throughput and profitability. Lower downtime and moderate pricing broaden socioeconomic appeal, reinforcing market depth. Device makers are responding with hybrid platforms that combine light, ultrasound, and RF to maximize outcomes without additional recovery time, sustaining the facial care market’s growth momentum.
Exosome-Based Regenerative Injectables Reach Commercial Scale
First-to-market exosome products such as Chronos deliver more than 50 billion particulates per vial and stimulate collagen up to six-fold, offering a “natural” upgrade to conventional fillers. Clinical research spearheaded by Mayo Clinic shows accelerated healing and enhanced elasticity, supporting broader indication approvals. Early adopters gain a reputation for cutting-edge care, capturing premium pricing. The regenerative narrative appeals to wellness-oriented consumers wary of synthetic gels, extending the facial care market lifecycle as patients combine exosomes with neurotoxins and lasers for layered results.
Restraints Impact Analysis of Facial Care Market*
| Restraint | (~) % Impact on CAGR Forecast | Geographic Relevance | Impact Timeline |
|---|---|---|---|
| Tightening FDA Scrutiny of Dermal-Filler Indications | -0.9% | North America, with regulatory spillover to EU | Short term (≤ 2 years) |
| Rising Adverse-Event Visibility on Social Platforms | -0.6% | Global, amplified in social media-active regions | Short term (≤ 2 years) |
| Talent Shortage of Certified Injector-Physicians Outside Tier-1 Cities | -0.8% | Global, acute in emerging markets and rural areas | Long term (≥ 4 years) |
| Consumer Pivot to "Clean / Natural" May Cannibalise Injectable Spend | -1.1% | North America & Europe, spreading to APAC | Medium term (2-4 years) |
| Source: Mordor Intelligence | |||
Tightening FDA Scrutiny of Dermal-Filler Indications
The February 2025 advisory panel flagged off-label injection sites and removal protocols, signaling tougher submissions and higher post-market data demands.[2]Source: U.S. FDA, “General and Plastic Surgery Devices Panel Notice of Meeting,” FederalRegister.gov New fillers now require longer pivotal trials, delaying revenue inflows for manufacturers. Clinics face added consent requirements that lengthen consultation times. Although the measures improve patient safety, they may slow product refresh cycles, tempering short-term facial care market growth.
Consumer Pivot to “Clean / Natural” May Cannibalise Injectable Spend
“Filler fatigue” is steering some users toward plasma injections, facial massage, and cosmetic acupuncture, particularly in trend-setting Los Angeles and London. Influencers tout “skinormalism,” urging subtle texture improvements over volume augmentation. Brands that fail to add regenerative or skincare lines risk attrition. Nevertheless, hybrid regimens that pair gentle resurfacing lasers with topical exosome serums can recapture spend and keep consumers within the facial care market ecosystem.
*Our forecasts treat driver/restraint impacts as directional, not additive. The impact forecasts reflect baseline growth, mix effects, and variable interactions.
Facial Care Market Segment Analysis
By Product Type:
Dermal Fillers Anchor Revenue but Devices AccelerateDermal fillers contributed 40.12% to 2025 revenue, illustrating the continued pull of hyaluronic-acid injectables that deliver immediate volumization with minimal downtime. The Evolysse Cold-X approval extended durability claims to 24 months, reducing annual syringe counts per patient and encouraging premium pricing. Botulinum toxin lines remain resilient due to consistent demand for glabellar and crow’s-feet smoothing, bolstered by Letybo’s FDA clearance in 2024. Radio-frequency microneedling systems now ship with interchangeable needle depths and impedance monitoring, widening treatable indications and enticing filler-averse clients.
Laser and other energy devices command the fastest 6.24% CAGR to 2031, reflecting patient appetite for non-injectable texture refinement. The MIRIA 1550 nm laser targets mid-dermal collagen while sparing the epidermis, reducing PIH risk for deeper skin tones. AI-guided settings shorten learning curves, allowing rapid deployment across multisite chains. Emerging categories such as exosome-infused biostimulators and diagnostic scanners form the “Others” bucket, which captures incremental wallet share as clinics upsell adjunct modalities. These cross-currents keep the facial care market dynamic and innovation-oriented.



By Application:
Facial Line Correction Dominates as Lifting Gains SteamPreventive neurotoxins and soft tissue fillers saw facial line correction secure 31.65% of 2025 revenue, anchored by widespread acceptance of brow and peri-orbital treatments among millennials. The facial care market size for this segment benefits from off-label zones like the masseter, which also address functional bruxism symptoms. However, rising filler dissolution requests encourage practitioners to focus on balanced ratios rather than maximal volume, indicating a maturing consumer base.
Skin tightening and lifting, projected at a 7.42% CAGR, leverages monopolar RF and high-intensity focused ultrasound to counteract weight-loss-related laxity dubbed the “Ozempic face”. Combination therapies pair dilute Sculptra with energy devices to rebuild collagen scaffolding, fostering long-term elasticity. Acne-scar revision benefits from fractional lasers that achieve 30% faster re-epithelialization when combined with growth-factor serums, broadening adolescent engagement. Hyperpigmentation management—especially melasma—relies on low-fluence 1927 nm thulium lasers paired with topical tranexamic acid, meeting strong demand in Asia-Pacific. This diversified application mix stabilizes revenue cycles and elevates the overall facial care market share for non-injectable services.
Geography Analysis
North America Facial Care Market
North America retained 35.88% of the facial care market in 2025, supported by high household spending power and a dense network of board-certified dermatologists. Subscription plans that bundle quarterly toxin visits with annual fractional laser resurfacing underpin repeat revenues. Yet FDA vigilance and a vocal “clean beauty” community create selective headwinds that providers counter by adding exosome-based options.
APAC Facial Care Market
Asia-Pacific posts the strongest 8.08% CAGR, bolstered by e-commerce beauty education, mobile payments, and K-beauty influence. China’s tier-2 cities expand clinic counts to capture middle-income spend, while Japan and South Korea anchor technology R&D. AI diagnostic tools localize pigmentation analytics, reassuring consumers with Fitzpatrick skin types IV-VI. This adoption surge positions the region to command a growing slice of global facial care market size by 2031.
Europe, South America and Middle East Facial Care Market
Europe exhibits steady replacement demand, benefitting from an aging population and a preference for evidence-based treatments. Strict MDR regulations lengthen device approvals but simultaneously elevate safety perceptions. South America and the Middle East record double-digit procedure volume growth from rising disposable incomes and cultural affinity for beauty services. Training partnerships with European laser academies are narrowing talent gaps, enabling faster technology transfer. Together, these regional patterns maintain robust top-line growth in the facial care industry despite localized challenges.
Mordor Intelligence provides coverage of the facial care market across other key regional markets. Detailed country-level analysis extends to Australia incorporating local coverage and market participation, as required.

Regulatory Landscape
Facial care products span regulated medical devices (injectables and energy-based systems used in clinics) as well as cosmetics and consumer skincare, which creates a split compliance burden across markets. In the United States, the FDA strengthened quality-system expectations for device manufacturers as the Quality Management System Regulation (QMSR) took effect on February 2, 2026, transitioning from 21 CFR Part 820 toward ISO 13485:2016 alignment. This raises the importance of documented design controls, supplier quality, and post-market processes for aesthetic device portfolios.
In Europe, the EU Medical Device Regulation (MDR 2017/745) extends conformity assessment and post-market surveillance expectations to certain products without an intended medical purpose under Annex XVI, including aesthetic dermal fillers and high-intensity light-emitting skin devices. Common Specifications under (EU) 2022/2346 shape safety and performance evidence requirements, with transitional provisions allowing certain Annex XVI products lawfully marketed before June 22, 2023 to remain available until December 31, 2027 or December 31, 2028 (depending on classification) when specific conditions are met, including having a contract with a Notified Body. Alongside device rules, the US Modernization of Cosmetics Regulation Act of 2022 (MoCRA) introduced facility registration and product listing obligations for cosmetic manufacturers, with phased implementation through 2024 and 2025, affecting topical adjuncts that are often bundled with in-clinic facial care regimens.
Value Chain Analysis
The facial care value chain spans upstream material and component suppliers (for example, hyaluronic acid and other biomaterials for fillers, polymers and sterile packaging for injectables, and precision electronics, optics, and energy-delivery components for lasers, IPL, RF, and microneedling systems). This is followed by product development and verification/validation to support clinical claims. Manufacturers often work with specialized OEM/ODM and CDMO partners for device assembly, sterile fill-finish, and packaging, while keeping close control over software, energy-delivery performance, and consumables that underpin recurring revenue.
Regulatory and quality compliance is a core mid-chain activity that shapes time-to-market and cost structure, especially for EU MDR (including Annex XVI) conformity assessment through Notified Bodies and for US-market device pathways supported by ISO 13485-aligned systems after the FDA QMSR effective date (February 2, 2026). Downstream, companies sell directly to large clinic groups and also use regional distributors for local market access, training, and service coverage, reaching end users through dermatology clinics, plastic surgery practices, and med-spas. Key bottlenecks include multi-jurisdiction regulatory fragmentation, Notified Body capacity constraints in Europe, and the need for consistent service, calibration, and consumables supply to maintain outcomes and manage adverse-event risk.
Competitive Landscape
The sector operates under moderate concentration, reflecting an oligopolistic but contested field. AbbVie’s aesthetics unit booked USD 5.176 billion in 2024 revenue, while Galderma registered USD 3.259 billion during the same period. Crown Laboratories’ USD 924 million purchase of Revance and the Cynosure–Lutronic merger highlight a race to assemble end-to-end portfolios melding toxins, fillers, and energy platforms.
Technological edge defines competitive advantage. InMode’s IgniteRF bundles nine technologies into one console, tackling laxity, adiposity, and resurfacing, although 2024 revenue slipped to USD 394.8 million after elective procedure softness. Start-ups focusing on exosome delivery and AI diagnostics attract venture funding, positioning them as potential acquisition targets. Meanwhile, Merz Aesthetics is channeling capital into regenerative R&D via Acorn Biolabs, pre-empting shifts toward “natural” injectables.
Pricing strategies range from premium tiered loyalty programs in North America to value-tier toxin brands in Latin America. Geographic diversification hedges currency swings, and direct-to-consumer skincare lines cross-sell procedure packages. Combined, these tactics preserve margins as the facial care market absorbs new entrants and changing consumer expectations.
Facial Care Industry Leaders
Cutera
Candela Corporation
Medytox Inc
Stryker (Powered Aesthetics)
Zimmer Biomet
- *Disclaimer: Major Players sorted in no particular order
Facial Care Market Companies Covered in this Report
- AbbVie-Allergan
- Galderma
- Merz Pharma
- Johnson & Johnson (Mentor/Cerenovus)
- Cutera
- Candela Medical
- Cynosure
- InMode
- Stryker (Powered Aesthetics)
- Zimmer Biomet
- Revance Therapeutics
- Allergan Aesthetics (CoolSculpting®)
- Sinclair Pharma
- GANA R&D
- BIOPLUS
- Cytophil
- BIOXIS Pharmaceuticals
- Lumenis
- Alma Lasers
- Suneva Medical
- Medytox

Market Opportunities and Future Outlook
Opportunities center on higher-value combinations of diagnostics, procedures, and adjunct products that improve personalization and outcomes across diverse skin types. FDA clearance in July 2026 for SkinHealth Systems Inc.'s SkinStylus SteriLock MicroSystem for improvement of periorbital wrinkles in all Fitzpatrick skin types points to whitespace for indications and protocols that explicitly support broader skin-tone coverage, especially in periorbital and pigmentation-sensitive use cases where providers emphasize safety and downtime. At the same time, the market pull toward AI-assisted, hyper-personalized skin assessment tools (already visible through platforms such as Perfect Corp and SkinGPT) creates room for integrated workflows that connect diagnostics to device settings and bundled treatment plans.
On the supply side, compliance-driven upgrades and multi-indication platforms support differentiation as manufacturers implement ISO 13485:2016-aligned systems under the FDA QMSR (effective February 2, 2026) and address EU MDR Annex XVI requirements for aesthetic products captured under medical-device-like rules. Product cadence at major clinical forums also reflects ongoing commercialization. Candela used IMCAS Paris to launch its Glace facial treatment platform in Europe, alongside additional systems positioned for facial treatments and skin renewal, which underscores continued investment in energy-based and combination platforms. These dynamics support expansion in clinic chain rollouts and service-and-consumables annuity models, alongside biologic-adjunct regimens (including exosome-based approaches referenced in current clinical adoption narratives) that track with the consumer shift toward results framed as regenerative and natural.
Recent Industry Developments in Facial Care Market
- July 2026: Evolus signed an exclusive licensing and distribution agreement with IBSA to develop and commercialize Profhilo in the United States, expanding beyond neuromodulators and HA gels into the skin quality segment. The agreement broadens the companys injectable portfolio and adds a differentiated category that can be integrated into multi-visit facial care plans alongside toxin and device-based treatments.
- February 2025: Evolus received FDA approval for Evolysse Form and Evolysse Smooth hyaluronic acid gels. The approvals added new filler options for US aesthetic practices and strengthened competitive intensity in injectables, especially for clinics that standardize on a limited set of supplier portfolios.
- April 2024: Cynosure completed its merger with Lutronic to form Cynosure Lutronic Inc., combining two energy-based device franchises under one organization. The consolidation expanded breadth across laser and energy platforms, supporting cross-selling into multi-site clinic networks that increasingly prefer consolidated service, training, and upgrade pathways.


Facial Care Market Report Scope and Research Methodology
Market Definition and Coverage
This market covers facial care procedures and interventions used to improve facial skin appearance or treat common facial skin concerns, with spending captured as revenue at current prices across the covered geographies.
Scope exclusions: general body skin care products and non-facial beauty services are excluded unless they are directly part of a defined facial care procedure.
Segments Covered in This Report
- By Product Type
- Dermal Fillers
- Botulinum Toxin (Neuromodulators)
- Laser & Energy-based Devices
- Radio-frequency Microneedling Systems
- Others
- By Application
- Facial Line Correction
- Lip Augmentation
- Skin Tightening / Lifting
- Acne & Scar Treatment
- Hyper-pigmentation / Tone Correction
- Others
- By Geography
- North America
- United States
- Canada
- Mexico
- Europe
- Germany
- United Kingdom
- France
- Italy
- Spain
- Rest of Europe
- Asia-Pacific
- China
- Japan
- India
- Australia
- South Korea
- Rest of Asia-Pacific
- Middle East and Africa
- GCC
- South Africa
- Rest of Middle East and Africa
- South America
- Brazil
- Argentina
- Rest of South America
- North America
Data Sources, Market Sizing, and Validation
Desk Research
Desk work started with building a clear view of the treatment pool and the supply environment for facial care procedures, so later interview inputs could be used in a structured way. Public sources used in this step included World Health Organization materials for broad skin health indicators, the US FDA for device and safety context, and national health agencies for procedure-level definitions and coding references.
To shape country and region level assumptions, we also reviewed UN Comtrade and national customs portals for device trade signals, along with peer-reviewed dermatology and aesthetic medicine journals for adoption patterns and treatment outcomes that affect repeat rates. Company filings, investor presentations, and trusted press coverage were used to understand product mix and route to market changes. A paid subscription for company financials and news was then used to cross-check large player revenue directionally. The desk research sources listed here are illustrative only, and we used additional public references for data collection, validation, and clarification.
Primary Interviews and Surveys
Primary work focused on interviews and short surveys with clinic decision makers, device and injectable distributors, and experienced practitioners who see demand shifts early. We used these discussions to sanity check procedure volumes, typical pricing ranges, and how quickly newer modalities are replacing older ones across APAC, EMEA, and the Americas.
Distribution of primary research fieldwork respondents
| Company type | Respondent position | Region |
|---|---|---|
| Top tier: 27% | CXOs: 16% | APAC: 43% |
| Mid tier: 53% | Functional/Unit leaders: 40% | EMEA: 32% |
| Smaller Players: 20% | Managers: 44% | Americas: 25% |
Market-Sizing & Forecasting
The core model is built using a top-down approach where procedure demand pools are reconstructed by country using clinic activity signals and the estimated treated population, and then translated into revenue using average price ranges for each procedure type. To keep it grounded, totals are corroborated with selective bottom-up approximations using sampled clinic price menus, distributor channel checks, and partial supplier roll ups where disclosure allows, and then adjusted if a clear mismatch shows up.
Model inputs include, in an illustrative way, the annual number of aesthetic facial procedures by category, the share of minimally invasive versus surgical treatments, the installed base and utilization of energy-based devices, repeat treatment frequency for key indications, and local price dispersion between premium clinics and mid-priced providers. Where a data gap exists for smaller countries, proxy ratios are used from similar markets based on income levels and urban population, followed by a cross-check with interview feedback so the assumption does not drift.
For forecasting, scenario analysis was used because the market can swing based on consumer confidence, clinic capacity, and regulatory scrutiny, and these factors do not move in a straight line. Growth paths were set with a base case, conservative case, and faster adoption case, and then the final forecast was selected after aligning with practitioner and distributor expectations on pricing progression and procedure mix shifts.
Data Validation & Update Cycle
Validation was done through several passes, starting with internal checks on unit economics so implied procedure counts and prices stay realistic at country level. Outputs were then compared against independent signals such as device trade direction, clinic expansion news, and reported revenue momentum, and any outlier country was reworked before sign off.
A second analyst review is completed to catch definition leakage and to confirm that regional roll ups match the stated scope and time period. Reports are refreshed annually, and interim updates are triggered when a material event changes pricing, availability, or procedure adoption. Before delivery, we do a final refresh pass so clients receive the latest updated view rather than an older snapshot.
Mordor Intelligence's Facial Care Market Size Versus Other Published Estimates
Published facial care market numbers can look far apart because some sources count consumer facial skin care products, while others size procedure-driven facial aesthetics, which is a narrower demand pool. Differences also come from which price points are used, the base year timing, and whether the estimate is anchored to real procedure activity or to broader beauty spending.
Procedure volume signals, device utilization checks, and clinic pricing ranges are the evidence used to keep Mordor Intelligence's estimate aligned to facial care procedures rather than general retail skin care sales. Another practical driver is how pricing is updated, since some figures hold prices flat or apply a single inflation factor across all procedures even when modality mix is changing.
Benchmark comparison
| Source | Market Size | Gaps in Research Methodology |
|---|---|---|
| Mordor Intelligence | USD 18.8 B (2026) | |
| Global Consultancy A | USD 116.03 B (2024) | This estimate appears to focus on facial care products sold through retail channels, so it includes creams, cleansers, and related items that are outside procedure-based facial care interventions. |
| Trade Publisher B | USD 99.9 B (2025) | This figure is presented for the broader facial care products market, and it also uses a different base year and forecast window, which can shift currency timing and average price assumptions. |
The spread across sources mainly comes down to what is being counted and how pricing is carried forward across years. By tying the size to observable procedure activity and realistic price bands, the estimate stays traceable to clear inputs that can be rechecked and updated as the market shifts.


Key Questions Answered in the Report
What is the current facial care market size?
The facial care market size is USD 18.8 billion in 2026 and is projected to reach USD 25.38 billion by 2031.
Which region is growing fastest in the facial care market?
Asia-Pacific shows the highest growth, expanding at an 8.08% CAGR through 2031.
Which product category leads facial care market revenue?
Dermal fillers dominate with 40.12% of 2025 revenue, thanks to continual formulation upgrades.
Why are subscription plans important for clinics?
Membership models raise patient retention and smooth cash flow, growing 24% in 2024.
How is male demand influencing the facial care market?
Male clients increased skincare usage by 68% in 2023, spend more per visit, and drive loyalty-based revenue growth.
What emerging technology may reshape facial aesthetics?
Exosome-based injectables promise natural collagen stimulation, offering a regenerative alternative to traditional fillers.
Page last updated on:


 Your data is secure and never sold or shared.


