
Cosmetic Implants Market Size and Share
Market Overview
| Study Period | 2020 - 2031 |
|---|---|
| Market Size (2026) | USD 13.65 Billion |
| Market Size (2031) | USD 19.16 Billion |
| Growth Rate (2026 - 2031) | 7.03 % |
| Fastest Growing Market | Asia Pacific |
| Largest Market | North America |
| Market Concentration | Medium |
Major Players *Disclaimer: Major Players sorted in no particular order Image © Mordor Intelligence. Reuse requires attribution under CC BY 4.0. | |
Cosmetic Implants Market Analysis by Mordor Intelligence
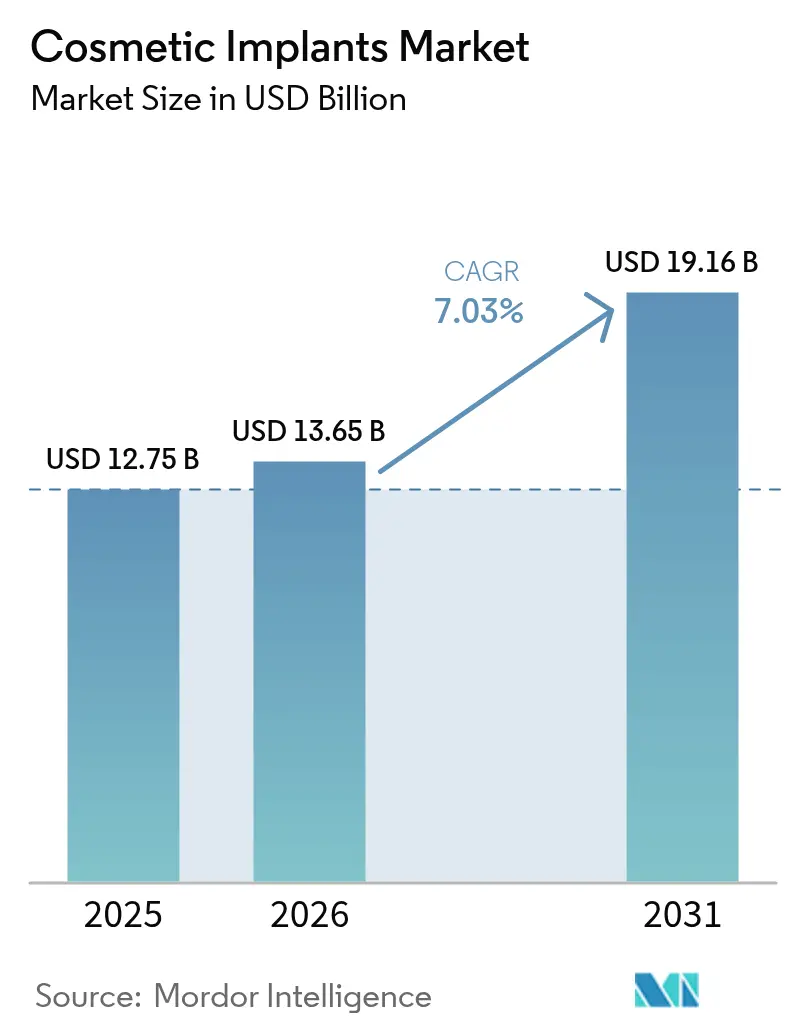
The Cosmetic Implants Market size is expected to grow from USD 12.75 billion in 2025 to USD 13.65 billion in 2026 and is forecast to reach USD 19.16 billion by 2031 at 7.03% CAGR over 2026-2031.
Consistent demand stems from rapid material science breakthroughs, wider acceptance of aesthetic procedures among diverse age groups, and a steady preference for treatments that combine functional restoration with cosmetic appeal. Manufacturers continue to secure regulatory approvals that emphasize clinical safety, while advances in 3D printing, artificial intelligence, and regenerative medicine create opportunities for highly personalized solutions. Rising disposable income levels in emerging economies and expanding access through digital platforms have broadened the addressable patient pool. At the same time, premium pricing, heightened regulatory scrutiny, and competition from minimally invasive alternatives temper absolute growth but encourage differentiation based on safety, efficacy, and sustainability.
Key Report Takeaways
- By raw material, polymer implants captured 35.42% of cosmetic implants market share in 2025, while biological material implants are forecast to expand at a 9.12% CAGR to 2031.
- By application, dental procedures led with 45.55% of the cosmetic implants market size in 2025 and continue to anchor overall revenue momentum, while body contouring are forecast to expand at a 10.05% CAGR to 2031.
- By end-user setting, dental clinics led with 34.11% of the cosmetic implants market size in 2025 and ambulatory surgical centers represent the fastest-growing venue, advancing at an 10.62% CAGR between 2026 and 2031 as payers and patients shift toward cost-effective outpatient care.
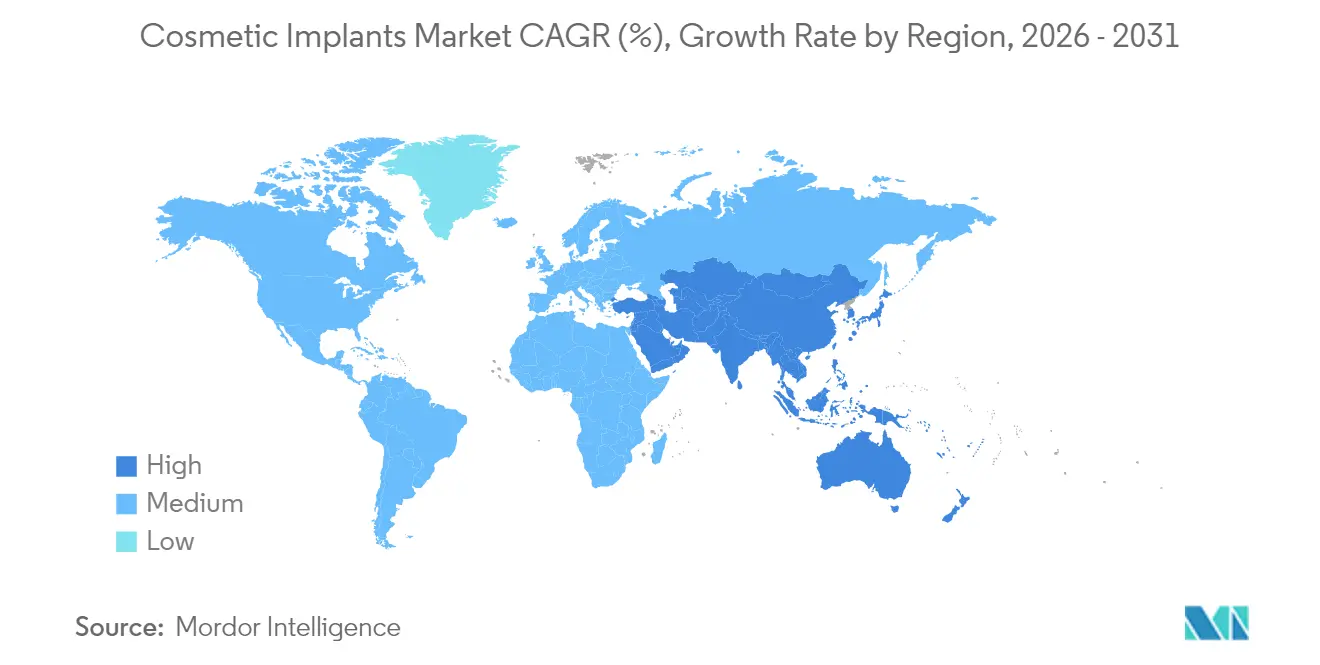
- By geography, North America held 41.78% of cosmetic implants market share in 2025, whereas Asia-Pacific is projected to record the highest regional CAGR at 9.45% through 2031.
Note: Market size and forecast figures in this report are generated using Mordor Intelligence’s proprietary estimation framework, updated with the latest available data and insights as of 2026.
Market Trends and Insights
Drivers Impact Analysis of Cosmetic Implants Market*
| Driver | (~) % Impact on CAGR Forecast | Geographic Relevance | Impact Timeline |
|---|---|---|---|
| Escalating interest in aesthetic procedures for personal and social confidence | +1.8% | Global, strongest in North America & Asia-Pacific | Medium term (2-4 years) |
| Breakthroughs in biomaterials and 3D printing enabling precision and innovation | +2.1% | North America & Europe lead, APAC adoption rising | Long term (≥ 4 years) |
| Rising influx of medical tourists into cost-effective treatment hubs | +1.2% | Asia-Pacific core, spill-over to MEA & South America | Short term (≤ 2 years) |
| Increasing disposable income among middle-class consumers worldwide | +1.4% | Global, notably emerging APAC & South America | Medium term (2-4 years) |
| AR beauty filters driving aspirational standards and reshaping self-image norms | +0.8% | Global, pronounced in North America & developed APAC | Short term (≤ 2 years) |
| Growing demand for gender-affirming surgeries creating specialized segments | +0.6% | North America & Europe, expanding in progressive APAC | Long term (≥ 4 years) |
| Source: Mordor Intelligence | |||
Escalating Interest in Aesthetic Procedures for Personal and Social Confidence
The shift from corrective to enhancement-focused motivations has positioned the cosmetic implants market as a routine component of self-care for many consumers. Survey data show that 85% of medical aesthetic clients intend to sustain or increase spending on procedures, a sentiment now spanning multiple age cohorts. Gender dynamics are also evolving, with a marked rise in male participation and a growing emphasis on gender-affirming implant surgeries.[1]Cigna Healthcare, “Dental Implant Care: Trends and AI Adoption,” cigna.com Social-media exposure normalizes aesthetic treatments, eroding stigma and reinforcing aspirational standards. Younger demographics increasingly pursue “preventive” implants to delay visible aging, suggesting a structural expansion of lifetime demand. Clinics that tailor messaging to confidence, career advancement, and wellness capture higher patient retention rates while fostering long-term growth.
Breakthroughs in Biomaterials and 3D Printing Enabling Precision and Innovation
Additive manufacturing and advanced biomaterials underpin the latest wave of patient-specific solutions. Researchers at the University of Sydney demonstrated nanoscale 3D printing for synthetic bone substitutes with 300 nm resolution that supports robust bone regeneration.[2]University of Sydney, “Researchers Produce Synthetic Bone Substitute Using Nanoscale 3D Printing,” sydney.edu.au Shape-memory scaffolds combining polylactic acid and polycaprolactone now deliver dual tumor-ablation and bone-regrowth functionality on near-infrared activation. CollPlant’s partnership with Stratasys targets 200 cc regenerative breast implants manufactured from plant-based collagen, aligning with biodegradability and biocompatibility priorities. These advances address longstanding concerns over capsular contracture, implant rupture, and revision surgeries. Personalized design shortens operative time and improves aesthetic outcomes, reinforcing premium-pricing potential and competitive differentiation within the cosmetic implants market.
Rising Influx of Medical Tourists into Cost-Effective Treatment Hubs
Cross-border travel for cosmetic implants surged as patients leverage cost differentials and specialized expertise. South Korea’s integrated medical tourism framework bundles travel, procedure, and recuperation services into seamless packages that appeal to Chinese and Southeast Asian clients.[3]MDPI, “Medical Tourism Ecosystem in Korea for Chinese Patients,” mdpi.com Nonetheless, safety incidents and regulatory gaps in some popular destinations prompt more affluent travelers to favor jurisdictions with transparent oversight. Emerging Asian economies respond by fortifying domestic quality standards to retain outbound demand. The balance between affordability and assurance will continue to shape country-level growth trajectories.
Increasing Disposable Income Among Middle-Class Consumers Worldwide
Expanding middle-class segments in China, India, Indonesia, and Brazil represent a sizable influx of first-time elective procedure candidates. Rising household earnings coincide with a cultural transition that frames appearance enhancement as an investment in professional and social capital. Premiumization trends indicate willingness to pay for differentiated implant technologies that promise natural feel, low complication rates, and shorter recovery periods. Digital platforms streamline discovery, financing, and after-care, further lowering adoption barriers and enlarging the cosmetic implants market.
Restraints Impact Analysis of Cosmetic Implants Market*
| Restraint | (~) % Impact on CAGR Forecast | Geographic Relevance | Impact Timeline |
|---|---|---|---|
| Premium pricing of surgical implants and associated medical services | -1.5% | Global, acute in price-sensitive emerging markets | Medium term (2-4 years) |
| Ongoing safety issues, product recalls, and legal disputes | -0.9% | North America & Europe, regulatory spillover worldwide | Short term (≤ 2 years) |
| Sustainability concerns tied to silicone and polymer waste disposal | -0.7% | Europe & North America, expanding to APAC | Long term (≥ 4 years) |
| Rising preference for non-surgical alternatives like dermal fillers and thread lifts | -1.2% | Global, pronounced in developed markets | Medium term (2-4 years) |
| Source: Mordor Intelligence | |||
Premium Pricing of Surgical Implants and Associated Medical Services
Full-cycle procedure costs frequently surpass USD 17,000 when anesthesia, facility fees, and post-operative care are included, creating affordability barriers for a broad segment of potential patients. Heightened price sensitivity drives consumers toward minimally invasive fillers and thread-lift procedures that promise visible improvements with lower financial outlays and minimal downtime. Providers respond by migrating suitable interventions to ambulatory surgical centers, which achieve lean operating structures through streamlined staffing and shorter patient turnover times. Widening adoption of in-house financing and subscription-based maintenance plans offers partial mitigation but does not fully offset cost-related attrition.
Ongoing Safety Issues, Product Recalls, and Legal Disputes
High-profile FDA Class I recalls, including Hologic’s BioZorb marker and Allergan’s textured breast implants, reinforce consumer vigilance about long-term implant safety. Litigation exposure elevates insurance premiums and imposes recalls, re-labeling, and patient-notification costs that compress margins. In response, Establishment Labs reported capsular contracture rates of only 0.5% and rupture rates of 0.6% in its Motiva clinical program, underscoring how superior safety data can become a compelling marketing advantage. Upcoming Quality System Regulation revisions, effective February 2026 will further align U.S. standards with ISO 13485, demanding tighter supplier controls and more extensive post-market surveillance.
*Our forecasts treat driver/restraint impacts as directional, not additive. The impact forecasts reflect baseline growth, mix effects, and variable interactions.
Cosmetic Implants Market Segment Analysis
By Raw Material:
Polymer Leadership Meets Biological MomentumPolymer implants accounted for 35.42% cosmetic implants market share in 2025, underpinned by decades of clinical familiarity with silicone elastomers. These materials support a spectrum of breast, facial, and body contouring procedures, making them indispensable within current surgical workflows. However, concerns over long-term degradation and environmental impact motivate research into next-generation polymers with enhanced durability and recyclability. Biodegradable polydioxanone meshes and bioresorbable polycaprolactone screws exemplify the transition to eco-friendly options that lessen revision risk.
Biological material implants, although representing a smaller revenue base, advance at a 9.12% CAGR through 2031 and embody the frontier of regenerative aesthetics. Collagen-based scaffolds sourced from tobacco plants bypass zoonotic contamination worries while facilitating tissue ingrowth. Early trials report accelerated healing, lower inflammatory profiles, and improved tactile sensation. As 3D bioprinting platforms mature, patient-specific constructs can integrate vasculature and cellular components, potentially eliminating conventional prostheses for select indications over the long term. Ceramic and metal solutions maintain niche relevance in dental and craniofacial reconstruction thanks to compressive strength and osseointegration, yet their share is expected to recede as hybrid polymer-ceramic composites reach clinical readiness.




By Application:
Dental Dominance and Body Contouring UpsurgeDental implants secured 45.55% of cosmetic implants market revenue in 2025, reflecting the dual imperative of functional restoration and aesthetic integrity. Surgeons now employ AI-assisted treatment planning that overlays CBCT scans with intraoral optical impressions, producing precise drilling templates and reducing chair time by up to 30%. Zirconia and titanium alloy fixtures continue as mainstays, yet hybrid polymer-ceramic abutments gain popularity for patients requiring higher translucency in the esthetic zone.
Body contouring leads the growth trajectory, progressing at a 10.05% CAGR as patients demand comprehensive silhouette refinement. Customizable gluteal and pectoral implants produced via additive manufacturing address anatomical diversity while minimizing implant migration. Post-bariatric patients represent a growing cohort pursuing contouring solutions to manage redundant tissue once weight targets are met. Facial implants capture steady demand for mandibular angle, malar, and nasal augmentation, with 3D-printed porous polyethylene enabling long-lasting integration. Breast augmentation remains a stable contributor but faces incremental substitution by fat-grafting techniques augmented with platelet-rich plasma, a trend that may redirect volume toward combination procedures.
By End User:
Ambulatory Settings Redefine Procedure EconomicsDental clinics held 34.11% of cosmetic implants market revenue in 2025, leveraging specialized workflow efficiencies and high patient throughput. Cloud-based practice management platforms integrate imaging, billing, and patient engagement, permitting real-time surgical simulation that enhances consent quality. Hospitals preserve a vital role in complex reconstructive cases requiring multidisciplinary teams, yet they face reimbursement pressure to move suitable interventions offsite.
Ambulatory surgical centers record an 10.62% CAGR, benefiting from lower fixed-cost structures, optimized staffing ratios, and streamlined regulatory requirements. These facilities often partner with device manufacturers on inventory consignment models that reduce capital outlays. Aesthetic clinics focus on integrated service lines that bundle injectables, laser resurfacing, and implant procedures, thereby maximizing lifetime patient value. Telehealth pre-consultations and AI-driven outcome visualization improve conversion rates, while post-operative remote monitoring apps cut readmission risk. As minimally invasive innovations proliferate, end-user competition will hinge on personalized care, flexible financing, and seamless digital engagement.

Geography Analysis
North America Cosmetic Implants Market
North America retained a dominant 41.78% share of cosmetic implants market revenue in 2025, supported by advanced procedural expertise, robust payer coverage for reconstructive indications, and a high-income consumer base willing to pay premiums for novel solutions. Market expansion is also visible in Canada, where streamlined import pathways and favorable exchange rates attract inbound medical tourists. Mexico’s private clinics increasingly serve cross-border patients from the southern United States, driving upgrades in facility accreditation and infection-control protocols.
Europe Cosmetic Implants Market
Europe positions safety as a competitive advantage, channeling stringent MDR compliance to reinforce patient trust. GC Aesthetics received the first MDR-certified breast implant, setting a benchmark for rivals. Germany and France lead regional procedure volumes, while Italy and Spain show pronounced growth in dental and body contouring applications. Sustainability directives accelerate investment in recyclable silicone supply chains, with New Dawn Silicones pioneering solvent-based depolymerization that achieves virgin-grade recovery. Post-Brexit regulatory divergence prompts multinational firms to establish separate conformity assessment strategies for the United Kingdom, raising costs but preserving market continuity.
APAC Cosmetic Implants Market
Asia-Pacific ranks as the fastest-growing zone, expanding at 9.45% CAGR through 2031, and is projected to contribute more than 35% of incremental global revenue over the period. Japan spearheads high-tech implant research, including titanium lattice structures fabricated via electron-beam melting for craniofacial reconstruction. South Korea’s government-supported tourism clusters combine medical, hospitality, and cultural experiences that appeal to intra-regional travelers. China’s large urban middle class fuels demand for premium dental implants, and continued e-commerce penetration lifts awareness in Tier 2 and Tier 3 cities. India advances domestic manufacturing under its “Make in India” initiative, focusing on cost-effective polymer implants that target domestic patients and neighboring markets. Australia maintains rigorous Therapeutic Goods Administration evaluations, often acting as an early-adopter test bed before broader Asia-Pacific rollouts. Collectively, these trends underscore the region’s transition from volume-driven imports to innovation-led, locally adapted product development.

Regulatory Landscape
In the United States, key cosmetic implant categories such as breast implants are regulated by the FDA as Class III medical devices under Premarket Approval (PMA), which requires more clinical evidence, tighter labeling, and stronger post-market surveillance than lower-risk aesthetic devices that can use 510(k) pathways. This risk-based approach continues to shape implant manufacturers' product strategies, particularly as safety concerns and past high-profile recalls keep clinical performance data and vigilance reporting at the center of submissions.
In Europe, the EU Medical Devices Regulation (MDR) 2017/745 expands conformity assessment requirements for certain aesthetic products without an intended medical purpose via Annex XVI, moving parts of the aesthetics ecosystem closer to medical-device style oversight from 2026. In the United Kingdom, the MHRA has been progressing reforms to the Medical Devices Regulations 2002, including international reliance routes introduced in 2025 and transition changes such as the Medical Devices (Amendment) (Great Britain) Regulations 2025 (SI 2025/591), which collectively affect approval strategy, technical documentation, and time-to-market planning for implant suppliers operating across Great Britain and the EU.
Competitive Landscape
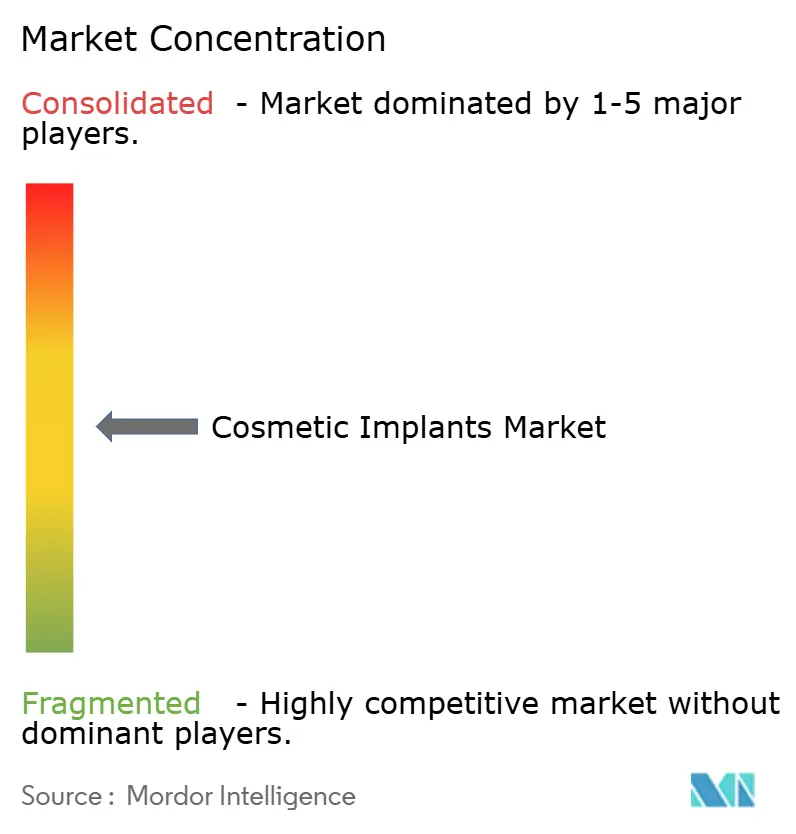
Moderate fragmentation characterizes the cosmetic implants industry, with a blend of multinational conglomerates and agile innovators vying for technological leadership. Johnson & Johnson, through its Mentor division, leverages longitudinal data from more than 200,000 breast implant recipients to substantiate reliability claims. Establishment Labs’ 2025 guidance of USD 205–210 million underscores its successful U.S. market debut, propelled by low complication metrics and proprietary surface micro-textures. Straumann Group, Zimmer Biomet, and Dentsply Sirona concentrate on influence in the dental implant sub-segment, aided by vertically integrated workflows that encompass scanning, planning, and restoration.
Strategic acquisitions accelerate portfolio expansion and cross-selling opportunities. Zimmer Biomet’s 2024 purchase of Paragon 28 broadened its foot-and-ankle portfolio and extended its reach into adjacent elective markets. Sientra’s 2024 bankruptcy and sale to Tiger Aesthetics for USD 42.5 million signal consolidation pressures for single-line players lacking the scale to absorb prolonged litigation expenses and R&D investment. Investors direct capital toward additive manufacturing startups able to customize implants at surgical sites, potentially compressing lead times from weeks to hours.
R&D emphases gravitate toward biocompatible coatings that curb bacterial colonization, AI-enabled robotic placement systems, and environmentally sustainable manufacturing. Companies allocate double-digit revenue percentages to digital workflow integration, reasoning that superior visualization and prediction tools will reduce revision surgeries and secure surgeon loyalty. As regulatory bodies intensify post-market surveillance, market entrants must pair rapid innovation with rigorous clinical validation to maintain competitive parity. Overall, winning strategies center on data-backed safety, ecosystem partnerships, and geographic agility suited to divergent regional regulatory landscapes.
Cosmetic Implants Industry Leaders
3M
Allergan (AbbVie)
Cochlear Ltd
Dentsply Sirona
Johnson & Johnson
- *Disclaimer: Major Players sorted in no particular order
Cosmetic Implants Market Companies Covered in this Report
- 3M
- Abbvie
- Cochlear
- Dentsply Sirona
- GC Aesthetics
- Henry Schein
- Implantech
- Johnson & Johnson (Mentor)
- Sientra
- Zimmer Biomet
- Straumann Group
- Establishment Labs
- Polytech Health & Aesthetics
- Silimed
- Danaher (Nobel Biocare)
- BioHorizons
- Osstem Implant
- RTI Surgical
- Hansbiomed (MegaGen)
- Medartis

Market Opportunities and Future Outlook
White space is forming where manufacturers combine premium implant platforms with clearer, indication-led differentiation and evidence packages that fit stricter oversight and higher patient scrutiny. In breast reconstruction, Johnson & Johnson MedTech's Mentor launched MENTOR MemoryGel Enhance Breast Implants in the United States in May 2025, after FDA approval and an expanded size range designed for specific post-mastectomy reconstruction needs. This gives competitors room to broaden portfolios for underserved anatomies and revision use cases, while aligning messaging and training with reconstructive pathways that run adjacent to elective aesthetics.
Opportunity also extends to adjacent aesthetic therapeutics and integrated care pathways that influence implant demand, clinic traffic, and bundled offerings. AbbVie’s Allergan Aesthetics received U.S. FDA approval in June 2026 for SKINVIVE by JUVEDERM for improvement of neck appearance (horizontal neck lines), extending injectables into a new labeled anatomical indication that clinics can combine with implant and surgical services across lifetime patient journeys. On delivery, expanding outpatient and digitally enabled pre-consult and follow-up models supports higher throughput for implant-related procedures, while material science and additive manufacturing advances continue to open avenues for more personalized implants and regenerative scaffolds that target revision risk, biocompatibility, and sustainability concerns.
Recent Industry Developments in Cosmetic Implants Market
- June 2026: AbbVies Allergan Aesthetics received U.S. FDA approval for SKINVIVE by JUVEDERM for improvement of neck appearance, including reduction of horizontal neck lines in adults over 21. The approval extends hyaluronic-acid injectables into a new labeled anatomical area, strengthening clinic portfolios that bundle aesthetic services around long-term patient maintenance and cross-sell opportunities.
- February 2026: Allergan Aesthetics launched the Faces of Natrelle Testimonial Program, inviting patients to share experiences with Natrelle breast implants. The initiative supports patient education and brand engagement at a time when implant choice is closely tied to perceived safety, outcomes, and trust.
- February 2025: Dentsply Sirona announced the U.S. market launch of the MIS LYNX dental implant system, positioned to simplify surgical procedures. A broader dental implant toolkit supports practice-level standardization and can reinforce adoption among dental clinics, a major end-user setting for cosmetic implants revenue.


Cosmetic Implants Market Report Scope and Research Methodology
Market Definition and Coverage
This market covers implantable devices and materials used in aesthetic and appearance-related procedures, including major use cases like dental, breast, facial, and body contouring procedures, measured in USD value at the point of sale to end users.
Scope exclusions: Non-implant aesthetic consumables and topical beauty products are not counted unless they are used as an implantable material placed in or on the body through a procedure.
Segments Covered in This Report
- By Raw Material
- Polymer Implants
- Ceramic Implants
- Metal Implants
- Biological Material Implants
- By Application
- Dental
- Breast
- Facial
- Body Contouring
- By End User
- Hospitals
- Specialty & Aesthetic Clinics
- Ambulatory Surgical Centers
- Dental Clinics
- By Geography
- North America
- United States
- Canada
- Mexico
- Europe
- Germany
- United Kingdom
- France
- Italy
- Spain
- Rest of Europe
- Asia-Pacific
- China
- Japan
- India
- Australia
- South Korea
- Rest of Asia-Pacific
- Middle East & Africa
- GCC
- South Africa
- Rest of Middle East & Africa
- South America
- Brazil
- Argentina
- Rest of South America
- North America
Data Sources, Market Sizing, and Validation
Desk Research
Desk work starts by building a clean fact base on procedure volumes, safety updates, and adoption signals across major regions. We rely on public and official sources such as the US FDA device databases and safety communications, the US CDC for health utilization context, OECD health statistics for cross-country comparability, and the World Bank macro indicators that help normalize affordability trends.
Next, the supply and commercialization side is reviewed using company annual reports, investor decks, product brochures, peer-reviewed clinical journals, and updates from medical and dental associations that publish training and guideline information. To reduce gaps from private-company visibility, we also use paid subscriptions focused on company financials and intelligence, along with patent databases to track material innovation and new implant indications. These desk sources are not exhaustive, and additional public documents were also used for data collection, cross-checking, and clarification.
Primary Interviews and Surveys
Primary work is used to sanity check the procedure and demand picture with surgeons, dental specialists, clinic administrators, distributors, and manufacturing-side experts across the Americas, EMEA, and APAC. The respondent input is then used to tighten assumptions on product mix shifts, typical replacement cycles, pricing bands by material type, and the split between hospital and specialty clinic purchasing. After that, the assumptions are rechecked when a specific country shows unusual growth or pricing behavior.
Distribution of primary research fieldwork respondents
| Company type | Respondent position | Region |
|---|---|---|
| Top tier: 34% | CXOs: 14% | APAC: 50% |
| Mid tier: 52% | Functional/Unit leaders: 42% | EMEA: 29% |
| Smaller Players: 14% | Managers: 44% | Americas: 21% |
Market-Sizing & Forecasting
Sizing is built using a top-down and bottom-up mix where procedure volumes and treated population pools are translated into implant demand, and then converted into value using average selling price ranges that reflect material mix (polymer, metal, ceramic, and biological) and end-user channels. Once the initial totals are built, selective bottom-up checks are run using supplier revenue direction, distributor feedback, and sampled ASP times volume math in higher-visibility countries. This helps adjust outliers without forcing a full supplier roll up.
Key model inputs include dental implant placement trends, cosmetic and reconstructive procedure momentum, clinic capacity expansion, regulatory and safety actions that can shift utilization, and pricing movement by material type and customization level. Where direct country data is thin, the gaps are handled by using proxy indicators such as disposable income trends, private healthcare penetration, and procedure tourism intensity, and then the assumptions are confirmed through interviews.
For forecasting, scenario analysis is used around procedure demand and price progression, and scenario weights are aligned to expert views on recovery pace, elective procedure willingness, and supply availability. Because sharp jumps are usually hard to sustain in this market, changes are kept gradual unless a clear trigger is validated across multiple inputs.
Data Validation & Update Cycle
Validation is done through several cross-checks so that one weak data stream does not drive the outcome. Model outputs are compared against independent signals like procedure trend direction, end-user channel growth, and material mix changes, and then large variances are reviewed before sign-off.
If a data point creates a spike that does not match observed demand or pricing behavior, the assumptions are reopened and experts are re-contacted for clarification. Reports are refreshed annually, and interim updates are made when material events occur, such as regulatory actions, major product recalls, or sudden changes in elective procedure volumes. Before delivery, a final pass is completed so clients receive the most current view that can reasonably be supported.
Mordor Intelligence's Cosmetic Implants Market Size Compared With Other Published Estimates
Published market values for cosmetic implants can differ even when the topic name looks the same, because included procedures, end-user settings, and product boundaries are not always consistent. Differences also come from how procedure demand is translated into implant value, and whether pricing is treated as a stable average or as a fast-changing variable.
The main gap drivers here are scope and counting logic, especially around whether reconstructive use cases are combined with elective cosmetic demand, and whether dental clinics are counted fully or treated as a separate medical device market. Base year choice and currency timing also matter because implant pricing can move with material mix and customization. Some estimates also rely on adoption assumptions that are not rechecked against clinic capacity and procedure constraints, which can widen the gap.
Benchmark comparison
| Source | Market Size | Gaps in Research Methodology |
|---|---|---|
| Mordor Intelligence | USD 12.75 B (2025) | |
| Global Consultancy A | USD 13.91 B (2024) | Uses an earlier base year and appears to apply a broader revenue inclusion across adjacent cosmetic device categories, which can lift totals when dental and specialty clinic purchases are not split cleanly by implant class. |
| Industry Publisher B | USD 11.78 B (2024) | Starts from a lower 2024 base and runs a longer-range build where price progression is treated more smoothly, which can understate near-term shifts toward higher value materials and more customized implant mixes. |
The spread shown above is mostly explained by year alignment, what is counted as an implant, and how price and mix changes are carried forward into the forecast. When dental, breast, facial, and body contouring implants are counted across hospitals, specialty clinics, and dental clinics, and the material mix is refreshed with interview checks, the 2025 value will naturally sit above some 2024 snapshots. This is how the model was set up by Mordor Intelligence.


Key Questions Answered in the Report
What is the current size of the cosmetic implants market?
The cosmetic implants market size reached USD 13.65 billion in 2026 and is forecast to reach USD 19.16 billion by 2031.
Which raw-material segment leads the market?
Polymer implants command 35.42% cosmetic implants market share due to versatile applications and longstanding clinical familiarity.
Which application generates the highest revenue?
Dental procedures account for 45.55% of the cosmetic implants market, combining functional restoration with aesthetic benefits.
Which end-user segment is expanding the fastest?
Ambulatory surgical centers are growing at an 10.62% CAGR over 2026-2031 as payers and patients embrace cost-efficient outpatient settings.
Which region will register the highest growth through 2031?
Asia-Pacific is projected to record a 9.45% CAGR over 2026-2031, driven by rising disposable incomes and supportive medical tourism frameworks.
How are safety concerns influencing competitive dynamics?
Manufacturers with strong clinical evidence and low complication rates, such as Establishment Labs’ 0.5% capsular contracture gain share, are expected to benefit as regulators heighten post-market surveillance.
Page last updated on:


 Your data is secure and never sold or shared.


