EV Platform Market Size and Share
Market Overview
| Study Period | 2019 - 2030 |
|---|---|
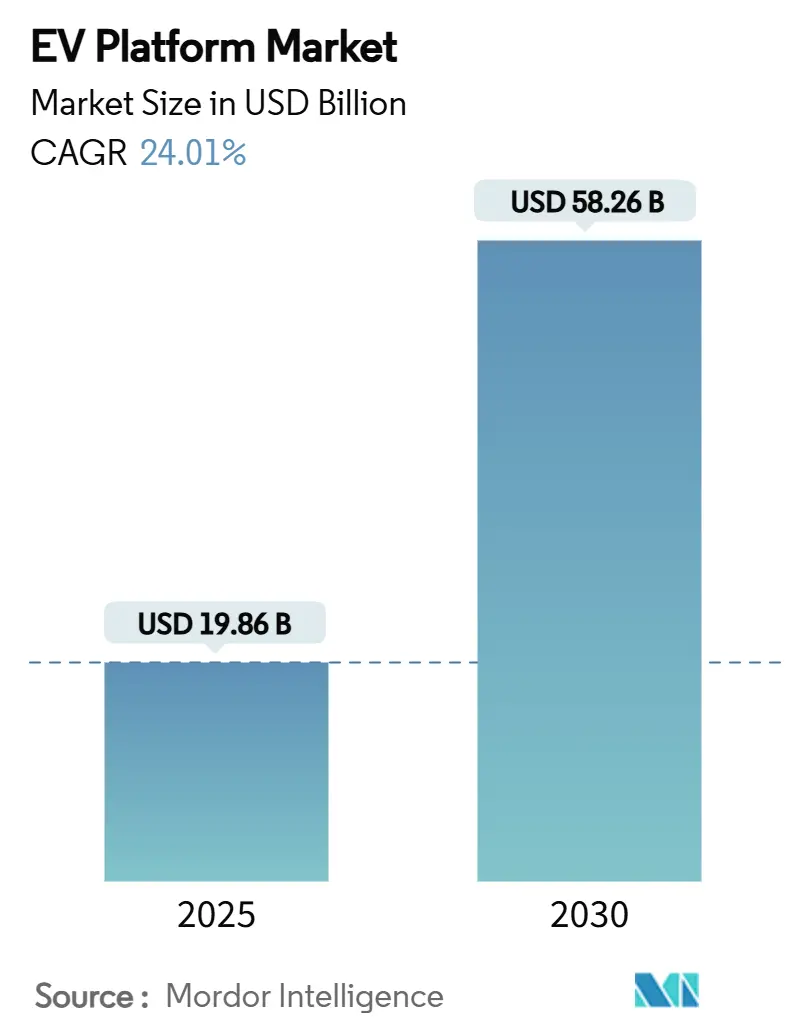
| Market Size (2025) | USD 19.86 Billion |
| Market Size (2030) | USD 58.26 Billion |
| Growth Rate (2025 - 2030) | 24.01% CAGR |
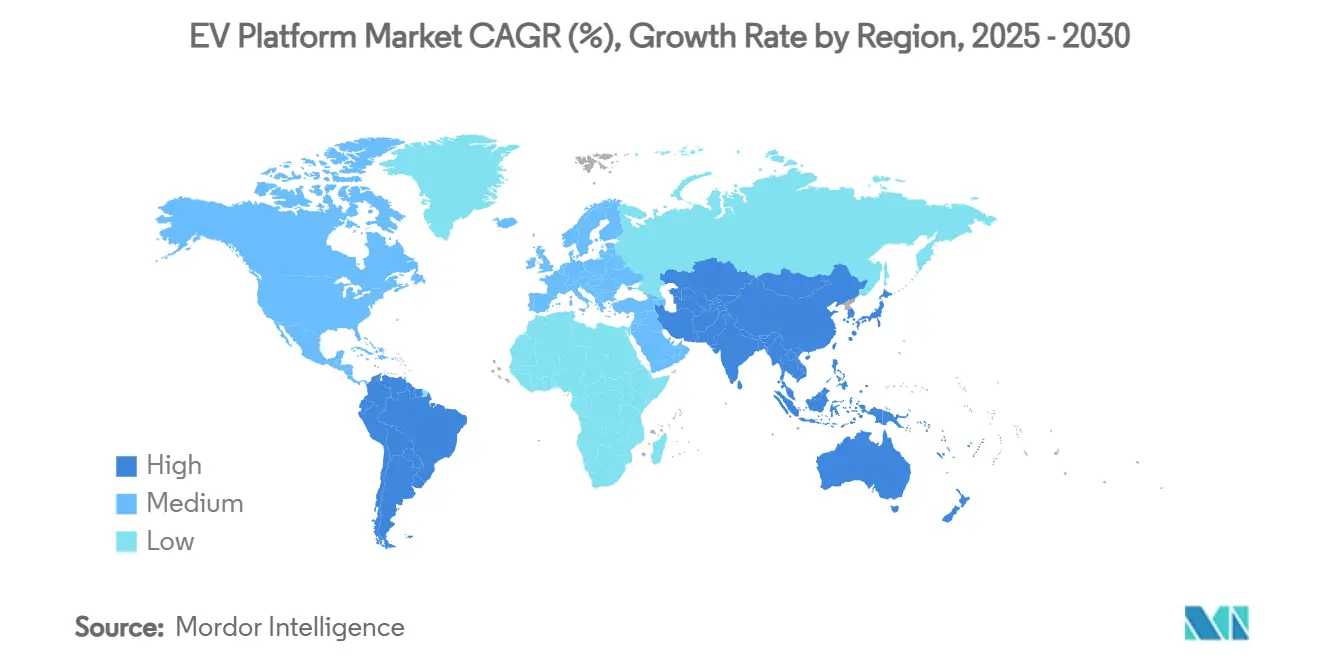
| Fastest Growing Market | South America |
| Largest Market | Asia Pacific |
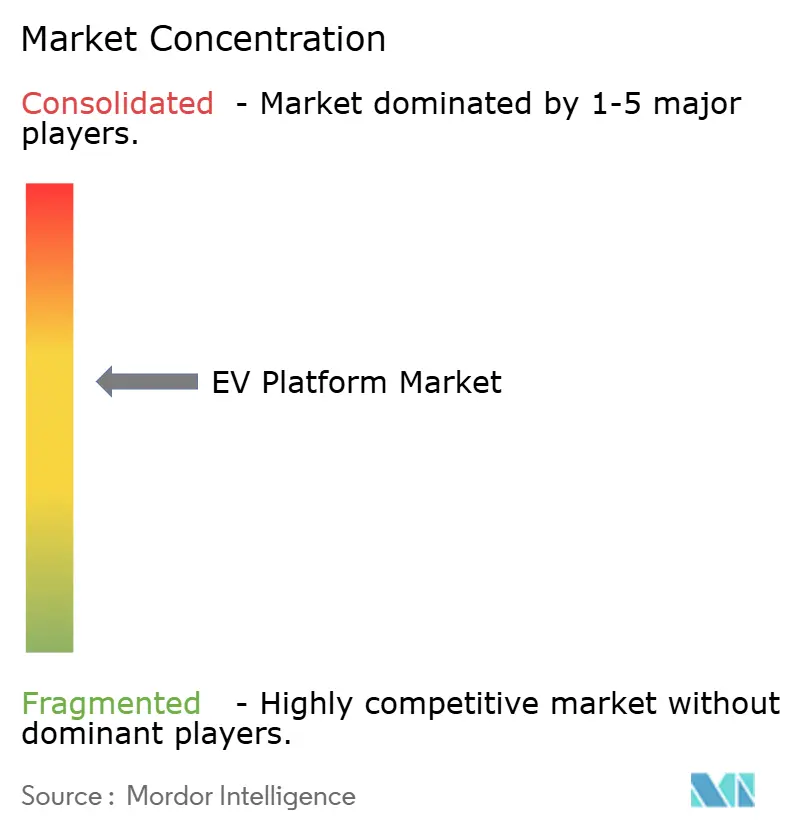
| Market Concentration | Medium |
Major Players *Disclaimer: Major Players sorted in no particular order Image © Mordor Intelligence. Reuse requires attribution under CC BY 4.0. | |
EV Platform Market Analysis by Mordor Intelligence
The EV Platform Market size is estimated at USD 19.86 billion in 2025, and is expected to reach USD 58.26 billion by 2030, at a CAGR of 24.01% during the forecast period (2025-2030). This expansion mirrors a decisive migration toward skateboard-style electric architectures, propelled by sub-USD 80 kWh battery cost visibility, stringent fleet-average CO₂ mandates, and the rise of platform-as-a-service offerings from tier-1 suppliers. Asia-Pacific leads with a 39.16% revenue share in 2024 based on China’s deep supply chain integration and policy incentives. South America registers the quickest uptake as import-tariff schedules in Brazil spur local production. Battery electric vehicles (BEVs) form the core of platform investment strategies thanks to simplified design rules, and silicon-carbide power electronics are widening operating ranges by more than 8%. Commercial fleets, having crossed the total-cost-of-ownership tipping point for light trucks and vans, are accelerating demand for modular, high-payload chassis.
Key Report Takeaways
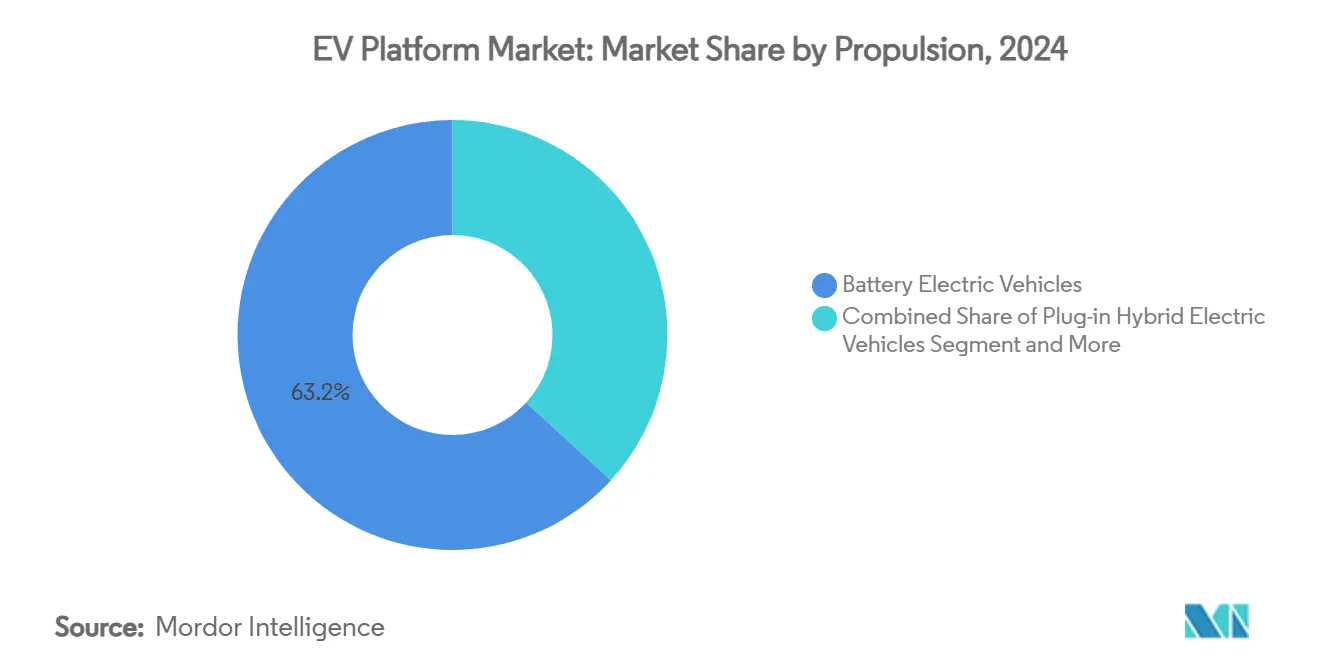
- By propulsion, BEVs accounted for 63.15% of the EV platform market size in 2024 and are projected to expand at a 25.73% CAGR between 2025 and 2030.
- By vehicle type, Passenger Cars held 67.38% of the EV platform market share in 2024, whereas Commercial Vehicles are forecast to grow at a 25.31% CAGR through 2030.
- By component, Batteries captured 38.11% of the EV platform market size in 2024; Motor Systems are set to rise at a 24.95% CAGR to 2030.
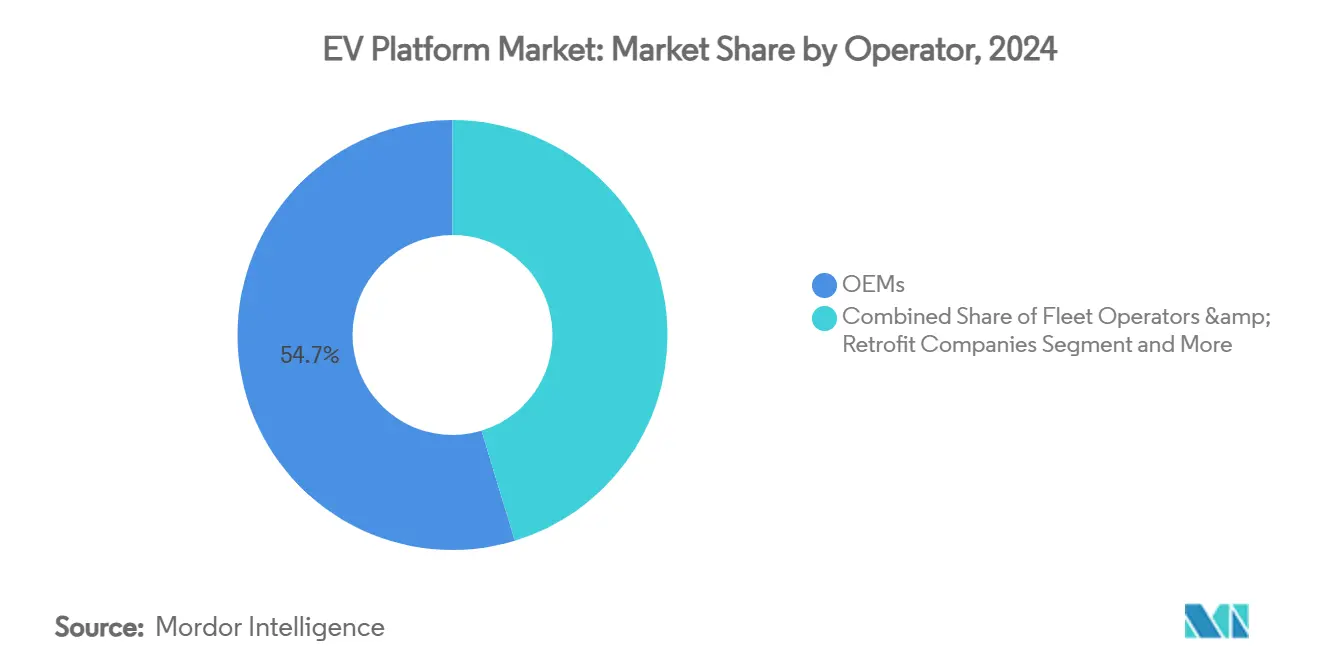
- By operator, OEMs controlled 54.74% of the EV platform market share in 2024, while Fleet Operators and retrofit Companies recorded the highest 25.11% CAGR through 2030.
- By platform type, the Dedicated EV Platform accounted for 63.19% of the EV platform market size in 2024, while the Modular platform is projected to expand at a 24.15% CAGR between 2025 and 2030.
- By geography, Asia-Pacific commanded 39.16% revenue in 2024; South America is poised for the fastest 24.87% CAGR to 2030.
Global EV Platform Market Trends and Insights
Drivers Impact Analysis*
| Driver | (~) % Impact on CAGR Forecast | Geographic Relevance | Impact Timeline |
|---|---|---|---|
| Rapid battery-cost parity | +6.8% | Global, led by China manufacturing scale | Medium term (2-4 years) |
| Global CO₂ fleet-average mandates tightening | +5.1% | Europe, North America, China | Short term (≤ 2 years) |
| Shift to dedicated skateboard architectures | +4.2% | Global, with early adoption in China and Europe | Medium term (2-4 years) |
| Commercial-fleet TCO tipping point | +3.4% | Europe, North America | Short term (≤ 2 years) |
| Tier-1 suppliers offering white-label | +2.8% | Global, concentrated in established automotive hubs | Long term (≥ 4 years) |
| Silicon-carbide inverters boosting range | +1.8% | Global, with premium segment early adoption | Medium term (2-4 years) |
| Source: Mordor Intelligence | |||
Rapid Battery-Cost Parity
CATL and BYD were set to cut battery prices by 50% in 2024, as reported. To reduce costs, CATL is focusing on optimizing resources in its production, utilizing high-nickel chemistries, and attaining efficiencies at a giga-scale. In contrast, Argonne National Laboratory predicts that by 2035, the cost of battery packs for PHEVs and BEVs manufactured in the United States will see a significant decline, driven by advancements in technology, economies of scale, and increased production efficiency. The introduction of larger 46-series cylindrical cells, paired with silicon-rich anodes, boosts energy density. This advancement allows platforms to accommodate more compact packs without compromising their range. As a result, this evolving cost curve shifts the business narrative from mere compliance to a focus on profit margins, validating the use of skateboard tooling across both compact and commercial segments.
Global Carbon Dioxide Mandates
In recent years, countries have intensified efforts to curb carbon dioxide emissions. Echoing this global push, the 'Fit for 55' initiative seeks to bolster CO2 reduction targets for new cars and vans. This move underscores the automotive sector's pivotal role in the EU's climate ambitions and increases innovation within the industry. This measure is a key component of the Fit for 55 package, which comprises a comprehensive set of legislative proposals designed to reduce the EU’s greenhouse gas emissions by at least 55% by 2030. The initiative is expected to deliver multiple benefits, including improved environmental outcomes for citizens, enhanced options for consumers, and strengthened competitiveness for the EU’s automotive industry in the global market. “Euro 6e-bis” testing from January 2025 stretches PHEV drive cycles to 2,200 km, inflating certified emissions and company-car taxes[1]European Commission, “Fit-for-55 Automobile CO₂ Standards,” ec.europa.eu. China’s fleet-average credit scheme and the U.S. Advanced Clean Fleets rule for class 4-8 trucks intensify penalties for ICE residuals, making dedicated BEV platforms the lowest-risk path to regulatory compliance.
Shift to Dedicated Skateboard Architectures
CATL’s Bedrock chassis, unveiled in December 2024, integrates the battery pack within the floorpan, delivers optimized weight distribution, and raises side-impact rigidity, enabling flexible cabin top-hats for hatchbacks, SUVs, or light vans. Hyundai’s E-GMP underpins dual 400 V/800 V charge systems and 310-mile ranges, proving mass-production viability[2]CATL, “Bedrock Chassis Launch Presentation,” catl.com. Such skateboard layouts free interior volume—critical for last-mile delivery vans, where every cubic foot equates to route density advantages. They also simplify global homologation because crash structures are pre-engineered into the base. Joint-venture announcements such as in May 2025, CATL and Changan Mazda Automobile (Changan Mazda) signed a memorandum of understanding (MoU) in Shanghai to jointly develop new energy vehicles (NEVs) using CATL's CIIC (Integrated Intelligent Chassis) and Changan Mazda's manufacturing expertise. The partnership supports Changan Mazda's electrification strategy and sets a benchmark for "technology integration and efficient development.
Commercial-Fleet TCO Advantages
Rabobank shows Dutch electric LCVs deliver the lowest five-year TCO, even before incentives. Fleet studies highlight that reducing moving parts leads to notable CO₂ reductions and maintenance savings. Additionally, these studies emphasize the importance of transitioning to 800 V architectures, which, while beneficial, require significant investment in training and upskilling personnel, adding to operational costs. By 2030, Xcel Energy aims to transition to a fully electric fleet through a phased truck replacement strategy. This move underscores the growing trend of corporations aligning their procurement strategies with sustainability KPIs, reflecting a broader commitment to environmental responsibility.
Restraints Impact Analysis*
| Restraint | (~) % Impact on CAGR Forecast | Geographic Relevance | Impact Timeline |
|---|---|---|---|
| High-voltage wiring thermal-runaway safety | -2.1% | Global, with concentrated impact in premium segments | Short term (≤ 2 years) |
| Chronic 4680-cell yield issues at gigafactories | -1.8% | North America, with supply chain implications globally | Medium term (2-4 years) |
| Scarcity of chassis-grade recycled aluminum | -1.3% | Global, particularly affecting cost-sensitive segments | Long term (≥ 4 years) |
| OEM reluctance to share OTA data | -0.9% | Global, concentrated in traditional automotive markets | Medium term (2-4 years) |
| Source: Mordor Intelligence | |||
High-Voltage Wiring Thermal-Runaway Recalls
Thermal runaway incidents in high-voltage wiring have led to several recalls in recent years. These recalls are primarily driven by safety concerns, as thermal runaway can result in overheating, fires, or other hazardous conditions. Following an investigation by the National Highway Traffic Safety Administration (NHTSA), in February 2025, Samsung SDI recalled 180,000 high-voltage battery packs. These packs were installed in select Chrysler, Volkswagen, Audi, and Ford vehicles across North America, Europe, and Asia. In a global recall, a Swedish manufacturer is pulling back nearly 73,000 plug-in hybrids. The affected vehicles span various series and were distributed worldwide. The issue arises when parked and fully charged; these vehicles risk a short circuit in their high-voltage battery. As a precaution, the manufacturer is advising owners to refrain from charging their vehicles. China now requires a five-minute thermal propagation delay, prompting the use of DuPont Kapton polyimide layers and pressure-relief vents. These design add-ons raise per-vehicle cost but remain mandatory for brand credibility[3]Samsung SDI, “Safety Recall Notice,” sdi.co.kr.
Chronic 4680-Cell Yield Issues
Tesla’s Giga Texas line produces enough 4680 cells for only 1,000 Cybertrucks weekly, limiting roll-outs to Model 3/Y. Panasonic postponed its 4680 ramp to 2H 2024, citing cathode dry-coat defects even though the format promises 18% cost savings. Until yields stabilize, platform planners hedge by dual-sourcing prismatic or pouch cells, adding complexity to battery bay mounting geometries.
*Our forecasts treat driver/restraint impacts as directional, not additive. The impact forecasts reflect baseline growth, mix effects, and variable interactions.
Segment Analysis
By Propulsion: BEVs Anchor Scale Advantages
The EV platform market size for BEVs stood at 63.15% revenue share in 2024 and is projected to progress at 25.73% CAGR. BEV-only skateboard layouts streamline crash structures, wiring looms, and cooling circuits relative to PHEV bi-modal systems, trimming bill-of-materials and plant takt times. The International Energy Agency notes 17 million global electric car sales in 2024, with China contributing nearly half, fueling automotive economies of scale. Euro 6e-bis erodes PHEV tax benefits and lengthens homologation loops, steering OEM R&D spend toward BEV-centric toolkits. Foxconn’s MIH consortium attracts mid-tier brands seeking pre-validated BEV frames rather than investing in bespoke PHEV underbodies.
PHEVs remain attractive in areas with limited charging stations, and regulators view them as compliance buffers alongside BEVs until fast-charging networks become widespread. Yet the dual-powertrain complexity adds 150-200 kg mass and trims cargo volume, a disadvantage for urban couriers. As battery-cost parity arrives, platform roadmaps increasingly bifurcate: BEV skateboard for mainstream, range-extender micro-platforms for niche rural duty cycles.


By Vehicle Type: Commercial Fleets Outpace Passenger Adoption
Passenger Cars represented 67.38% of EV platform market share in 2024, reflecting sustained consumer EV appetite. Sedan and SUV derivatives leverage shared floor-stamping kits and standardized battery enclosures to lower variant costs.
Nevertheless, Commercial Vehicles headline growth with a 25.31% CAGR thanks to depot charging and predictable route profiles. Electric buses profit from high-duty cycles; ABB’s three-level inverter cuts harmonic loss by 75%, enabling more miniature battery packs per route. Delivery van OEMs optimize wheelbase length and low-floor ingress for parcel density, rather than legacy passenger ergonomics. Municipal zero-emission zones and e-commerce timeliness further spin this adoption flywheel.
By Component: SiC Drives Motor System Upswing
Batteries held 38.11% of EV platform market revenue in 2024, yet they will shrink proportionally as the cost per kWh dips. Motor Systems is expected to achieve the highest CAGR at 24.95% due to silicon-carbide inverters, which raise inverter efficiency from 96% to 99.5% and extend the range by 8-10%.
Additionally, the growing demand for electric vehicles (EVs) is driving the need for efficient and reliable power electronics. Silicon carbide (SiC) technology is essential for making EVs more affordable and powerful, supporting the shift to electric mobility (e-mobility). SiC improves energy efficiency and thermal management, enabling faster charging and compact, cost-effective EV designs with longer ranges. Its unique properties, like a wider bandgap, allow it to handle high voltages and power loads, while high thermal conductivity makes it heat-resistant and ideal for high-temperature applications.
By Operator: Fleet & Retrofit Services Flourish
OEMs safeguarded 54.74% operator revenue in 2024, yet the fastest-growing cohort is Fleet Operators & Retrofit Companies at 25.11% CAGR. Uber pre-ordered 100,000 BYD sedans and bundled service contracts, while Lucid-Nuro robotaxi programs blend luxury interiors with Level 4 self-driving pods.
Retrofitters electrify diesel box trucks using standardized battery tunnels and drop-in e-axles, monetizing city low-emission zones. Magna’s multi-OEM contract plants de-risk volume swings for start-ups, and GM’s SDVerse marketplace with Wipro enables over-the-air service upsells across mixed brand fleets.
By Platform Type: Modular Tooling Unlocks Portfolio Breadth
Dedicated EV platforms accounted for 63.19% revenue in 2024: Tesla’s skateboard, Hyundai’s E-GMP, and BYD’s e-Platform 3.0 exemplify clean-sheet designs. Yet Modular Platforms, growing 24.15% CAGR, allow a single crash-certified lower body to spawn hatchbacks, coupes, or cab-over vans through wheelbase spacers and battery pack length inserts.
Foxconn’s open MIH frame showcases “function-as-a-product,” decoupling software feature sets from hardware cycles. Flexible Platforms, still ICE-compatible, linger mainly for emerging-market facelifts; their growth lags as dual-homologation costs outstrip incremental revenue.
Geography Analysis
Asia-Pacific retained 39.16% market share in 2024, with China shipping 4.27 million EVs versus Tesla’s 1.79 million global tally. CATL’s Bedrock chassis and local 800 V supply chains compress BOM costs and enable sub-USD 25,000 compact crossovers. Japan and South Korea contribute software-defined vehicle (SDV) middleware; Nissan-Honda joint SDV stacks target 2026 launches. India’s FAME-III incentives and Southeast Asia’s 16-39% CAGR outlook enlarge regional addressable volume.
South America tops the growth ranking at 24.87% CAGR. Brazil’s plug-in sales grew 90% to 177,360 units in 2024, propelled by zero-tariff battery imports until late 2025 and rising gasoline prices. Uruguay’s 5,950-unit EV fleet leads per-capita penetration, and South America now hosts more than 4,000 public chargers that underpin fleet electrification economics.
Europe commands volume through Euro 6e-bis compliance and well-established giga-factories, while North America rides domestic manufacturing tax credits and the U.S. Clean Fleets rule. The Middle East and Africa, led by UAE Euro 6b adoption, open white-space opportunities for kit-form EV platforms shipped CKD. Regional uptake hinges on charger density, renewable grid shares, and local content rules that shape unit economics.

Competitive Landscape
Market concentration is moderate as OEM incumbents share the stage with contract manufacturers and tech disruptors. Tesla’s early skateboard edge confronts BYD’s million-unit volume and vertically integrated battery supply. Volkswagen’s USD 5 billion stake in Rivian signals legacy players buying into software-first platforms. Magna supplies underbodies for Fisker and Mercedes EQ models, demonstrating the “build-for-hire” trajectory. Foxconn leverages smartphone scale to offer open EV frames, courting tier-2 brands that lack clean-sheet capital.
Start-ups chase niche payloads—Arrival in last-mile vans and Volta in distribution trucks—but many pivot to licensing intellectual property or pairing with contract assemblers when capex funding tightens. Software-defined features such as battery pre-conditioning or torque-vectoring get monetized post-sale, further unsettling hardware-only profit models.
Safety recalls on thermal-runaway incidents make cell-to-pack engineering prowess a reputational differentiator. In aggregate, the winners fuse battery chemistry know-how, gigafactory scale, and over-the-air software road maps that stretch profit capture beyond initial vehicle sale.
EV Platform Industry Leaders
Volkswagen Group
Tesla
BYD Auto
SAIC Motor
Hyundai Motor Group
- *Disclaimer: Major Players sorted in no particular order

Recent Industry Developments
- June 2025: Mahindra & Mahindra plans to launch a new multi-energy vehicle platform, likely called ‘Nu,’ in August 2025. This platform will support internal combustion, hybrid, and electric vehicles.
- May 2025: CATL partnered with Changan Mazda to co-develop BEVs on the CATL Bedrock chassis, broadening platform-as-a-service penetration.
- January 2024: Tata Motors unveiled its latest platform, Acti.ev, dedicated to electric mobility. This innovative platform heralds the beginning of Tata Motors' journey into the realm of fully electric vehicles. The platform's 'skateboard' architecture made its debut with the Punch.ev, subsequently adopted by other models, including the electric versions of Tata Motors' Curvv, Sierra, and Harrier.
- January 2024: Stellantis N.V. has introduced STLA Large, a versatile, all-electric platform designed for various vehicles targeting global D and E segments.


Global EV Platform Market Report Scope
| Battery Electric Vehicles (BEVs) |
| Plug-in Hybrid Electric Vehicles (PHEVs) |
| Electric Vehicles (HEVs) |
| Fuel Cell Electric Vehicle (FCEVs) |
| Passenger Car | Hatchbacks |
| Sedans | |
| Utility Vehicles (SUVs/MUVs) | |
| Commercial Vehicle | Electric Trucks |
| Electric Buses | |
| Electric Vans / Pickup Trucks |
| Suspension Systems |
| Steering Systems |
| Motor Systems |
| Batteries |
| Brake Systems |
| Chassis |
| Other Component |
| OEMs |
| Contract Manufacturers / Integrators |
| Start-ups / Technology Developers |
| Fleet Operators & Retrofit Companies |
| Others |
| Dedicated EV Platform |
| Flexible Platform |
| Modular Platform |
| North America | United States |
| Canada | |
| Rest of North America | |
| South America | Brazil |
| Argentina | |
| Rest of South America | |
| Europe | Germany |
| United Kingdom | |
| France | |
| Russia | |
| Rest of Europe | |
| Asia-Pacific | China |
| Japan | |
| India | |
| South Korea | |
| Rest of Asia-Pacific | |
| Middle East and Africa | United Arab Emirates |
| Saudi Arabia | |
| South Africa | |
| Rest of Middle East and Africa |
| By Propulsion | Battery Electric Vehicles (BEVs) | |
| Plug-in Hybrid Electric Vehicles (PHEVs) | ||
| Electric Vehicles (HEVs) | ||
| Fuel Cell Electric Vehicle (FCEVs) | ||
| By Vehicle Type | Passenger Car | Hatchbacks |
| Sedans | ||
| Utility Vehicles (SUVs/MUVs) | ||
| Commercial Vehicle | Electric Trucks | |
| Electric Buses | ||
| Electric Vans / Pickup Trucks | ||
| By Component | Suspension Systems | |
| Steering Systems | ||
| Motor Systems | ||
| Batteries | ||
| Brake Systems | ||
| Chassis | ||
| Other Component | ||
| By Operator | OEMs | |
| Contract Manufacturers / Integrators | ||
| Start-ups / Technology Developers | ||
| Fleet Operators & Retrofit Companies | ||
| Others | ||
| By Platform Type | Dedicated EV Platform | |
| Flexible Platform | ||
| Modular Platform | ||
| By Geography | North America | United States |
| Canada | ||
| Rest of North America | ||
| South America | Brazil | |
| Argentina | ||
| Rest of South America | ||
| Europe | Germany | |
| United Kingdom | ||
| France | ||
| Russia | ||
| Rest of Europe | ||
| Asia-Pacific | China | |
| Japan | ||
| India | ||
| South Korea | ||
| Rest of Asia-Pacific | ||
| Middle East and Africa | United Arab Emirates | |
| Saudi Arabia | ||
| South Africa | ||
| Rest of Middle East and Africa | ||


Key Questions Answered in the Report
What is the current market size of the EV platform market?
The EV platform market size reached USD 19.86 billion in 2025.
How fast is the EV platform market expected to grow?
It is forecast to expand at a 24.01% CAGR, hitting USD 58.26 billion by 2030.
Which region dominates EV platform revenues?
Asia-Pacific leads with 39.16% market share, driven chiefly by China’s integrated supply chain.
Why are commercial vehicles the fastest-growing application?
Fleet operators now realize a lower total cost of ownership for electric light trucks and vans, pushing a 25.31% CAGR for commercial vehicle platforms.
What technology trend is lifting motor system demand?
Silicon-carbide inverters deliver up to 8% range gains and 99.5% efficiency, underpinning a 24.95% CAGR for motor systems.
Who are the key players shaping future platform standards?
BYD, Tesla, CATL, Foxconn’s MIH consortium, Magna, and Rivian-Volkswagen collaborations are chief influencers through scale, battery integration, and software-defined capabilities.
Page last updated on:


