EV Charging Connector Market Size and Share
Market Overview
| Study Period | 2019 - 2030 |
|---|---|
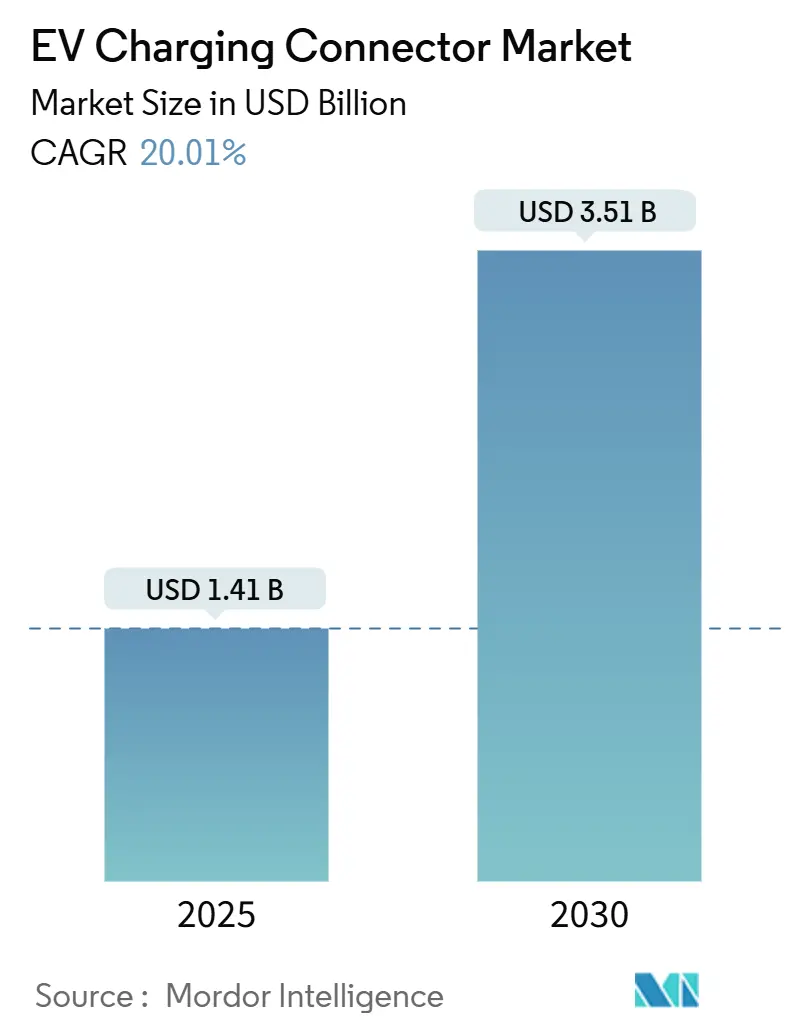
| Market Size (2025) | USD 1.41 Billion |
| Market Size (2030) | USD 3.51 Billion |
| Growth Rate (2025 - 2030) | 20.01% CAGR |
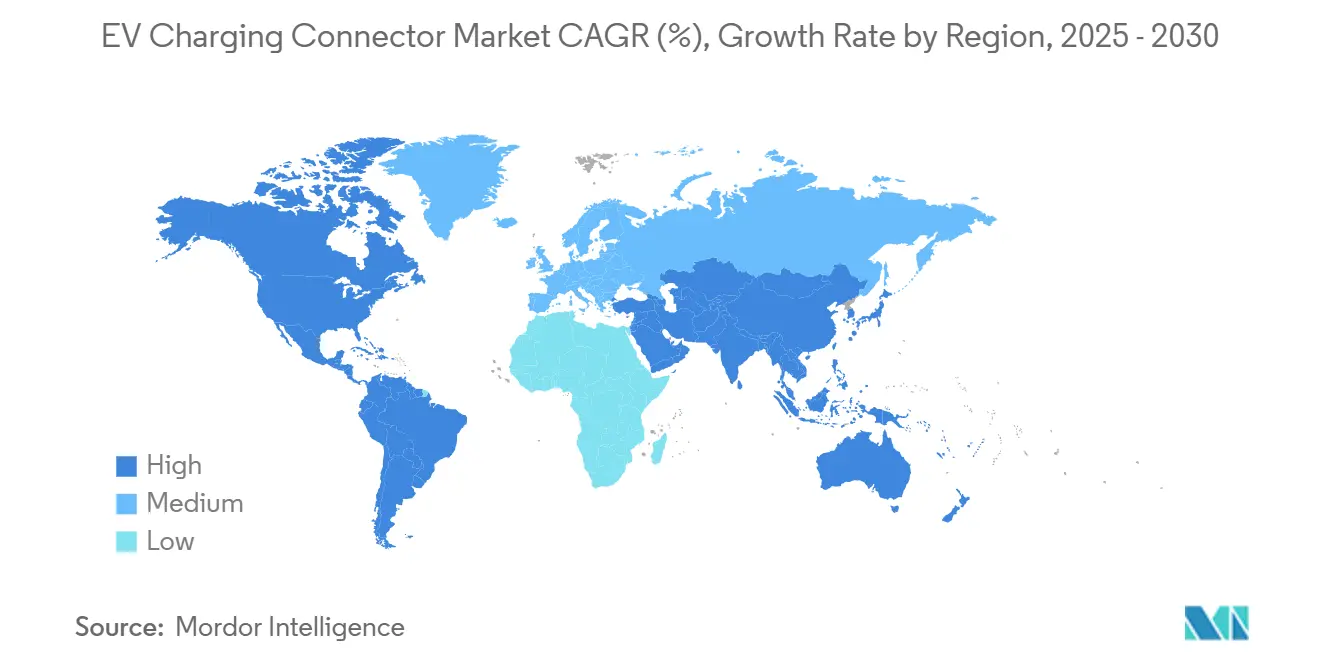
| Fastest Growing Market | North America |
| Largest Market | Asia Pacific |
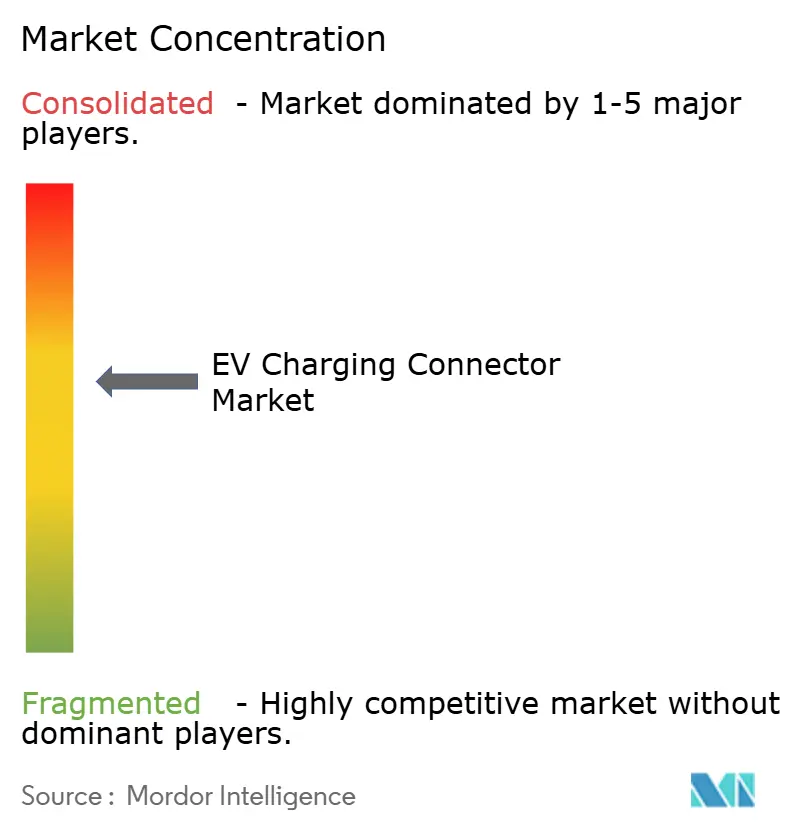
| Market Concentration | Medium |
Major Players *Disclaimer: Major Players sorted in no particular order Image © Mordor Intelligence. Reuse requires attribution under CC BY 4.0. | |
EV Charging Connector Market Analysis by Mordor Intelligence
The EV charging connector market size is USD 1.41 billion in 2025 and is forecast to expand at a 20.01% CAGR to USD 3.51 billion by 2030, underscoring the accelerating shift toward electrified mobility systems. Standardization efforts, especially the rapid embrace of Tesla’s NACS (now SAE J3400), are stimulating retrofit demand while simultaneously guiding new-build specifications across North America. Heightened regulatory support, expanding public funding pools, and visible infrastructure pipelines are creating a supply-constrained environment in which connector manufacturers with scalable production footprints gain pricing power. Parallel advances in high-voltage battery packs, thermal interface materials, and embedded diagnostics are raising performance baselines, intensifying competition around reliability and ease of integration. Market participants that pair hardware efficiency with data-driven software services are capturing a disproportionate share of enterprise purchasing budgets, suggesting a gradual decoupling between commodity hardware margins and premium software recurring revenues.
Key Report Takeaways
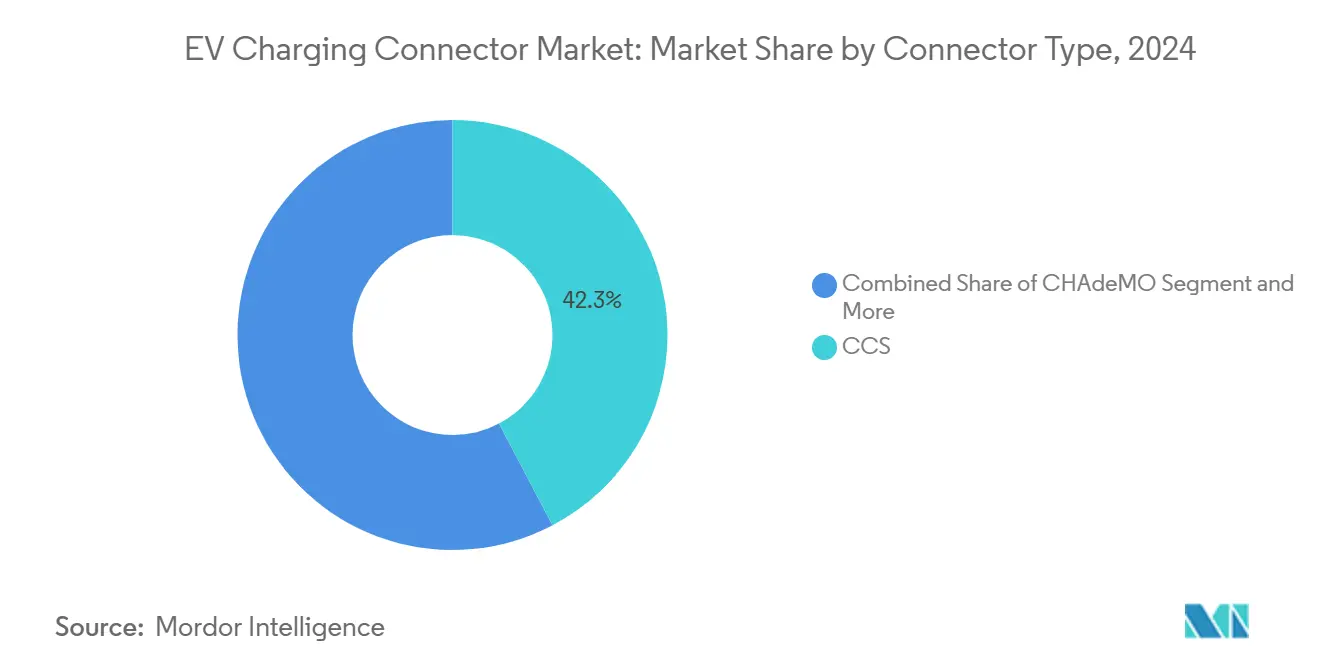
- By connector type, CCS held 42.25% of the EV charging connector market share in 2024; Tesla/NACS is projected to climb at a 22.06% CAGR through 2030.
- By charging speed, fast connectors delivering above 22 kW accounted for 67.11% of the EV charging connector market share in 2024 and are advancing at a 23.11% CAGR between 2025-2030.
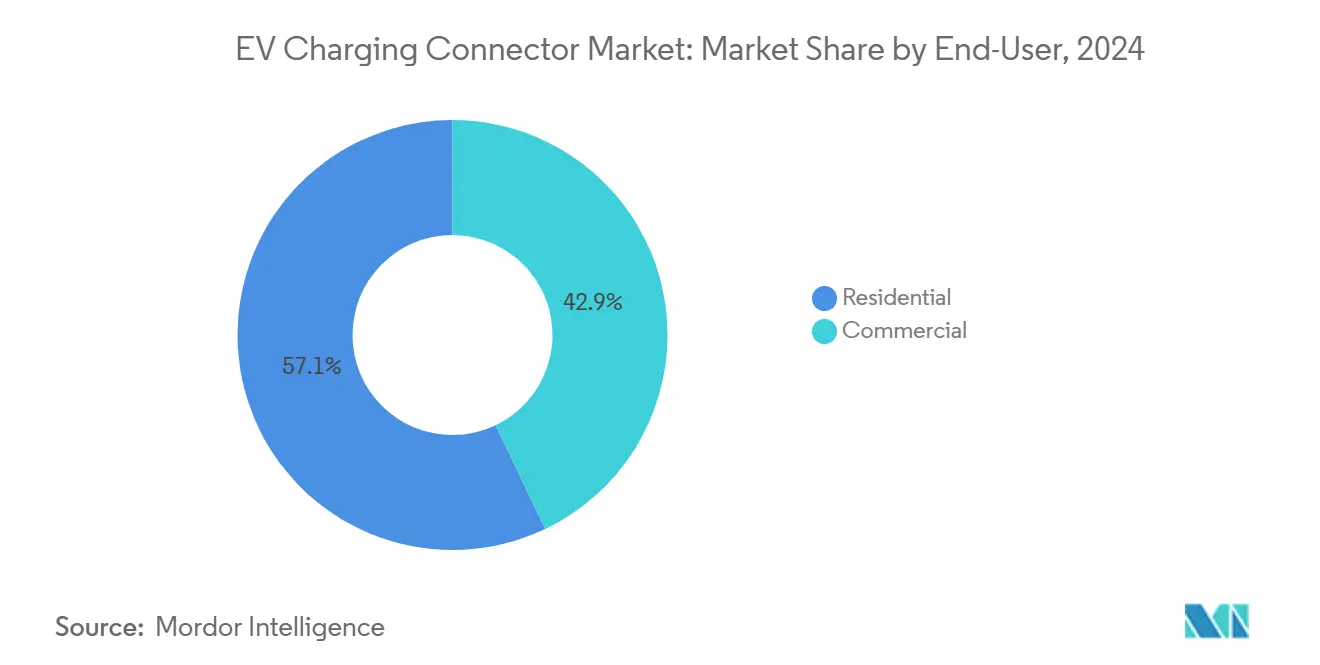
- By end-user, residential installations comprised 57.05% of the EV charging connector market share in 2024, while commercial deployments are scaling fastest with a 23.74% CAGR to 2030.
- By vehicle class, passenger cars held 63.55% of the EV charging connector market share in 2024, while heavy-duty vehicles and buses are expanding at a 20.68% CAGR between 2025-2030.
- By geography, Asia-Pacific held 49.14% of the EV charging connector market share in 2024, while North America is expanding at a 21.54% CAGR.
Global EV Charging Connector Market Trends and Insights
Drivers Impact Analysis*
| Driver | (~) % Impact on CAGR Forecast | Geographic Relevance | Impact Timeline |
|---|---|---|---|
| North American OEM Shift to NACS/SAE J3400 | +5.1% | North America | Short term (≤2 years) |
| Government Incentives for Charging Infrastructure | +4.2% | North America; Europe | Medium term (2-4 years) |
| Mandated Phase-out of Legacy Connectors | +3.8% | Europe; North America | Short term (≤2 years) |
| Megawatt Charging for Heavy Fleets | +3.4% | Europe; North America | Long term (≥4 years) |
| Home Solar with V2G Integration | +2.1% | North America; Europe | Medium term (2-4 years) |
| AI-Enabled Predictive Maintenance | +1.4% | Global | Long term (≥4 years) |
| Source: Mordor Intelligence | |||
Transition of North-American OEMs to NACS / SAE J3400 Drives Retrofit Demand
Ford, GM, Rivian, Volvo, and multiple light truck brands committed to NACS for 2025 model launches, effectively doubling the number of makes served by Tesla-style pins. ChargePoint’s Omni Port auto-detects vehicle requirements and switches between CCS and NACS, illustrating how retrofit-focused SKUs can command premium pricing during transition windows [1]“Omni Port Product Sheet,” ChargePoint Holdings, chargepoint.com. Station operators view dual connectors as hedge instruments against uncertain fleet mixes, creating near-term spikes in adapter and cable replacements even for otherwise fully amortized assets.
Government Incentives for Standardized Fast-Charging Infrastructure
Programmatic funding is realigning capital flows toward connectors that meet interoperability thresholds. The United States NEVI program requires stations to support CCS, mobilizing USD 5 billion of grants that prioritize dual-standard designs [2]“NEVI Formula Program Guidance,” U.S. Department of Transportation, transportation.gov. Europe’s AFIR mandates 150 kW minimums at highway corridors, implicitly phasing out sub-100 kW connectors and accelerating demand for high-current assemblies. Manufacturers able to validate conforming products before 2026 stand to lock in volume contracts as public tenders favor “ready-on-arrival” solutions. Fiscal incentives lower payback periods for operators, translating regulatory mandates directly into order books for compliant connector vendors.
Mandated Phase-Out of Legacy Connectors in Key Markets
European CCS Combo 2 requirements enacted after November 2017 reduced CHAdeMO’s share from early 2024 from the base 2019. Japan’s approval of 1000 V CHAdeMO extensions signals that only voltage-capable designs will qualify for subsidies, prompting network owners to pre-emptively replace sub-400 V heads. These scheduled obsolescence cycles create a predictably front-loaded order pattern that connector makers can synchronize with tool-up investments, compressing product life cycles yet widening margins on next-generation units.
Rise of Megawatt Charging for Heavy-Duty Fleets
Prototype demonstrations from ABB and MAN verified 1,000 A delivery for above 700 kW sessions, paving the way for the CharIN MCS launch and SAE J3271 guidance [3]“ABB Tests 1,000 A MCS Prototype,” ABB Group, new.abb.com. Fleet economics favor higher capital outlays if session time falls below mandatory driver rest periods, driving interest in depot-scale megawatt clusters. Thermal runaway containment, liquid-cooled pins, and robotic positioning mounts are emerging as differentiators in bid solicitations issued by logistics majors.
Restraints Impact Analysis*
| Restraint | (~) % Impact on CAGR Forecast | Geographic Relevance | Impact Timeline |
|---|---|---|---|
| Regional Connector Fragmentation Inflates Costs | -2.8% | Global | Short term (≤2 years) |
| Copper and Critical-Metal Price Volatility | -1.9% | Global | Medium term (2-4 years) |
| Thermal-Runaway Incidents at Ultra-Fast Chargers | -1.4% | Europe; North America | Medium term (2-4 years) |
| Obsolescence from Emerging Wireless Standards | -0.7% | Premium segments | Long term (≥4 years) |
| Source: Mordor Intelligence | |||
Regional Connector Fragmentation Inflates Inventory Costs
Operators serving multiple continents must stock CCS, CHAdeMO, GB/T, and now NACS, increasing working capital significantly versus single-standard deployments. Warehouse complexity spills into field service, where technicians carry separate toolkits and firmware images, extending mean-time-to-repair. Consolidation around universal heads would unlock scale efficiencies, but remains constrained by entrenched regional fleets and regulatory path dependency.
Copper and Critical-Metal Price Volatility
Spot copper prices swung between Q2 2023 and Q2 2024, adding a significant amount to the bill of materials for a 250 kW liquid-cooled connector. Megawatt heads can contain 3-5 times the copper, magnifying exposure. Manufacturers hedge by forward-buying cathode contracts and experimenting with aluminum alloys, though certification timelines delay mass substitution.
*Our forecasts treat driver/restraint impacts as directional, not additive. The impact forecasts reflect baseline growth, mix effects, and variable interactions.
Segment Analysis
By Connector Type: NACS Disrupts CCS Dominance
CCS owned a 42.25% of the EV charging connector market share in 2024 thanks to legacy European mandates and non-Tesla U.S. adoption, while NACS is forecast to register a 22.06% CAGR to 2030. Dual-head dispensers temporarily inflate the EV charging connector market size as operators retrofit existing stalls with NACS cables, yet retain CCS leads for legacy vehicles. CHAdeMO’s footprint is contracting outside Japan, though its innate bidirectional capability supports V2G pilots that niche utilities favor. GB/T remains entrenched in China’s domestic fleet but sees limited export applicability, prompting Chinese OEMs to bundle adapter pigtails for overseas deliveries. Strategic advantage is shifting toward suppliers able to integrate auto-locking collars, liquid-cooling, and ISO 15118 handshake firmware into compact NACS housings without breaching patent fences.
Second-order effects ripple into downstream electronics, as NACS’s DC-only pinout simplifies onboard charger architecture, reducing BOM cost for OEMs and raising switching barriers back to CCS. Conversely, European fleets retain CCS because Combo 2’s AC-DC hybrid suits apartment dwellers lacking dedicated home plugs. Regional divergence, therefore, persists even as global Tier-1 suppliers streamline tooling around two dominant geometries, narrowing sourcing complexity and underwriting investment in robotic crimping lines.


By Charging Speed: Ultra-Fast Charging Reshapes Infrastructure Economics
Fast heads rated above 22 kW captured 67.11% of the EV charging connector market share in 2024 and will compound at 23.11% to 2030, outstripping residential-grade plugs whose share falls as hardware amortization favors higher-turn locations. The EV charging connector market share for ultra-fast systems grows further when factoring in megawatt pilots scheduled to be commercialized in the coming years. High-voltage battery packs let vehicles absorb 250-350 kW for sustained intervals, making thermal rejection the design bottleneck; suppliers differentiate through dielectric coolants circulating within cable jackets that maintain grip comfort below 50 °C.
Slow connectors remain viable where dwell time is inherent overnight hotel lots, airport long-stay facilities, suburban garages—but their growth rate trails because per-stall revenue stays flat while permitting and grid upgrade costs drift higher. Europe’s AFIR 150 kW minimum at highway corridors accelerates the scrappage of sub-50 kW heads, generating replacement waves that lift the EV charging connector market size in mature regions even as new-installation counts plateau.
By End-User: Commercial Adoption Accelerates Despite Residential Dominance
Residential settings held 57.05% of the EV charging connector market share in 2024; however, commercial venues workplaces, retail, fleet depots will grow 23.74% annually to 2030. Employers installing Level 2 clusters observe employee session counts rising faster than stall additions, validating investment in higher-power cords that rotate vehicles every four hours rather than eight. Charging-as-a-service contracts, wherein operators absorb capex and recoup through usage fees, are proliferating, enabling property owners to skirt technical upkeep.
Software sophistication, from access control integrations to dynamic tariff engines, plays a bigger role in commercial sites where utilization is meter-tracked for ESG reporting. Connector makers embedding NFC readers and over-the-air firmware update paths tap recurring licensing revenues. The resulting stickiness curbs commoditization and sustains double-digit gross margins despite rising copper costs.
By Vehicle Type: Heavy-Duty Electrification Drives Connector Innovation
Passenger cars represented 63.55% of the EV charging connector market share in 2024, yet heavy-duty trucks and buses expanded 20.68% annually, catalyzing entirely new connector classes. The Megawatt Charging System (MCS) unveiled by CharIN supports 3.75 MW peaks, necessitating liquid-cooled pins and automated alignment arms to mitigate ergonomic loads. Early depot rollouts by logistics carriers show dwell times falling to sub-15 minutes for 80% state-of-charge, reshaping scheduling models and elevating connector reliability as a mission-critical parameter.
Light commercial vans bridge consumer and freight use-cases, adopting CCS/NACS heads but cycling through 3-6 sessions daily, pressing wear life beyond passenger norms. Two- and three-wheelers in Asia rely on low-power proprietary plugs; nonetheless, modular battery swaps reduce direct connector demand, implying slower growth in that micro-mobility niche.
Geography Analysis
Asia-Pacific commanded 49.14% of the EV charging connector market share in 2024 since China alone hosts nearly two-thirds of installed public charge points. The EV charging connector market size there scales with domestic EV production and exports, incentivizing local suppliers like Sinexcel and Star Charge to pursue GB/T 2025 revisions that raise maximum current to 600 A. Adoption of liquid-cooled couplers remains limited but is accelerating along the Yangtze Delta freight corridor, where electric heavy trucks enter service.
North America is the fastest-growing arena at 21.54% CAGR, thanks to the NEVI funding stream and universal pivot to NACS. Retrofit campaigns see station operators doubling dispenser count without acquiring new real estate by swapping CCS heads for dual leads, thereby lifting top-line growth in the EV charging connector market without proportional capex expansion. Extreme temperature swings across Canadian provinces elevate demand for elastomer seals, creating niche opportunities for specialty material vendors.
Europe blends regulatory certainty with competitive supplier diversity. AFIR dictates power thresholds and connector geometry, fostering purchaser confidence that assets will remain compliant for at least one refresh cycle. German autobahn concessions bundle charging into toll contracts, producing predictable throughput volumes that underpin annuity-style revenue models for connector maintenance providers.
The Middle East and Africa trail on total unit count but show strong policy momentum. The UAE’s Dubai Electricity and Water Authority (DEWA) outlines 1,000-plus charge points by 2025 using Type 2 AC and CCS DC, while Saudi Arabia’s SEVCIDI roadmap earmarks industrial city depots for megawatt pilots. Mexico City and São Paulo authorities are offering tax breaks for curbside chargers tied to renewable energy credits. Limited feeder-line capacity curtails 350 kW rollouts, steering near-term growth toward 50-150 kW heads, although fleet operators in Chile’s mining belt pilot MCS units for haul trucks that shuttle copper ore to coastal ports.

Competitive Landscape
Competition sits at a midpoint between fragmentation and consolidation. The top five suppliers, including Tesla, ABB, ChargePoint, Siemens, and Yazaki, capture a significant market revenue. Vertically integrated automakers such as Tesla deploy proprietary heads to lock in customer ecosystems and monetize roaming fees from rival brands. Traditional electrical giants, ABB and Siemens, leverage power-conversion expertise to bundle dispensers with grid interface cabinets, raising switching costs for infrastructure owners.
Platform-centric networks ChargePoint, EVgo, and Shell Recharge prioritize software services (load balancing, predictive diagnostics) and treat connectors as interchangeable SKUs. They increasingly source liquid-cooled leads from third-party specialists while maintaining firmware authority. Meanwhile, Asian contract manufacturers expand ODM lines, accelerating commoditization at the low-end but struggling to certify 500 A liquid-cooled assemblies for Western markets due to differing UL versus IEC pathways.
Strategic moves illustrate diverging bets. ChargePoint launched Omni Port, a universal head to simplify inventory for multi-standard sites. Enphase added NACS cables to IQ home chargers, bundling solar inverters to cross-sell energy services. Stellantis announced SAE J3400 adoption for 2026 North American models, with adapter giveaways to bridge CCS fleets. These maneuvers signal that standards, politics, manufacturing scale, and software tie-ins will co-determine margin prospects through the forecast horizon.
EV Charging Connector Industry Leaders
ABB Ltd.
Tesla Inc.
Siemens AG
ChargePoint Holdings, Inc.
Yazaki Corporation
- *Disclaimer: Major Players sorted in no particular order

Recent Industry Developments
- August 2025: ChargePoint unveiled Omni Port, merging NACS and CCS pins into a single nose-cone for easy retrofits.
- November 2024: EVject introduced an updated breakaway connector that lets drivers disengage mid-charge without leaving the vehicle, addressing personal-safety concerns at night.
- August 2024: Enphase released NACS-equipped IQ chargers across North America for expanded vehicle compatibility.
- February 2024: Stellantis confirmed future North American BEVs will ship with SAE J3400 ports and supply CCS adapters during the transition.


Global EV Charging Connector Market Report Scope
| CCS |
| CHAdeMO |
| GB/T |
| Tesla / NACS |
| Slow (Below 22 kW) |
| Fast (Above 22 kW) |
| Residential |
| Commercial |
| Passenger Cars |
| Light Commercial Vehicles |
| Heavy-Duty Vehicles and Buses |
| Two / Three-Wheelers |
| Off-Highway EVs |
| North America | United States |
| Canada | |
| Rest of North America | |
| South America | Brazil |
| Argentina | |
| Rest of South America | |
| Europe | United Kingdom |
| Germany | |
| Spain | |
| Italy | |
| France | |
| Russia | |
| Rest of Europe | |
| Asia-Pacific | India |
| China | |
| Japan | |
| South Korea | |
| Rest of Asia-Pacific | |
| Middle East and Africa | United Arab Emirates |
| Saudi Arabia | |
| Turkey | |
| Egypt | |
| South Africa | |
| Rest of Middle East and Africa |
| By Connector Type | CCS | |
| CHAdeMO | ||
| GB/T | ||
| Tesla / NACS | ||
| By Charging Speed | Slow (Below 22 kW) | |
| Fast (Above 22 kW) | ||
| By End-User | Residential | |
| Commercial | ||
| By Vehicle Type | Passenger Cars | |
| Light Commercial Vehicles | ||
| Heavy-Duty Vehicles and Buses | ||
| Two / Three-Wheelers | ||
| Off-Highway EVs | ||
| By Geography | North America | United States |
| Canada | ||
| Rest of North America | ||
| South America | Brazil | |
| Argentina | ||
| Rest of South America | ||
| Europe | United Kingdom | |
| Germany | ||
| Spain | ||
| Italy | ||
| France | ||
| Russia | ||
| Rest of Europe | ||
| Asia-Pacific | India | |
| China | ||
| Japan | ||
| South Korea | ||
| Rest of Asia-Pacific | ||
| Middle East and Africa | United Arab Emirates | |
| Saudi Arabia | ||
| Turkey | ||
| Egypt | ||
| South Africa | ||
| Rest of Middle East and Africa | ||


Key Questions Answered in the Report
How large is the EV charging connector market in 2025?
The market stands at USD 1.41 billion in 2025 and is on track to reach USD 3.51 billion by 2030.
Which connector type is growing fastest?
Tesla’s NACS (SAE J3400) is the fastest-expanding category, registering a projected 22.06% CAGR through 2030.
Why is North America the fastest-growing region?
Federal NEVI funds, widespread OEM shifts to NACS, and aggressive private network expansion propel North America’s 21.54% CAGR.
Do residential or commercial sites account for more revenue?
Residential remains larger at 57.05% of 2024 turnover, but commercial installations are expanding more rapidly at 23.74% CAGR.
Page last updated on:


