EV Charging Cable Market Size and Share
Market Overview
| Study Period | 2019 - 2030 |
|---|---|
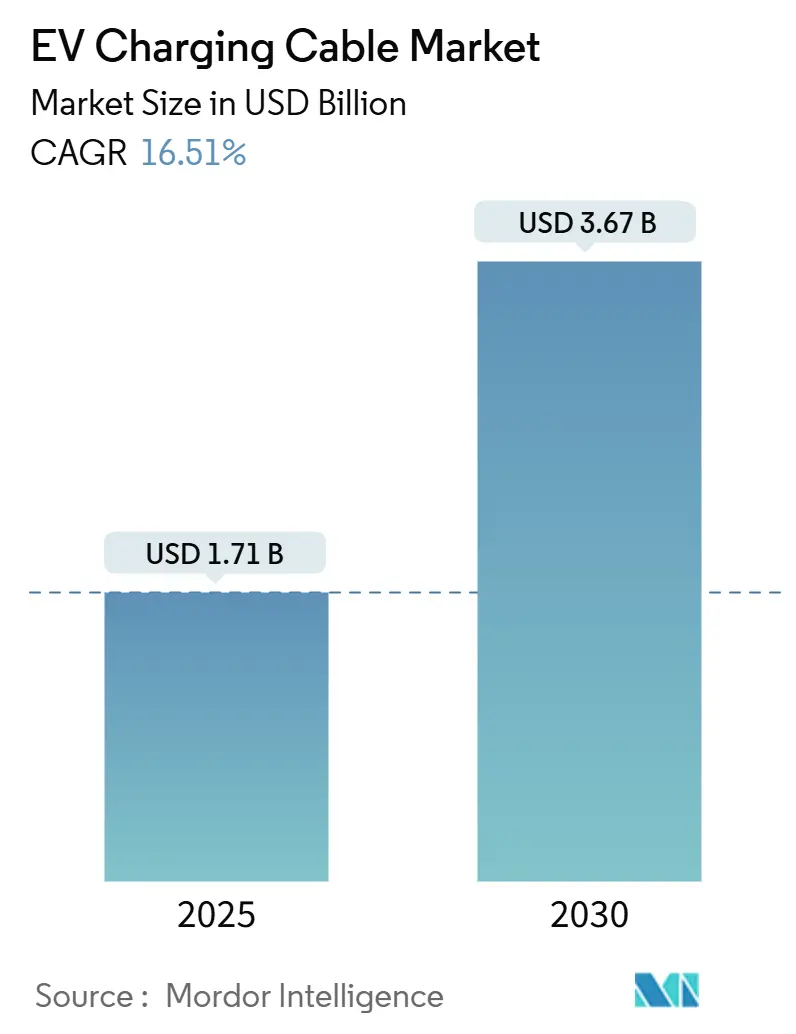
| Market Size (2025) | USD 1.71 Billion |
| Market Size (2030) | USD 3.67 Billion |
| Growth Rate (2025 - 2030) | 16.51% CAGR |
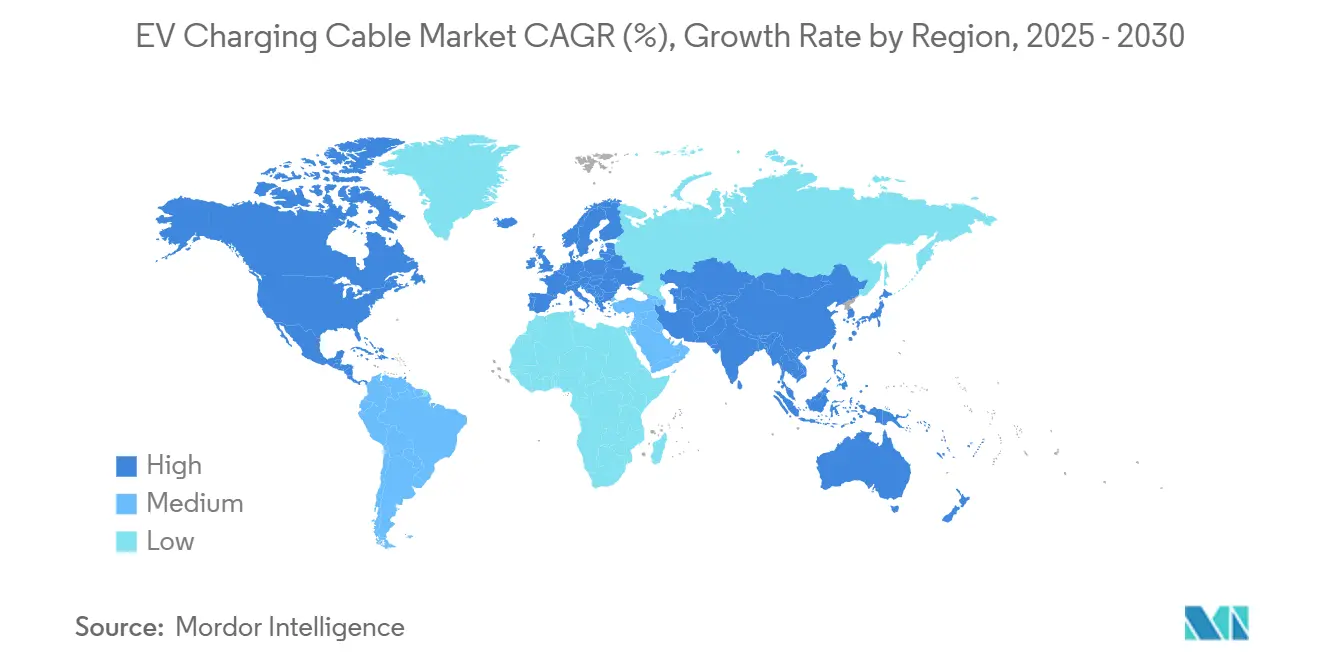
| Fastest Growing Market | Asia Pacific |
| Largest Market | Asia Pacific |
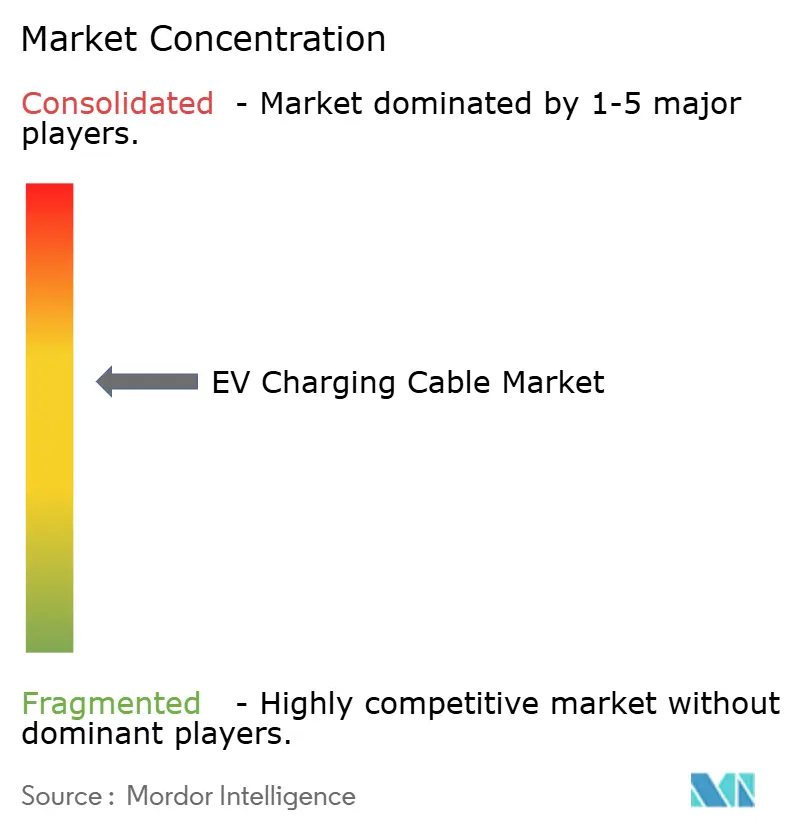
| Market Concentration | Medium |
Major Players *Disclaimer: Major Players sorted in no particular order Image © Mordor Intelligence. Reuse requires attribution under CC BY 4.0. | |
EV Charging Cable Market Analysis by Mordor Intelligence
The EV Charging Cable Market size is estimated at USD 1.71 billion in 2025, and is expected to reach USD 3.67 billion by 2030, at a CAGR of 16.51% during the forecast period (2025-2030). The expansion reflects accelerating electric-vehicle adoption, policy-driven infrastructure investment, and a marked shift from range-anxiety mitigation to high-power charging efficiency optimization. Fleet managers, charging-network operators, and utilities now specify liquid-cooled, high-amp cables that minimize dwell times, improve charger utilization, and satisfy emerging grid-integration protocols. Copper and elastomer price volatility, together with strict thermal-safety certification, shape sourcing strategies and favor suppliers with hedging programs, in-house materials innovation, and end-of-life recyclability. Convergence around CCS2 in Europe and NACS in North America simplifies inventory management and encourages scale production, while megawatt-class truck charging opens a premium sub-segment requiring advanced thermal management. In this environment, the EV charging cable market increasingly rewards suppliers that marry raw-material resilience with rapid connector re-tooling and predictive-maintenance capabilities.
Key Report Takeaways
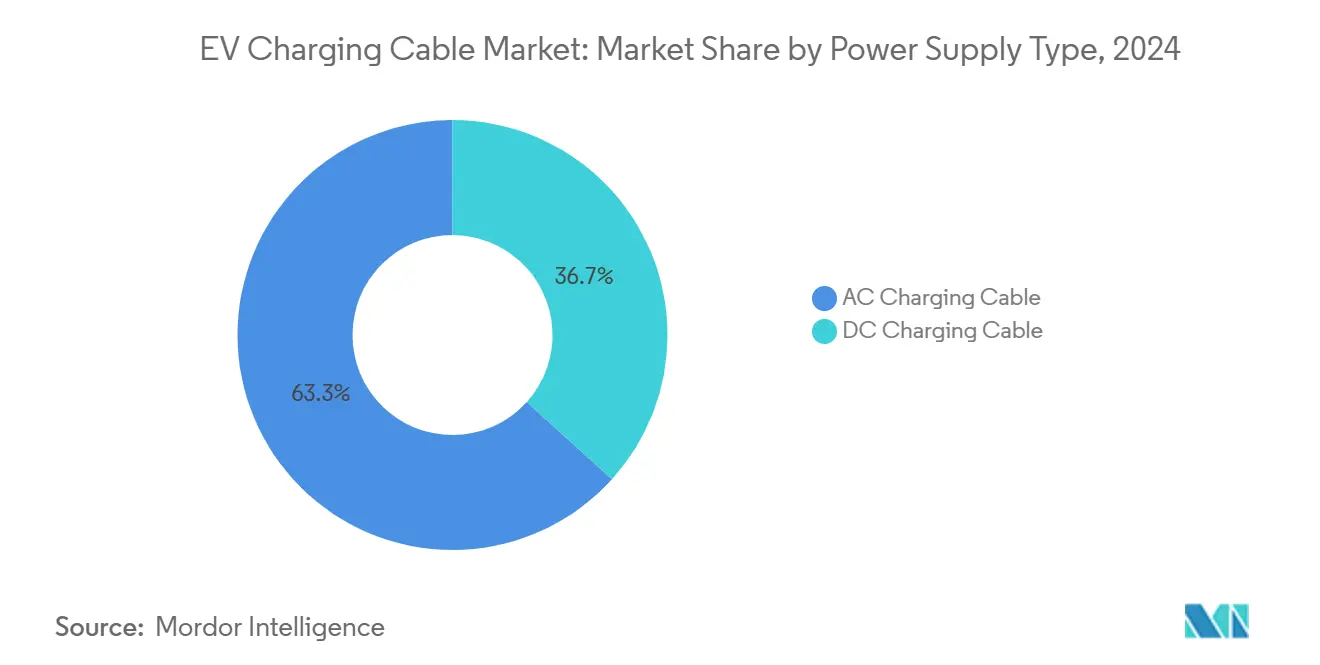
- By power supply type, AC charging cables held 63.26% EV charging cable market share in 2024, whereas DC cables record a 16.55% CAGR through 2030.
- By cable length, configurations under 5 m captured 46.73% of the EV charging cable market size in 2024, while cables over 10 m rise at a 16.62% CAGR to 2030.
- By charging level, Level 2 systems accounted for 51.28% share of the EV charging cable market size in 2024 and Level 3 solutions advance at a 16.64% CAGR through 2030.
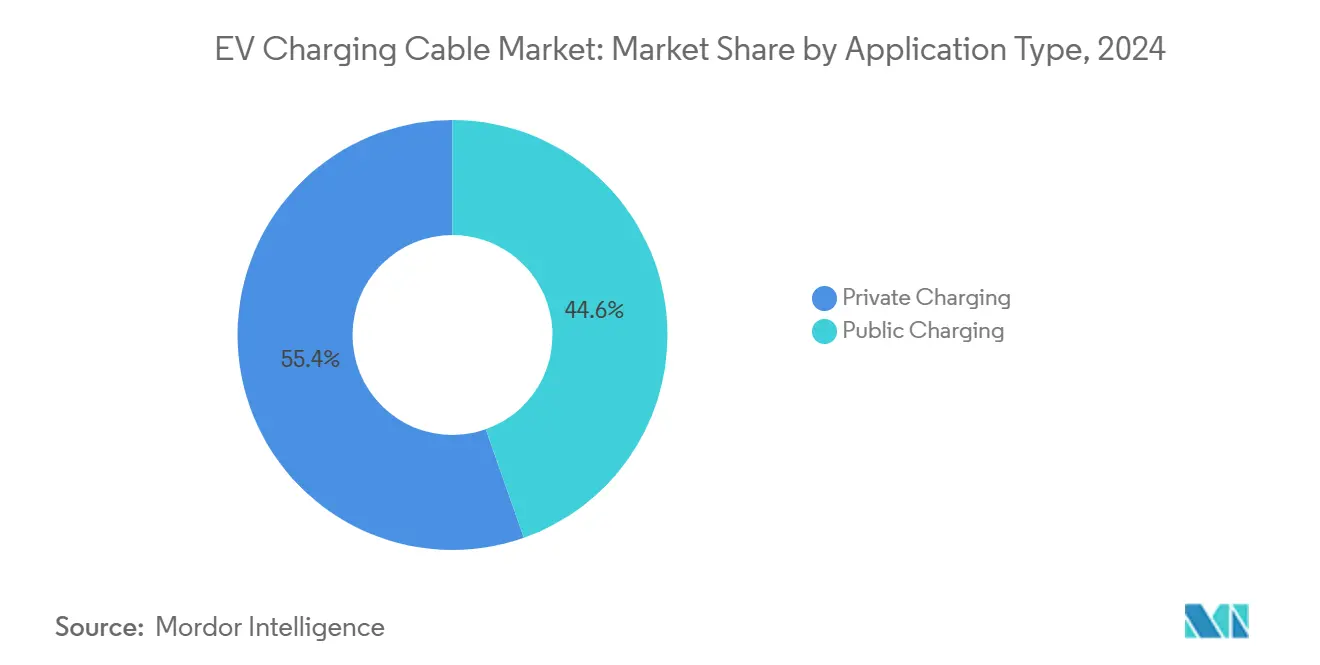
- By application, private charging represented 55.37% EV charging cable market share in 2024; public installations expand at a 16.53% CAGR to 2030.
- By connector, Type 2 retained 41.29% of the EV charging cable market size in 2024, while NACS grows the fastest at a 16.67% CAGR through 2030.
- By geography, Asia-Pacific led with 47.41% regional EV charging cable market share in 2024 and posts the fastest regional CAGR of 16.57% toward 2030.
Global EV Charging Cable Market Trends and Insights
Drivers Impact Analysis*
| Driver | (~) % Impact on CAGR Forecast | Geographic Relevance | Impact Timeline |
|---|---|---|---|
| Falling Cost And Longer Life Of Liquid-Cooled High-Amp Cables | +3.2% | North America and EU, expanding to Asia Pacific | Long term (≥ 4 years) |
| Accelerated Rollout Of Public DC Fast-Charging Corridors | +2.8% | Global, with NEVI program leadership in North America | Medium term (2-4 years) |
| Global Convergence Toward CCS And NACS Connector Standards | +2.1% | Global, with NACS adoption concentrated in North America | Short term (≤ 2 years) |
| Emergence Of Megawatt Charging | +1.9% | North America and EU core, early pilots in China | Medium term (2-4 years) |
| Fleet "Cable-As-A-Service" Subscription Models | +1.8% | Global, with early adoption in fleet-dense markets | Medium term (2-4 years) |
| Use Of Recycled Cu/Al Alloys To De-Risk Raw-Material Supply | +1.5% | Global, with regulatory drivers in EU and China | Long term (≥ 4 years) |
| Source: Mordor Intelligence | |||
Falling Cost & Longer Life Of Liquid-Cooled High-Amp Cables
Liquid cooling enables 350 kW-plus charging while trimming copper cross-section by two-fifth, translating into lighter, more flexible assemblies that meet new ergonomic regulations. Between 2023 and 2024, pump and heat-exchanger scale effects lowered system cost one-fifth, closing the gap with legacy high-gauge copper alternatives. Field data show a 15-year service life under continuous 300 kW cycling—roughly double that of air-cooled peers—cutting lifecycle costs for charge-point operators. Consistent thermal performance in high-ambient settings curbs derating episodes, boosting charger utilization and revenue per stall. OEMs now bundle coolant-ready harnesses at the vehicle side, easing plug-and-play adoption. The cost-durability calculus therefore tilts decisively toward liquid-cooled designs, reinforcing an upward ASP trajectory inside the EV charging cable market.
Accelerated Rollout Of Public DC Fast-Charging Corridors
Federal programs such as the NEVI initiative mandate 150 kW minimum power delivery at 53,000 projected stations, instantly redefining cable specifications and volume forecasts[1]“National Electric Vehicle Infrastructure Formula Program,” U.S. Department of Transportation, transportation.gov . Private operators co-invest to capture highway-corridor demand, multiplying unit orders and standardizing performance benchmarks. Buy America clauses favor domestic assembly, prompting European brands to open U.S. lines, while SAE-based interoperability tests create ancillary revenues for certification labs. Supply-chain alignment around more than or equal to 350 A liquid-cooled conductors reduces customization costs and accelerates learning-curve price declines. As regulatory milestones trigger staged funding releases, cable makers that front-load capacity secure multi-year purchase agreements and defensible margins. The outcome is a synchronized public-private build that propels the EV charging cable market toward scale economics previously reserved for telecom infrastructure.
Global Convergence Toward CCS & NACS Connector Standards
Tesla’s open licensing of NACS catalyzed a 2025 model-year pivot by Ford, GM, Volvo, and Rivian, truncating the connector transition timeline in North America. Operators can now consolidate inventory, shrink SKU complexity, and accelerate maintenance cycles, producing immediate opex savings. In Europe, CCS2 dominance remains anchored by UNECE rules, yet cable plants gain cross-regional efficiencies via common conductor and insulation platforms. Retooling costs—principally centered on over-mold tooling and automated pin-crimp stations—create a near-term capex hurdle, but scale payback materializes within two years at current volume forecasts. Suppliers that execute dual-standard roadmaps win share as transitional nodes bridge CCS1 to NACS ecosystems. The standard convergence trims forecast risk and supports additional unit growth for the EV charging cable market.
Emergence Of Megawatt Charging For HD Trucks
Electrification of Class 8 trucks raises charging demand from 350 kW to the 1 MW class, mandating liquid-cooled cables to maintain less than or equal to 70 mm outer diameters for ergonomic handling. Early deployments by Daimler’s eActros 600 and Tesla Semi shape IEC draft guidelines, embedding performance baselines into purchase requisitions. Integration with depot-level energy-storage systems and utility demand-response programs rewards cable providers fluent in grid-scale power-electronics coordination. Consortium pilots in the EU and California validate dual-circulation coolant loops that isolate vehicle and charger thermal domains, enhancing reliability. Suppliers offering turnkey power-train cables plus charge-station whips unlock cross-sell synergies, reinforcing the EV charging cable industry’s entry barrier at megawatt scale.
Restraints Impact Analysis*
| Restraint | (~) % Impact on CAGR Forecast | Geographic Relevance | Impact Timeline |
|---|---|---|---|
| Copper And Elastomer Price Volatility | -1.2% | Global, with particular impact on price-sensitive markets | Short term (≤ 2 years) |
| Grid-Harmonics Caps On Allowable Cable Current | -0.9% | Urban centers in North America and EU, expanding to Asia Pacific | Medium term (2-4 years) |
| Safety Recalls Over Thermal-Runaway Incidents | -0.8% | Global, with stricter enforcement in developed markets | Medium term (2-4 years) |
| Early OEM Shift Toward Wireless Inductive Charging | -0.7% | Premium vehicle segments globally, pilot programs in developed markets | Long term (≥ 4 years) |
| Source: Mordor Intelligence | |||
Copper & Elastomer Price Volatility
Spot copper oscillated slightly in 2024, pressuring gross margins when the metal constitutes three-fifth of cable BOM costs. Volatile oil derivatives similarly push elastomer-jacketing prices, complicating quote validity windows. Hedge strategies offset price spikes but limit upside when markets dip, forcing CFOs to balance risk tolerance against competitive pricing. Alloy substitution with aluminum cuts conductor costs up to 40% yet requires larger cross-sections that may breach ergonomic limits on hand-held cables. Tier-1 suppliers negotiate multi-year offtake agreements with mines, trading flexibility for cost visibility. The resulting spread between integrated majors and smaller players may widen consolidation inside the EV charging cable market.
Safety Recalls Over Thermal-Runaway Incidents
Tesla’s 2024 recall of supercharger cables for overheating highlighted design margins at ultra-high current densities and triggered IEC and UL test-protocol revisions. New cycles simulate abrasion, misalignment, and contaminant ingress, lengthening design-validation timelines by 6-12 months. Insurance premiums for unattended public chargers rise, transferring risk costs downstream to cable suppliers via warranty clauses. Station operators demand redundant thermal cut-offs and embedded temperature sensing, adding complexity and weight. Smaller vendors lacking advanced simulation and in-house test chambers face certification bottlenecks, potentially exiting the high-power segment. These safety pressures temper near-term growth but ultimately improve long-run trust in the EV charging cable market.
*Our forecasts treat driver/restraint impacts as directional, not additive. The impact forecasts reflect baseline growth, mix effects, and variable interactions.
Segment Analysis
By Power Supply Type: DC Cables Drive Infrastructure Evolution
AC cables retained 63.26% of the EV charging cable market share in 2024, while commercial rollouts propelled DC cables to a 16.55% CAGR, the fastest within the EV charging cable market. DC adoption hinges on 150 kW-plus public standards that compress charging stops from hours to minutes and align with ride-hailing fleet duty cycles. Liquid-cooled architecture dominates above 250 A, replacing air-cooled 70 mm² copper with 45 mm² conductors safeguarded by active coolant loops. Higher voltage insulation materials such as cross-linked polyethylene (XLPE) and ethylene-propylene-diene monomer (EPDM) deliver dielectric endurance at temperatures.
Second-generation DC cables embed fiber-optic temperature strands that feed predictive-maintenance dashboards, validating OEM uptime guarantees central to subscription-charging models. The system value stack includes reduced capex at the station level because liquid-coolant miniaturization caps combined with connector-cable weight are at ergonomic thresholds. Transaction-bus depot electrification further amplifies DC cable demand, where cables above 300 kW ensure peak-hour turnaround. Conversely, AC cables sustain demand for multi-family dwellings and workplace parking, where dwelling time exceeds six hours. These dual demand streams underpin balanced unit volumes, cementing a twin-track revenue profile for suppliers within the EV charging cable market.


By Cable Length: Flexibility Demands Drive Longer Configurations
Cables under 5 m captured 46.73% of the EV charging cable market in 2024, reflecting tight garage footprints and pole-mount stations that minimize trip hazards. Yet above-10 m assemblies surge at a 16.62% CAGR as fleet depots re-lay parking for pull-through truck bays and multi-vehicle bus platforms. Weight-reduction programs swap pure copper for mixed aluminum conductors, cutting mass 30% without compromising conductivity at liquid-cooled temperature bands. Strain-relief designs evolve from single compression glands to articulated swivel joints rated for 10,000 bend cycles, extending service life under high-frequency cable handling. Proprietary thermoplastic polyurethane jacketing resists diesel spills and UV degradation, aligning with outdoor fleet-yard environmental profiles.
Intermediate 5–10 m cables gain traction at corporate campuses and retail sites, balancing reach across adjacent stalls with manageable recoil lengths for human users. Automated cable retractor systems, borrowed from bus pantograph technology, are repurposed for truck depots, further stimulating demand for longer cables. Cable-as-a-service providers bundle maintenance for these higher-wear assemblies, ensuring periodic jacket inspection and connector pin replacement. Manufacturers that offer modular length kits address varying bay designs without bespoke engineering, accelerating quote-to-order cycles. The net effect is a diversified length mix that diffuses concentration risk and sustains revenue streams across the EV charging cable market.
By Charging Level: Level 3 Transforms Commercial Applications
Level 2 installations retained a 51.28% share of the EV charging cable market size in 2024, thanks to their residential entrenchment. Level 3 postings reached a 16.64% CAGR on the back of public-corridor mandates. Level 3 solutions employ EV charging cable market size upgrades such as dual-channel coolant paths and silver-plated contact pins to dissipate resistive heat at currents surpassing 500 A. The design leap triggers new galvanic corrosion and micro-fretting failure modes that cable engineers mitigate via ferritic stainless-steel housings and conformal coatings. Battery manufacturers coordinate BMS firmware to throttle charge profiles, constraining peak cable temperatures without user-visible slowdowns. Bi-directional vehicle-to-grid pilots exploit the same Level 3 connectors, enriching ancillary-service revenue while placing cyclical thermal stress on conductors.
Level 1 remains a contingency solution for roadside assistance and remote tourism spots, but diminishes in relative volume as average EV battery capacity climbs beyond 70 kWh. Retrofit programs, notably in Germany’s early 2019–2021 charger cohorts, upgrade AC pedestals to DC fast chargers by swapping cable whips and adding chiller units, supplying an aftermarket revenue pocket. The co-existence of Level 2 for overnight dwell and Level 3 for journey extension locks in a two-track demand structure that buffers the EV charging cable market against single-segment slump.
By Application Type: Public Infrastructure Accelerates Growth
Private charging sites maintained 55.37% of the EV charging cable market share in 2024, driven by home-garage installations and lightly utilized workplace docks. However, public infrastructure grows at a 16.53% CAGR, propelled by highway corridors, municipal curbside rollouts, and retail destination charging. Public sites demand tamper-resistant over-molds, anti-vandal strain reliefs, and RFID-enabled connector locking; these enhancements lift ASPs one-fifth above private equivalents. Payment-gateway integration imposes additional cybersecurity certification, extending time-to-market yet presenting value-added service revenue for cable makers with software units. Meanwhile, fleet depots, a hybrid sub-segment, incorporate public-grade durability into controlled-access yards, further blurring categorical lines and underpinning all-weather jacket formulations.
Life-cycle economics favor public fast-charge operators who can amortize higher-spec cables across high daily utilization, turning capital premium into ROI within 24 months. Consumer acceptance of per-kWh pricing models increases tolerance for cable-usage fees that finance upkeep. Municipal climate-action plans allocate grants covering up to four-fifths of cable cost when car-share or scooter fleets commit to open-data reporting, expanding total addressable units. Thus, escalating public deployments reinforce volume growth and margin stability across the EV charging cable market.
By Connector Type: NACS Standardization Reshapes Market
Type 2 connectors preserved 41.29% of the EV charging cable market share in 2024, entrenched by the EU’s Alternative Fuels Infrastructure Regulation. The Tesla-originated NACS standard, however, rises at a blistering 16.67% CAGR as Ford, GM, and Rivian align North American models for 2025 rollouts. Early-mover cable plants retrofit molding dies for NACS geometry, absorbing short-term capex but capturing locked-in multiyear OEM volumes. CCS1 faces progressive displacement, compelling legacy suppliers to hedge tool amortization schedules or relegate capacity to aftermarket refurbishment. CHAdeMO maintains a niche in Japan but loses export relevance, limiting global production runs and threatening economic minimums for specialized component inventories.
Type 1 connectors, although technically compatible with several Asian light-duty platforms, retreat into legacy support as 400 V architectures fade. Multi-standard cable heads, combining NACS and CCS2 within a single over-molded block, emerge for European tourist corridors serving U.S. visitors, lifting product complexity and unit pricing. Suppliers are agile enough to juggle multi-norm compliance, secure premium margins, and royalty income from licensed design geometries. Connector heterogeneity, therefore, transitions from a supply-chain headache to a competitive sorting mechanism inside the EV charging cable market.
Geography Analysis
Asia-Pacific represented 47.41% of the EV charging cable market in 2024 and is forecast to grow at a CAGR of 16.57% through 2030, buoyed by China’s deployment of a vast number of charging points and integrated supply chains that streamline conductor, insulation, and connector production. Government subsidies lock in high utilization, assuring manufacturers of steady volume drawdown and encouraging investment in vertical integration. Japanese and South Korean firms contribute high-density connector patents and liquid-cooling pump technology, reinforcing regional innovation leadership. India’s FAME-II program, targeting multiple public chargers by 2026, opens a late-mover demand curve characterized by cost-optimized aluminum cables, extending addressable tiers within the EV charging cable market.
North America ranks second in market size, energized by the NEVI program’s station mandate stipulating 150 kW minimum power. NACS adoption consolidates design language, simplifying procurement and accelerating deployment schedules. Canada supplements network density via its ZEVIP incentives, ensuring cross-border connector interoperability and uniform payment standards. Mexico’s EV-oriented assembly plants demand industrial-grade testing cables and in-plant charging whips rated for 800 V validation routines, enriching the professional-services layer of the market.
Europe grows steadily on the back of AFIR corridor targets, linking renewable-energy penetration with bidirectional charging pilots that require smart-grid compliant cables. German public tenders specify 100,000 h maintenance cycles and end-of-life recyclability, prompting suppliers to adopt circular-economy copper loops. Norway, sporting the world’s highest per-capita charging point density, pioneers cold-weather jacketing innovations now exported to Sweden and Canada. European directives on Digital Product Passports will mandate QR-coded traceability by 2026, granting first-mover commercial advantages to early-compliant cable brands within the EV charging cable market.

Competitive Landscape
The EV charging cable market remains moderately fragmented: the top five suppliers hold an estimated more than two-fifths of the market, keeping pricing competitive yet allowing innovation differentiation. Automotive-centric producers such as Leoni, TE Connectivity, and Aptiv exploit OEM design-in cycles to lock multi-year platform contracts and supply vehicle-integrated leads alongside external station whips. Electrical-component specialists Phoenix Contact and Nexans target public fast-charger operators, offering turnkey solutions that bundle connectors, cooling manifolds, and predictive-maintenance software.
R&D centers pivot toward conductive-polymer alloys and aluminum-core conductors with copper cladding, aiming to cut weight by one-fourth while maintaining ampacity. Leoni’s new Suzhou facility produces 600,000 liquid-cooled lines annually, scaling to meet Chinese megawatt truck pilots. TE Connectivity leverages 800 V inverter know-how to co-develop high-speed data-plus-power hybrids for vehicle-to-grid applications, creating differentiation beyond raw ampacity. Copper price volatility and escalating UL testing fees strain smaller entrants, triggering acquisition moves such as Nexans’ 2025 purchase of Coroplast’s EV cable unit, which provided immediate thermal-management IP and European capacity. The consolidation trajectory suggests a gradual shift toward a top-player share around more than half by 2030, still leaving room for niche innovators[2]“Nexans Acquires Coroplast EV Business,” Nexans SA, nexans.com .
Competitive intensity is further shaped by sustainability credentials; Aptiv’s one-fourth recycled-copper line and Nexans’ goal of 100% recyclable cables by 2026 resonate with OEM scope-3 reporting mandates. Suppliers investing in compliance automation for UL 2594 and IEC 62196 retain speed-to-market advantages, winning early slots on public-infrastructure tenders. Geographic manufacturing diversification—spanning North America, Europe, and Asia—emerges as a hedge against tariff and logistics risk, entrenching incumbents with global plant footprints.
EV Charging Cable Industry Leaders
Leoni AG
TE Connectivity Ltd.
Aptiv PLC
Sinbon Electronics
Phoenix Contact
- *Disclaimer: Major Players sorted in no particular order

Recent Industry Developments
- August 2025: Lapp Group launched its ÖLFLEX EV charging cable with integrated temperature-monitoring sensors that enable real-time thermal management and predictive maintenance for high-utilization commercial chargers.
- June 2025: Nexans SA completed its USD 85 million acquisition of Coroplast’s charging-cable division, adding liquid-cooled IP and expanding European manufacturing capacity.


Global EV Charging Cable Market Report Scope
| AC Charging Cable |
| DC Charging Cable |
| Below 5 m |
| 5–10 m |
| Above 10 m |
| Level 1 |
| Level 2 |
| Level 3 |
| Private Charging |
| Public Charging |
| Type 1 |
| Type 2 |
| CCS |
| CHAdeMO |
| Tesla NACS |
| North America | United States |
| Canada | |
| Rest of North America | |
| South America | Brazil |
| Argentina | |
| Rest of South America | |
| Europe | United Kingdom |
| Germany | |
| Spain | |
| Italy | |
| France | |
| Russia | |
| Rest of Europe | |
| Asia Pacific | India |
| China | |
| Japan | |
| South Korea | |
| Rest of Asia Pacific | |
| Middle East and Africa | United Arab Emirates |
| Saudi Arabia | |
| Turkey | |
| Egypt | |
| South Africa | |
| Rest of Middle East and Africa |
| By Power Supply Type | AC Charging Cable | |
| DC Charging Cable | ||
| By Cable Length | Below 5 m | |
| 5–10 m | ||
| Above 10 m | ||
| By Charging Level | Level 1 | |
| Level 2 | ||
| Level 3 | ||
| By Application Type | Private Charging | |
| Public Charging | ||
| By Connector Type | Type 1 | |
| Type 2 | ||
| CCS | ||
| CHAdeMO | ||
| Tesla NACS | ||
| By Region | North America | United States |
| Canada | ||
| Rest of North America | ||
| South America | Brazil | |
| Argentina | ||
| Rest of South America | ||
| Europe | United Kingdom | |
| Germany | ||
| Spain | ||
| Italy | ||
| France | ||
| Russia | ||
| Rest of Europe | ||
| Asia Pacific | India | |
| China | ||
| Japan | ||
| South Korea | ||
| Rest of Asia Pacific | ||
| Middle East and Africa | United Arab Emirates | |
| Saudi Arabia | ||
| Turkey | ||
| Egypt | ||
| South Africa | ||
| Rest of Middle East and Africa | ||


Key Questions Answered in the Report
How fast is global demand for high-power EV charging cables growing?
Public and fleet deployments push Level 3 liquid-cooled assemblies at a 16.64% CAGR to 2030, outpacing all other power categories.
Which connector standard is gaining the most momentum in North America?
Tesla’s NACS is the fastest-growing connector, posting a 16.67% CAGR as major automakers switch by the 2025 model year.
What role do recycled metals play in cable manufacturing economics?
Conductors with up to 25% recycled copper trim material costs 8% and help suppliers counter 23% spot-price volatility while satisfying OEM sustainability targets.
Why are cables over 10 m in length attracting attention?
Longer cables enable single-pedestal layouts in bus and truck depots, driving a 16.62% CAGR as fleet operators prioritize flexible stall design.
How does the NEVI program affect sourcing strategies for cable suppliers?
Buy America clauses incentivize U.S. assembly lines, prompting European and Asian manufacturers to add domestic capacity to secure federal contracts.
What is the primary technical challenge at megawatt-class truck charging?
Maintaining sub-70 mm outer diameter while managing more than1 MW thermal loads necessitates dual-loop liquid-cooled cables with advanced strain relief.
Page last updated on:


