EV Charging Management Software Platform Market Size and Share
Market Overview
| Study Period | 2019 - 2030 |
|---|---|
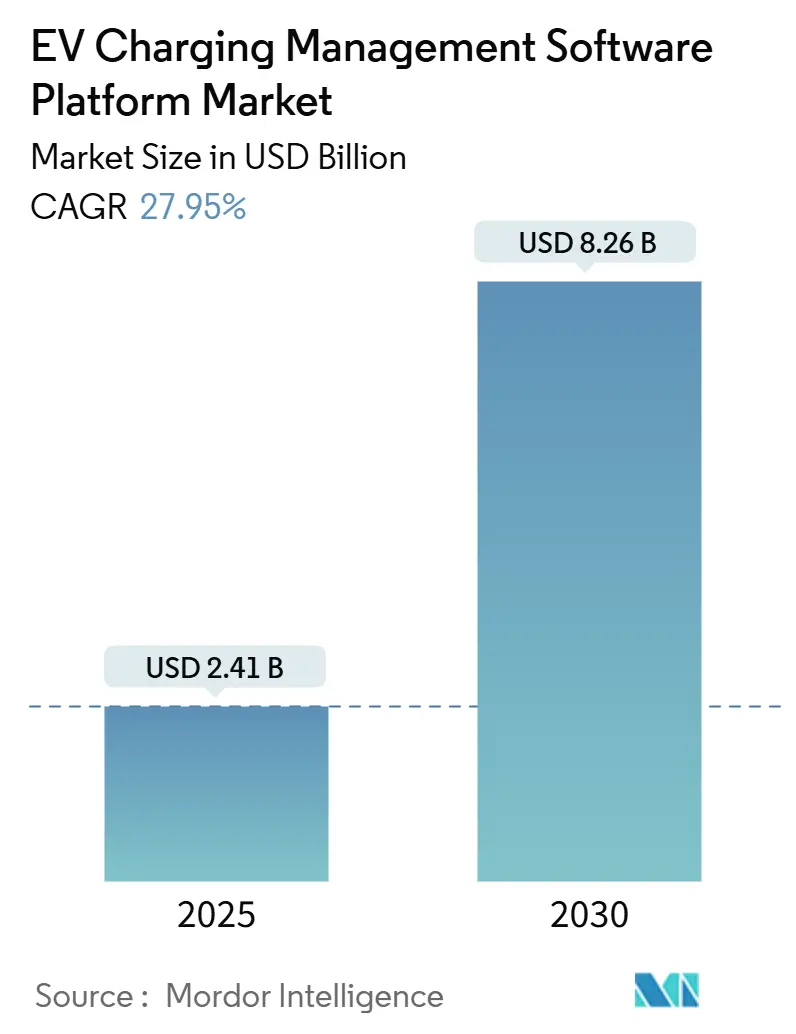
| Market Size (2025) | USD 2.41 Billion |
| Market Size (2030) | USD 8.26 Billion |
| Growth Rate (2025 - 2030) | 27.95% CAGR |
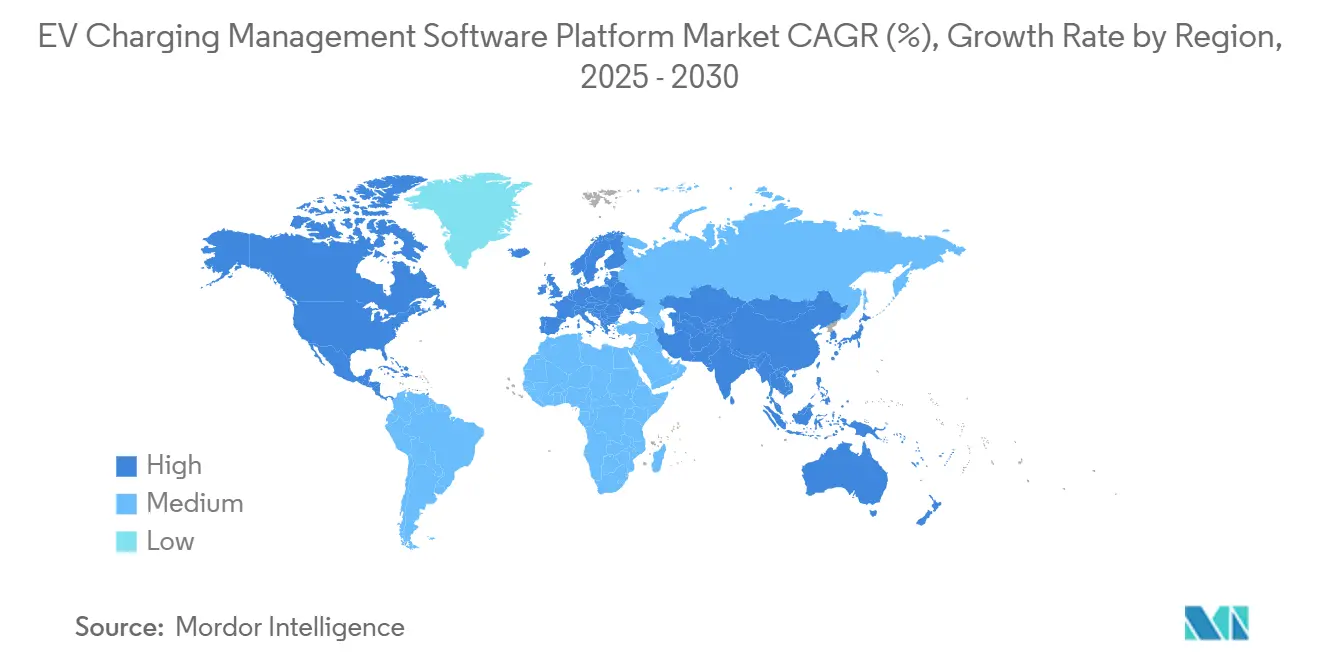
| Fastest Growing Market | Asia Pacific |
| Largest Market | North America |
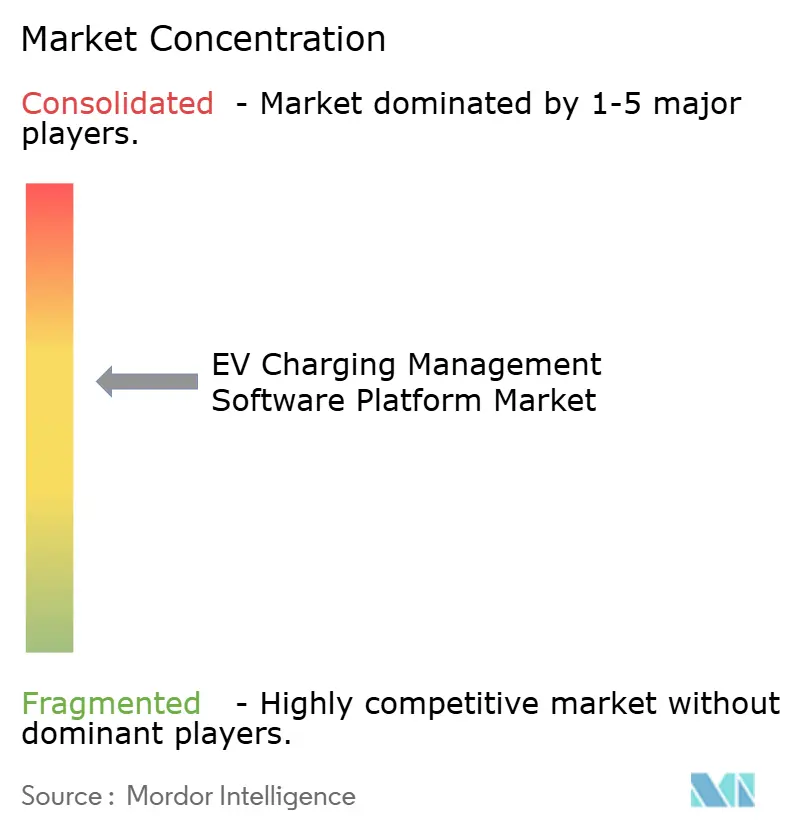
| Market Concentration | Medium |
Major Players *Disclaimer: Major Players sorted in no particular order Image © Mordor Intelligence. Reuse requires attribution under CC BY 4.0. | |
EV Charging Management Software Platform Market Analysis by Mordor Intelligence
The EV Charging Management Software Platform Market size is estimated at USD 2.41 billion in 2025, and is expected to reach USD 8.26 billion by 2030, at a CAGR of 27.95% during the forecast period (2025-2030). Expansion reflects the intersection of government incentives, corporate fleet electrification, and accelerating standards adoption, raising the technical bar for backend platforms. Operations-focused modules have the most significant 2024 footprint, while analytics functions post the quickest gains as operators turn raw charging data into actionable grid and revenue insights. Cloud deployments dominate because enterprises favor low-touch scalability and seamless integration with existing IT stacks. Fast-charging corridors push Level 3 software requirements higher, yet Level 2 chargers anchor most installed sites. Public chargers lead installed base metrics, but private workplace and fleet installations now post the steepest growth curves. Regionally, North America leads in spending while Asia Pacific registers the fastest surge, spearheaded by China and India.
Key Report Takeaways
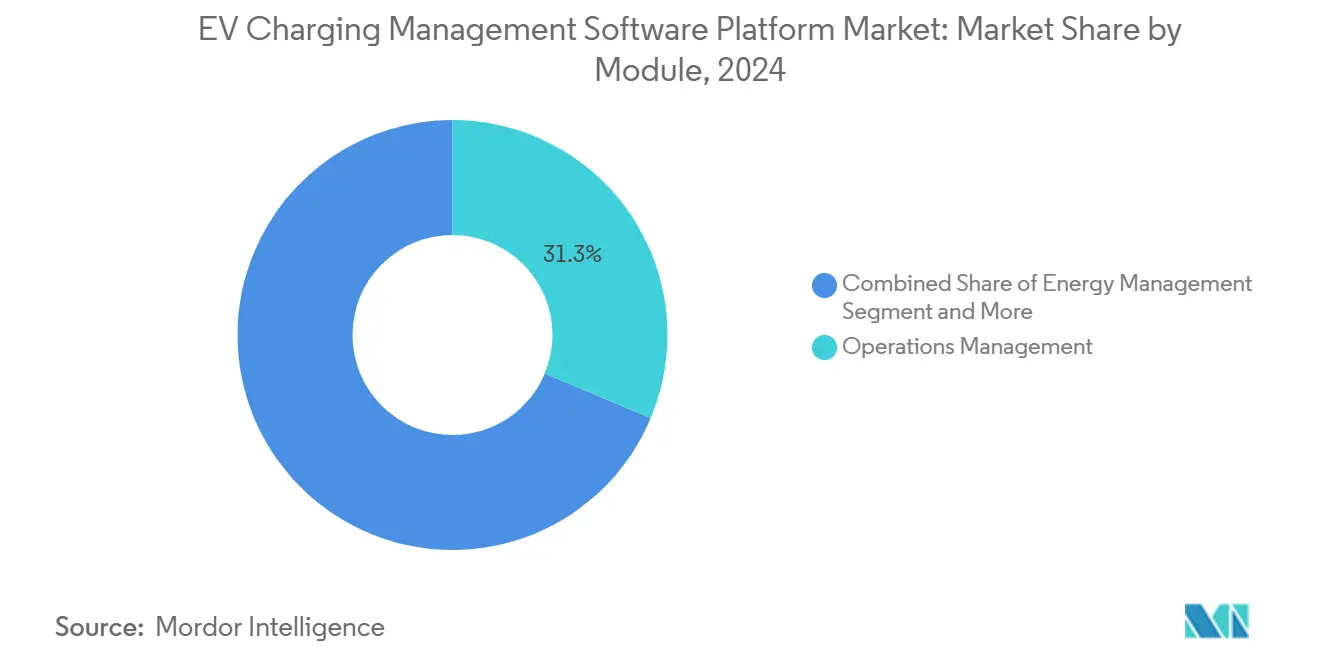
- By module, Operations Management held 31.26% of the EV charging management software platform market share in 2024, whereas analytics and reporting are projected to advance at a 27.97% CAGR through 2030.
- By deployment type, cloud models captured 73.24% of the EV charging management software platform market share in 2024, and cloud is forecast to post a 27.99% CAGR during 2025-2030.
- By charger type, Level 2 had a 53.37% share of the EV charging management software platform market in 2024, and Level 3 solutions are set to grow at a 28.03% CAGR through 2030.
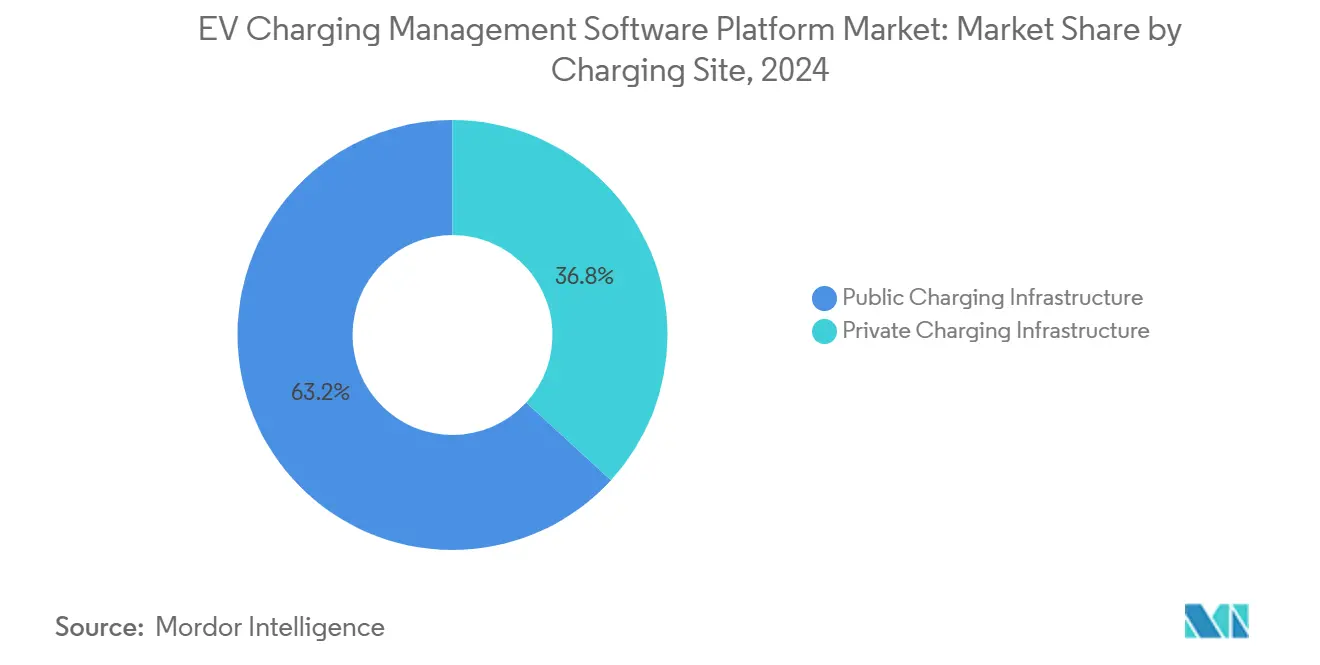
- By charging site, public infrastructure controlled 63.21% of the EV charging management software platform market share in 2024, and private infrastructure is expected to climb at a 28.08% CAGR to 2030.
- By end user, Charge Point Operators led with 47.61% of the EV charging management software platform market share in 2024, whereas Fleet Operators are anticipated to expand at a 28.11% CAGR during the same horizon.
- By geography, North America led with 37.88% of the EV charging management software platform market share in 2024, whereas the Asia Pacific is projected to register a 28.01% CAGR through 2030.
Global EV Charging Management Software Platform Market Trends and Insights
Drivers Impact Analysis*
| Driver | (~) % Impact on CAGR Forecast | Geographic Relevance | Impact Timeline |
|---|---|---|---|
| Government Incentives | +6.2% | Global, with strongest impact in North America and EU | Medium term (2-4 years) |
| Fleet Electrification Surge | +5.8% | Global, led by North America and Europe | Short term (≤ 2 years) |
| Compliance With OCPP 2.0.1 and ISO 15118 | +4.1% | Europe & North America core, expanding to Asia Pacific | Long term (≥ 4 years) |
| AI-Driven Dynamic Load Management | +3.9% | Asia Pacific core, spill-over to North America and EU | Medium term (2-4 years) |
| Demand-Response Monetization | +2.7% | North America and EU, early adoption in Australia | Long term (≥ 4 years) |
| Storage-Integrated Charging Ecosystems | +2.4% | Global, with early gains in California, Germany, Australia | Long term (≥ 4 years) |
| Source: Mordor Intelligence | |||
Government Incentives & Subsidies
Federal spending, such as the vast amount allocated inside the U.S. Infrastructure Investment and Jobs Act, links hardware rollouts to software that meets OCPP 2.0.1 reporting mandates[1]“Division J – Title III – Electric Vehicle Charging,” Infrastructure Investment and Jobs Act, congress.gov. Europe’s Alternative Fuels Infrastructure Regulation compels payment interoperability and price transparency, raising the baseline for feature-rich back-end systems. India ties subsidies under the National Electric Mobility Mission to platforms that support local payment rails and grid communication standards[2]“National Electric Mobility Mission Plan,” Government of India, niti.gov.in. These funding rules disqualify basic orchestration tools and reward vendors with multi-protocol grid services, lifting demand for advanced EV charging management software market solutions. The outcome narrows viable supplier pools and lifts technical barriers to entry.
Fleet Electrification Surge
Parcel, last-mile, and municipal fleets shift to battery-electric vehicles under corporate emission targets, pushing demand for platforms that join dispatch, telematics, and energy billing in a single stack. UPS and FedEx's expansion into electric vans requires route-aware charging algorithms that trim downtime and energy cost. Software must show clear ROI through lower demand charges, predictive maintenance, and higher asset utilization. Integration depth with existing fleet management suites, therefore, differentiates suppliers. This dynamic underpins the CAGR outlook for fleet operators’ spending on EV charging management software market capabilities.
Compliance With OCPP 2.0.1 & ISO 15118
The shift from OCPP 1.6 to OCPP 2.0.1 upgrades encryption, transaction handling, and smart-charging controls, while ISO 15118 adds Plug & Charge and vehicle-to-grid messaging. Vendors able to embed these standards early gain speed to market, tighter security, and enhanced user experience. Europe enforces these protocols through AFIR, and U.S. funding guidance echoes them. Smaller software firms lacking protocol expertise face existential risk, accelerating market consolidation around standard-ready suppliers.
AI-Driven Dynamic Load Management
Platforms now deploy machine learning to predict site load, weather-linked renewables, and tariff patterns, cutting energy costs by up to two-fifths for operators such as Ampcontrol and Driivz. Algorithms also flag component failures before downtime and orchestrate storage systems for demand-response revenue. This data-centric edge raises switching costs and underscores why analytics modules post the fastest growth rate inside the EV charging management software market.
Restraints Impact Analysis*
| Restraint | (~) % Impact on CAGR Forecast | Geographic Relevance | Impact Timeline |
|---|---|---|---|
| Hardware Interoperability Challenges | -3.2% | Global, most acute in North America during NACS transition | Short term (≤ 2 years) |
| Cyber-Security and Data-Privacy Risks | -2.8% | Global, with heightened concerns in Europe due to GDPR | Medium term (2-4 years) |
| OEM-Controlled Closed Ecosystems | -2.1% | Global, led by Tesla's proprietary approach | Long term (≥ 4 years) |
| Scarcity Of Certified OCPP/OCPI Talent | -1.9% | Europe and North America, expanding to Asia Pacific | Medium term (2-4 years) |
| Source: Mordor Intelligence | |||
Hardware Interoperability Challenges
The ongoing migration from CCS to NACS plugs compels software to juggle multiple connectors, power levels, and message sets. Tesla’s Supercharger integration still leans on proprietary APIs, complicating third-party platform rollouts. Fleet owners with mixed OEM vehicles confront adapter management headaches, inflating support costs. Vendors abstracting hardware diversity within one dashboard appeal to operators seeking smooth user experiences.
Cyber-Security & Data-Privacy Risks
A hacked charger fleet can trigger grid instability or leak driver payment data. EU GDPR rules fine violators up to a minimum of annual turnover, putting security spend front and center. Software must encrypt sessions end-to-end, monitor anomalies, and issue timely patches without service interruptions. Smaller firms struggle to fund dedicated security teams, nudging buyers toward established providers with 24/7 security operations centers.
*Our forecasts treat driver/restraint impacts as directional, not additive. The impact forecasts reflect baseline growth, mix effects, and variable interactions.
Segment Analysis
By Module: Operations Management Leads While Analytics Accelerates
Operations Management modules held 31.26% of the EV charging management software market share in 2024, underscoring the primacy of uptime tracking, user authentication, and maintenance workflows at scale. These features remain indispensable as networks expand beyond single-site footprints. The segment’s dominance also reflects the installed base of legacy systems that prioritize transactional integrity over advanced insights.
However, Analytics & Reporting is projected to expand at a 27.97% CAGR, outpacing every other functionality set. Heightened regulatory reporting and the demand for energy cost optimization fuel this climb. Vendors embed machine-learning models that mine utilization data to predict demand and flag component fatigue. Site operators leverage dashboards for dynamic tariff setting and carbon accounting. Such data-rich capabilities lift strategic value and drive cross-sell momentum toward integrated suites.


By Deployment Type: Cloud Dominance Deepens
Cloud solutions controlled 73.24% of the EV charging management software market share in 2024 as enterprises gravitated to subscription models that require no local server upkeep. Centralized software updates keep pace with fast-moving protocols and charger firmware modifications. Operators benefit from high-availability architectures and role-based access across dispersed sites, key attributes for nationwide fleets.
Hybrid adoption appears among utilities and defense installations demanding data sovereignty, yet bandwidth improvements and zero-trust security frameworks erode on-premise justification. The cloud cohort is expected to clock a 27.99% CAGR through 2030, reinforcing vendor incentives to build SaaS-native roadmaps.
By Charger Type: Level 2 Anchors, Level 3 Disrupts
Level 2 units represented 53.37% of the EV charging management software market share in 2024 as workplace and destination locations match their six-to-eight-hour dwell profile. Energy tariffs and grid capacity also favor moderate charging speeds at commercial properties. Consequently, management software revolves around basic queue handling and daily reports.
Level 3 infrastructure, in contrast, attracts 28.03% CAGR acclaim as highway corridors and ride-hail fleets chase 20-minute turnarounds. Fast chargers trigger higher demand charges and thermal stress, prompting sophisticated load balancing, battery-friendly charge curves, and real-time dynamic pricing. Software optimized for these challenges differentiates through AI algorithms that weigh grid constraints, battery chemistries, and energy wholesale prices.
By Charging Site: Public Now, Private Next
Public networks retained 63.21% of the EV charging management software market share in 2024, buoyed by federal corridor grants and retail destination partnerships. Payment interoperability and roaming agreements drove significant software license volumes.
Private installations, however, will advance at a 28.08% CAGR as corporate ESG pledges push employers to install behind-the-fence chargers. Complexity exceeds public deployments because platforms must integrate employee ID systems, building energy management, and HR reimbursement workflows. Vendors capable of threading these systems score long contracts with fleet depots and multi-tenant offices.
By End User: CPOs Hold Ground, Fleets Accelerate
Charge Point Operators captured 47.61% of the EV charging management software market share in 2024 through the public network scale and established consumer brands. Their product requirements include customer apps, payment gateways, and roaming settlement engines.
Fleet Operators promise the steepest growth at 28.11% CAGR because delivery, ride-hail, and bus fleets reposition toward battery power. They insist on scheduler integration, route-aware energy forecasts, and maintenance analytics. Suppliers offering modular APIs find fertile ground here as fleets seek to fuse charging data into broader telematics ecosystems. Utilities and EV OEMs also enlarge footprints by bundling software with grid services and vehicle sales.
Geography Analysis
North America commanded 37.88% of the EV charging management software market share in 2024 after landmark U.S. funding set standards-compliant software requirements. California’s leadership on zero-emission vehicle mandates, the National Electric Vehicle Infrastructure program, and utility incentives coalesce to make the region a fertile early-adopter landscape. Canada’s federal and provincial grants expand bilingual platform demand, while Mexico’s nascent EV push attracts providers with multi-currency dashboards.
Asia Pacific is the fastest climber, with a 28.01% CAGR through 2030. China’s scale forces vendors to localize servers and comply with the Cybersecurity Law, yet the sheer density of public chargers offers unrivaled data sets for algorithm training. India’s 1.32 million charger target unlocks rural and urban smart-charging opportunities that mesh with its UPI payment rails[3]“Public Charging Station Guidelines,” Ministry of Housing and Urban Affairs – India, mohua.gov.in . Japan’s resilience planning values ISO 15118 peer-to-grid capabilities. Each country thus rewards flexible architectures and multi-lingual interfaces.
Europe’s coherent regulatory canvas, anchored in AFIR and GDPR, delivers steady volume for platforms that harden encryption and support roaming settlement. Germany’s Energiewende widens the scope for renewable-synced charging logics, while the Netherlands pilots vehicle-to-grid bus depots requiring millisecond data exchanges. Vendors mastering these integration layers are positioned to harvest pan-EU contracts as member states race toward 2030 emission-reduction targets.

Competitive Landscape
The market structure skews toward moderate fragmentation but is tightening. Oil majors such as Shell acquired Volta, converting retail real estate footprints into data-rich charging hubs and integrating them into Shell’s energy trading desk. Payment specialist Fleetcor bought Mina to couple fleet fuel cards with electricity billing. Blink Charging’s 2025 pickup of Zemetric underscores a rush to absorb AI talent. These moves compress the field and lift table-stakes functionality.
Incumbents like ChargePoint and Tesla defend share via vertical ecosystems and deep firmware control. At the same time, software-first entrants like Driivz and Ampcontrol court operators who need open APIs and machine-learning optimization. Intellectual property races around load forecasting, battery health scoring, and multi-asset orchestration. Vendors emphasizing open-source governance continue to win public procurements that demand technology neutrality.
Heightened security obligations and protocol complexity create acquisition barriers for cash-light startups. Still, niche opportunities persist in marine, airport ground-service, and mining electrification segments where domain know-how outweighs scale. Successful challengers will likely partner with utilities to secure grid-service revenue streams and differentiate beyond simple session billing.
EV Charging Management Software Platform Industry Leaders
ChargePoint
Tesla Inc.
ABB Ltd
EVBox (Everon)
Siemens AG
- *Disclaimer: Major Players sorted in no particular order

Recent Industry Developments
- July 2025: Blink Charging acquired Zemetric for an undisclosed amount to bolster fleet-focused analytics and optimization features.
- January 2025: Amber purchased Australia-based Charge HQ for AUD 15 million (USD 10.1 million) to gain vehicle-to-grid software and a residential customer base.


Global EV Charging Management Software Platform Market Report Scope
| Operations Management |
| Energy Management |
| Billing & Payment Management |
| User Access Control |
| Analytics & Reporting |
| Cloud-Based |
| On-Premise |
| Level 1 |
| Level 2 |
| Level 3 |
| Public Charging Infrastructure |
| Private Charging Infrastructure |
| Charge Point Operators (CPOs) |
| Fleet Operators |
| Utilities |
| EV OEMs |
| Government Agencies |
| North America | United States |
| Canada | |
| Rest of North America | |
| South America | Brazil |
| Argentina | |
| Rest of South America | |
| Europe | United Kingdom |
| Germany | |
| Spain | |
| Italy | |
| France | |
| Russia | |
| Rest of Europe | |
| Asia Pacific | India |
| China | |
| Japan | |
| South Korea | |
| Rest of Asia Pacific | |
| Middle East and Africa | United Arab Emirates |
| Saudi Arabia | |
| Turkey | |
| Egypt | |
| South Africa | |
| Rest of Middle East and Africa |
| By Module | Operations Management | |
| Energy Management | ||
| Billing & Payment Management | ||
| User Access Control | ||
| Analytics & Reporting | ||
| By Deployment Type | Cloud-Based | |
| On-Premise | ||
| By Charger Type | Level 1 | |
| Level 2 | ||
| Level 3 | ||
| By Charging Site | Public Charging Infrastructure | |
| Private Charging Infrastructure | ||
| By End User | Charge Point Operators (CPOs) | |
| Fleet Operators | ||
| Utilities | ||
| EV OEMs | ||
| Government Agencies | ||
| By Geography | North America | United States |
| Canada | ||
| Rest of North America | ||
| South America | Brazil | |
| Argentina | ||
| Rest of South America | ||
| Europe | United Kingdom | |
| Germany | ||
| Spain | ||
| Italy | ||
| France | ||
| Russia | ||
| Rest of Europe | ||
| Asia Pacific | India | |
| China | ||
| Japan | ||
| South Korea | ||
| Rest of Asia Pacific | ||
| Middle East and Africa | United Arab Emirates | |
| Saudi Arabia | ||
| Turkey | ||
| Egypt | ||
| South Africa | ||
| Rest of Middle East and Africa | ||


Key Questions Answered in the Report
What is the forecast value for EV charging management software by 2030?
The market is projected to reach USD 8.26 billion by 2030.
Which module segment is expanding the fastest?
Analytics & Reporting is growing at a 27.97% CAGR through 2030.
Why are cloud deployments dominant?
Enterprises prefer scalable SaaS models that simplify updates and integrate easily with fleet and energy systems.
Which region shows the highest growth rate?
Asia Pacific is poised for a 28.01% CAGR, driven by China and India.
How is market consolidation unfolding?
Energy majors and payment specialists are acquiring software firms for AI capabilities and grid-service integration.
What cybersecurity measures are critical for operators?
End-to-end encryption, anomaly detection, and compliance with GDPR-style regulations are now essential.
Page last updated on:


