Residential EV Charger Market Size and Share
Market Overview
| Study Period | 2020 - 2031 |
|---|---|
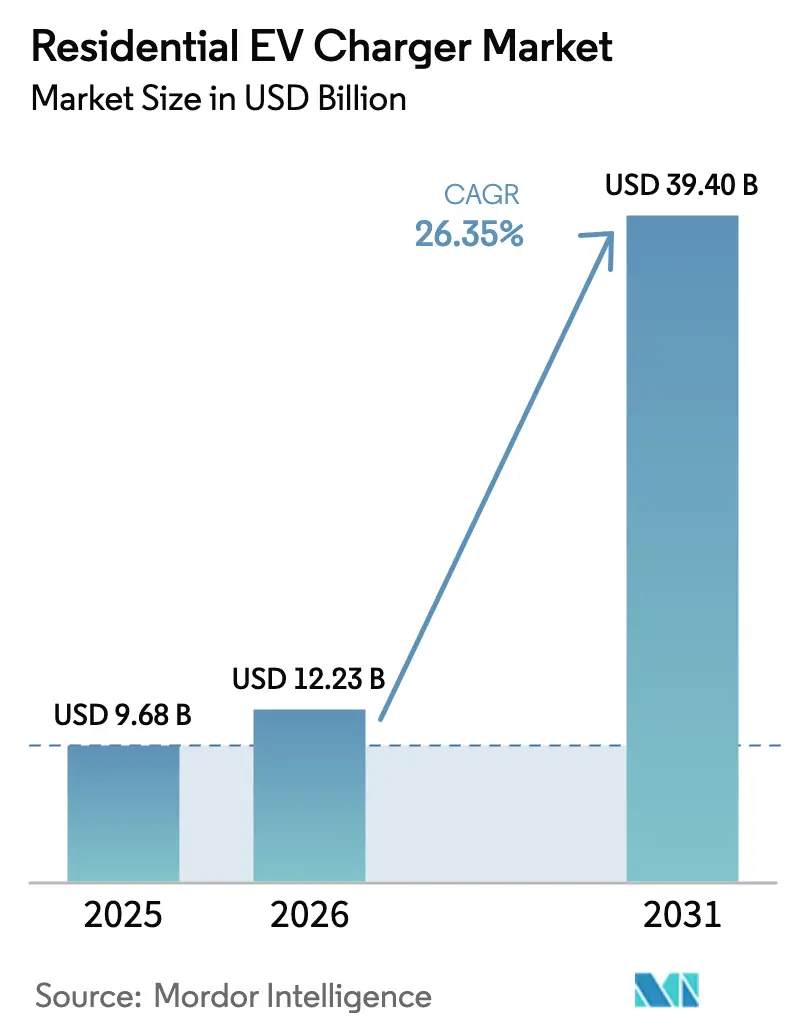
| Market Size (2026) | USD 12.23 Billion |
| Market Size (2031) | USD 39.4 Billion |
| Growth Rate (2026 - 2031) | 26.35% CAGR |
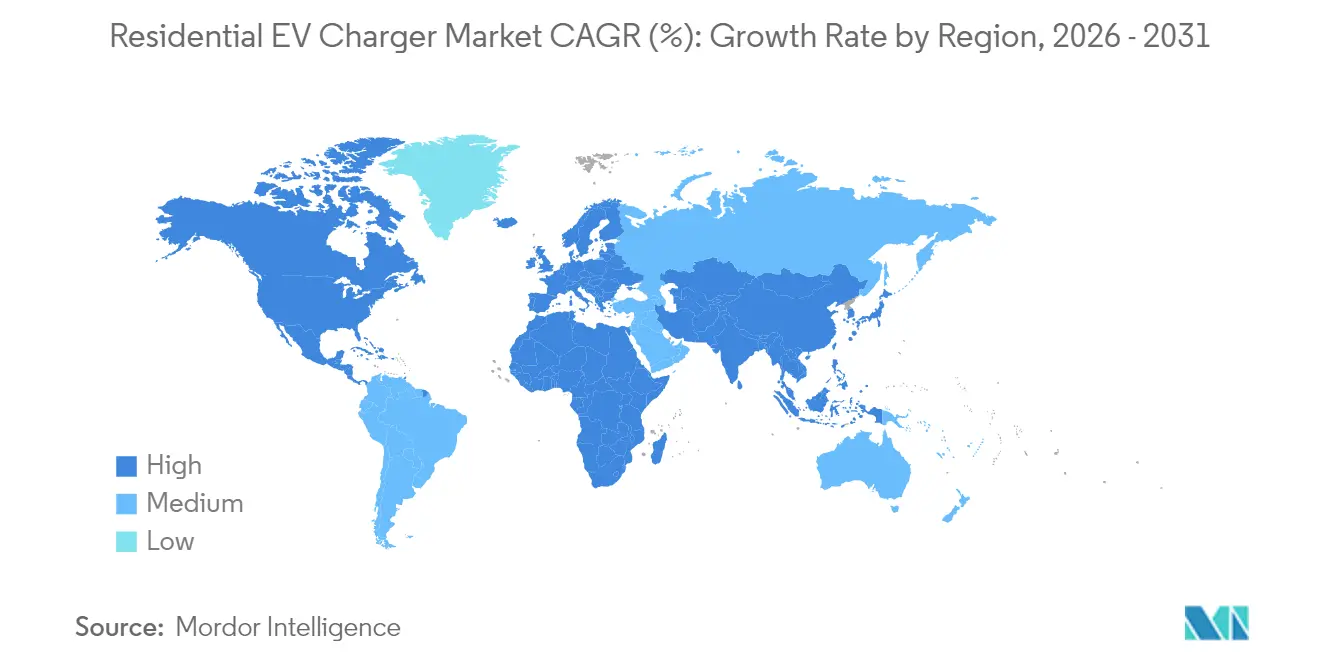
| Fastest Growing Market | Middle East and Africa |
| Largest Market | Asia Pacific |
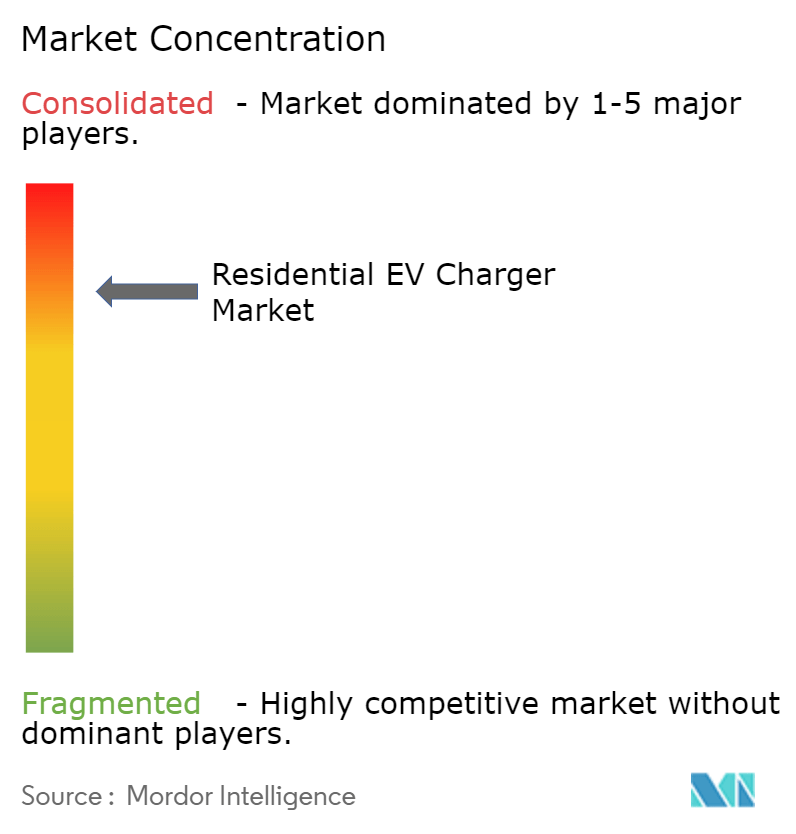
| Market Concentration | Medium |
Major Players
*Disclaimer: Major Players sorted in no particular order Image © Mordor Intelligence. Reuse requires attribution under CC BY 4.0. |
|
Residential EV Charger Market Analysis by Mordor Intelligence
The residential EV charger market size is expected to grow from USD 9.68 billion in 2025 to USD 12.23 billion in 2026 and is forecast to reach USD 39.4 billion by 2031 at 26.35% CAGR over 2026-2031. Hardware prices continue to fall, aided by global battery pack costs approaching USD 100/kWh, while federal incentives such as the 30% U.S. tax credit for home installations lower ownership hurdles[1]"Alternative Fuel Vehicle Refueling Property Credit for Individuals", Internal Revenue Service, irs.gov. Automakers and utilities increasingly highlight bidirectional charging, with GM Energy’s V2H platform powering homes for up to 20 hours during outages. Utility pilots in California demonstrate how vehicle-to-grid services can monetize parked EV batteries and smooth demand peaks. Finally, smart, networked devices now dominate new residential deployments, enabling dynamic load management that avoids expensive panel upgrades and aligns charging with clean-energy generation or low-tariff periods.
Key Report Takeaways
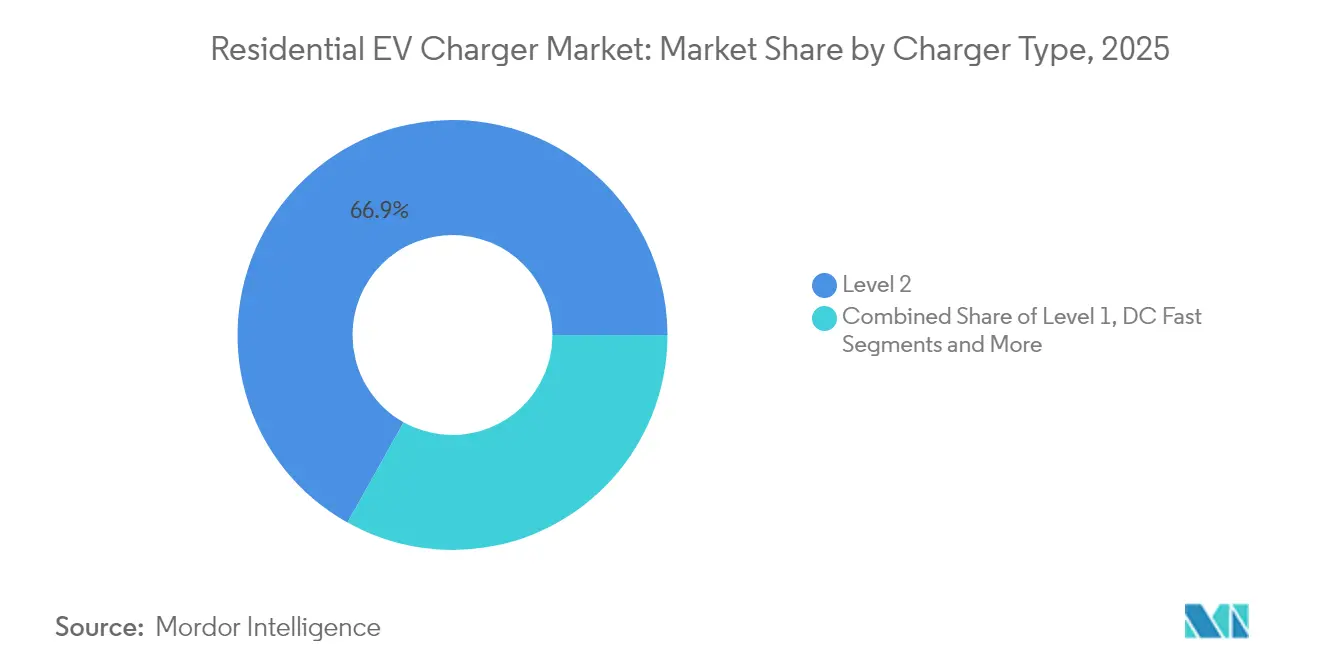
- By charger type, Level 2 equipment held 66.88% of 2025 revenue, whereas wireless systems are projected to rise at a 33.39% CAGR between 2026-2031.
- By vehicle type, passenger cars captured 91.85% of 2025 demand; two-wheelers and micromobility are expected to grow the fastest at a 29.19% CAGR to 2031.
- By charging-station power band, medium-power (3.8-11 kW) models led with 43.46% share in 2025, while high-power units are set to post a 22.33% CAGR through 2031.
- By connectivity, smart chargers commanded 64.55% revenue in 2025 and should expand at 20.78% CAGR during the forecast.
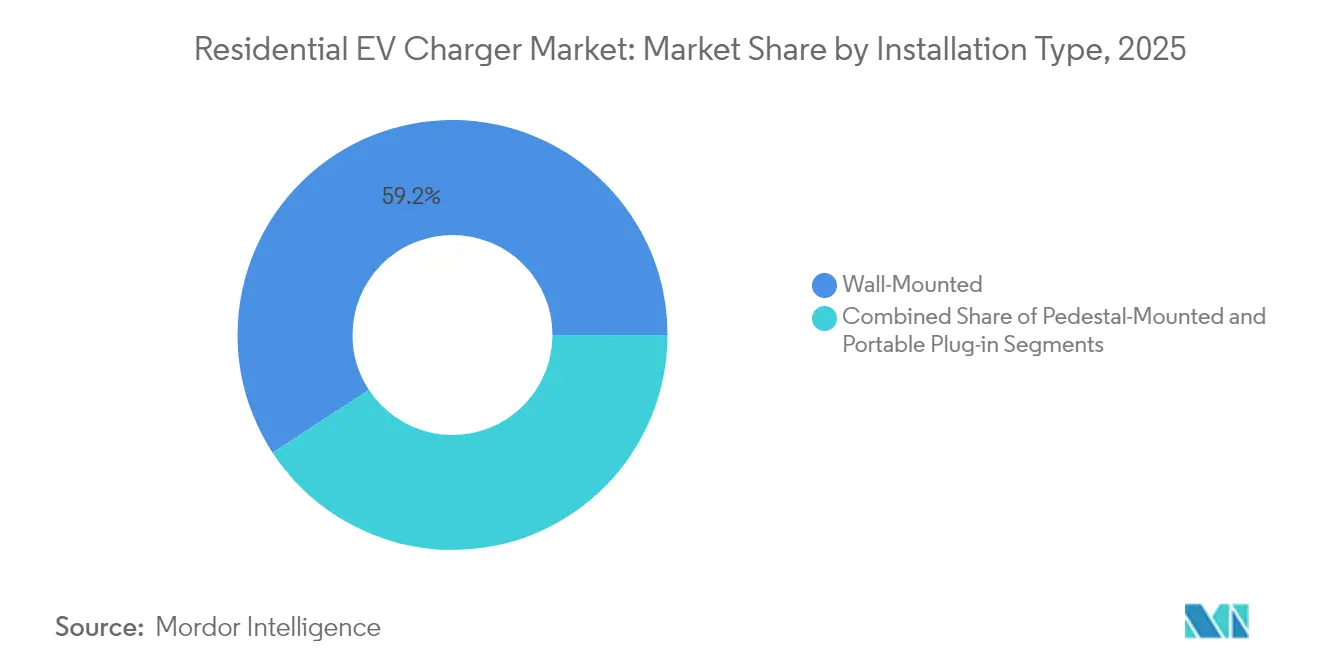
- By installation type, Wall-mounted solutions captured 59.22% of market share in 2025, however portable plug-in units, are growing at 18.8% CAGR by 2031.
- By purchase channel, OEM bundled accounts for 46.42% of market share in 2025, whereas specialist EV installers are climbing at 17.81% CAGR between 2026 to 2031.
- By geography, Asia-Pacific dominated with 39.48% 2025 share; the Middle East and Africa will log the highest 16.74% CAGR to 2031.
Note: Market size and forecast figures in this report are generated using Mordor Intelligence’s proprietary estimation framework, updated with the latest available data and insights as of 2026.
Global Residential EV Charger Market Trends and Insights
Drivers Impact Analysis*
| Driver | (~) % Impact on CAGR Forecast | Geographic Relevance | Impact Timeline |
|---|---|---|---|
| Rising EV Adoption | +8.5% | Global, with APAC and North America leading | Medium term (2-4 years) |
| Government Incentives for Home Charging | +6.2% | North America & EU core, | Short term (≤ 2 years) |
| Falling Charger Hardware Costs | +4.8% | Global, with manufacturing scale benefits in APAC | Medium term (2-4 years) |
| Residential Solar-Plus-Storage Uptake | +3.1% | North America, EU, Australia with high solar penetration | Long term (≥ 4 years) |
| Second-Hand EV Aftermarket Demand | +2.4% | Global, with early adoption in developed markets | Long term (≥ 4 years) |
| V2H / V2G Monetisation Opportunities | +1.7% | North America & EU regulatory frameworks, | Long term (≥ 4 years) |
| Source: Mordor Intelligence | |||
Rising EV adoption
More than 25 million private chargers will be needed in the United States alone by 2030 to support a projected 33 million EVs. China’s target for EVs to reach 45% of new-car sales in 2025 amplifies regional momentum and underscores the critical link between vehicle uptake and residential infrastructure. Rapid adoption is no longer limited to leading markets; Jordan exceeded 66% EV sales in Q1-2024 after tax exemptions spurred a surge in imports. Consistent with International Energy Agency findings, more than 90% of UK owners already rely on home charging, reinforcing the primacy of residential access[2]"Global EV Outlook 2024: Outlook for Electric Vehicle Charging Infrastructure", International Energy Agency, iea.org.
Government incentives for home charging
Tax credits, building codes and infrastructure mandates together lower up-front costs and guarantee long-term demand for home equipment. In the United States, individuals can offset 30% of qualified installation expenses, capped at USD 1,000, through 2032[3]"Alternative Fuel Vehicle Refueling Property Credit for Individuals", Internal Revenue Service, irs.gov. California tightens the policy net by requiring every new dwelling to include EV-ready circuits from 2026, while the EU’s Energy Performance of Buildings Directive obliges new multi-space residential structures to fit charging or at least pre-cabling. Mandatory public-road charging every 60 km under the Alternative Fuels Infrastructure Regulation creates further confidence for homeowners considering overnight charging solutions.
Falling charger hardware costs
Economies of scale at Asian factories, cheaper battery cathodes and integrated load-management electronics push average selling prices lower each year. Argonne National Laboratory projects U.S. battery costs sliding toward USD 86 per kWh by 2035, reinforcing a downward trajectory for associated charging electronics. Emporia’s Pro charger retails for USD 599 with built-in load management, illustrating how smart features now arrive at mid-market price points. Siemens’ USD 25 million stake in WiTricity highlights how investment capital accelerates cost reductions in wireless technology.
Residential solar-plus-storage uptake
Coupling rooftop PV, batteries and EV chargers lets households arbitrage tariffs and ride through grid outages. A 4 kW solar-based hybrid station can refuel 10-12 EVs daily and even export surplus power, improving payback on solar arrays. Schneider Electric integrates these assets into a single energy platform, simplifying monitoring and bringing prosumer capabilities into the mainstream.
Restraints Impact Analysis*
| Restraint | (~) % Impact on CAGR Forecast | Geographic Relevance | Impact Timeline |
|---|---|---|---|
| High Installation Cost | -2.30% | Global, with higher impact in price-sensitive markets | Short term (≤ 2 years) |
| Legacy Home electrical-Panel Limits | -1.80% | North America & older EU housing stock | Medium term (2-4 years) |
| Permit and Inspection Delays | -1.20% | North America regulatory jurisdictions | Short term (≤ 2 years) |
| Cyber-Security Vulnerabilities in Smart Chargers | -0.90% | Global, with higher concern in developed markets | Medium term (2-4 years) |
| Source: Mordor Intelligence | |||
High installation cost
Beyond the charger, households can face several thousand dollars in panel or service-line upgrades, delaying payback and slowing adoption. Multifamily residents encounter added complexity when parking bays lack sufficient electrical feeds, a gap now addressed by dynamic load-sharing products that minimise upfront work. Utilities such as PG&E apply grid-edge intelligence to curb those expenses, offering real-time control that keeps upgrade requirements modest.
Legacy home electrical-panel limits
Millions of pre-2000 homes cannot accommodate a dedicated 40-amp circuit without rewiring, prompting early consultations with utilities like the Los Angeles Department of Water and Power. Standards development for power-control systems, notably UL 3141, is expected by 2026 to legitimise multi-appliance load management and reduce expensive service upgrades.
*Our forecasts treat driver/restraint impacts as directional, not additive. The impact forecasts reflect baseline growth, mix effects, and variable interactions.
Segment Analysis
By Charger Type: Level 2 Dominance Meets Wireless Momentum
Level 2 devices commanded 66.88% of 2025 revenue, reflecting their overnight-charging convenience and compatibility with existing 240 V circuits. This slice of the residential EV charging market will persist thanks to modest equipment costs, established installation protocols and rising vehicle battery capacities that make Level 1 gear less attractive. Meanwhile the wireless segment is on a 33.39% CAGR path, spurred by consumer preference data showing 96% of buyers view cable-free charging as ideal.
Tesla’s patent work underscores growing OEM interest, and SAE’s 2024 standard now offers a foundation for interoperable designs. As component cost curves drop, wireless solutions can erode perceived complexity, particularly for older or mobility-limited drivers. Because power delivery scales up to 11 kW in forthcoming home pads, dwell times remain comparable with wired Level 2 units, minimizing range anxiety while elevating user convenience.


By Vehicle Type: Passenger-Car Core with Micromobility Upside
Passenger cars drove 91.85% of 2025 unit sales, anchoring the residential EV charging market, reflects mature incentive structures and mass-market model availability. Light commercial fleets will gain traction as urban delivery mandates multiply, but remain secondary through the medium term.
Micromobility formats—e-scooters, e-bikes and related platforms—are tracking a 29.19% CAGR because low-power batteries enable flexible, decentralized charging. These vehicles present unique infrastructure challenges, prompting innovation in compact, shared or solar-assisted dock systems. Flexible battery-swap schemes and wireless induction pads tailored to two-wheelers should open fresh revenue streams in dense urban centres where passenger-car ownership is limited.
By Charging-Station Power Band: Medium Strength, High-Power Surge
Medium systems in the 3.8–11 kW range secured 43.46% 2025 revenue, a proportion that sets the performance benchmark for mainstream homeowners. They offer a full battery overnight without over-burdening typical 200-amp panels, underpinning much of the residential EV charging market share attained by smart, load-controlled devices. Low-power units below 3.7 kW will retreat as battery capacities widen.
High-power stations above 11 kW are forecast to compound at 22.33% CAGR, moving the residential EV charging market size for this niche. Falling silicon-carbide inverter costs, plus growing three-phase supply in new construction, drive that appetite. High-rate equipment also aligns with bidirectional needs: feeding a whole home during grid failures requires robust discharge rates best served by high-power ports.
By Connectivity: Smart Chargers Anchor Grid Services
Smart models held 64.55% 2025 revenue thanks to open protocols such as OCPP 2.0.1, utility demand-response incentives and homeowner interest in tariff optimisation. WeaveGrid’s software tie-up with Emporia shows how cloud analytics balance grid stress while lowering consumer bills.
The segment’s 20.78% CAGR rests on deeper integration with rooftop solar, stationary batteries and demand-response markets. Firmware updates already allow chargers to follow real-time marginal-cost signals, unlocking new revenue and accelerating customer payback. Non-networked devices will persist in budget or off-grid settings but will lose relative share as smart premium falls below USD 50 per unit.
By Installation Type: Wall-Mount Prevalence, Portable Flexibility
Wall-mounted solutions captured 59.22% of 2025 revenue, long favored for tidy garage fits and direct conduit runs to panels. Combined with simple drip-covers, these units satisfy insurance and local-code criteria across most climates, ensuring entrenched position in the residential EV charging market.
Portable plug-in units, however, are growing at 18.8% CAGR, appealing to renters, apartment dwellers and traveling professionals alike. Their value proposition rests on avoiding permit delays and giving users resiliency in emergencies when fixed equipment may be offline. Recent innovations have shrunk form factors while lifting power to 9.6 kW, blurring lines with permanent installs and inviting wider uptake.
By Purchase Channel: OEM Bundling Retains the Lead
Automakers bundled nearly 46.42% of 2025 home equipment, leveraging showroom influence and ensuring brand-authorized compatibility. Integrating installation services into the vehicle finance package simplifies the customer path and maintains a critical lock-in advantage for OEMs within the residential EV charging market.
Specialist EV installers and dedicated retail outlets are climbing at 17.81% CAGR. As home charging evolves into an energy-system upgrade, buyers increasingly rely on experienced electricians versed in solar, storage and load-management design. Partnerships like ChargePoint’s program with Airbnb show how niche channels target unique user cohorts and raise overall adoption.
Geography Analysis
Asia-Pacific led with 39.48% 2025 share after China’s government backed unified charging standards that support mass production efficiencies and compressed installation costs. Japan’s early embrace of vehicle-to-home backup, alongside high rooftop solar penetration in Australia, further cements regional leadership. India lags on home-charger penetration—only 55% of EV owners have private access—but strong policy pushes and local manufacturing incentives make it pivotal for future volume.
North America is powered by federal tax incentives and active state mandates. California alone counts more than 2 million registered EVs and will require chargers at every new dwelling within 12 months of certificate-of-occupancy issuance. Canadian pilots on V2G reinforce the region’s path toward grid-service monetisation while sparking demand for bidirectional-ready hardware. Europe follows close behind, driven by the Alternative Fuels Infrastructure Regulation and strict building directives that oblige chargers in both new and renovated properties. Cyber-security mandates—such as the UK’s anti-tampering rules—are shaping hardware specs and favoring established suppliers with deep compliance expertise. The Middle East and Africa, though smaller today, is the fastest-growing region advancing at 16.74% CAGR to 2031, the UAE plans 10,000 public and residential chargers by 2030 to meet its 50% EV-fleet target.

Competitive Landscape
Industry concentration is moderate, Tesla led 2024 residential volume, extending its vehicle-owner ecosystem; Wallbox followed after acquiring ABL and adding more than 1 million European installs. Schneider Electric differentiates via integrated home-energy management, bundling solar, storage and charger control within a single platform.
Mergers and acquistion activity is accelerating as suppliers seek scale, portfolio breadth and geographic reach. Wallbox’s EUR 15 million ABL purchase gave it German production and a stronger presence in utility tenders. Eaton and ChargePoint forged a first-of-its-kind alliance pairing switchgear with charge-point hardware, streamlining design and permitting for installers. Patent filings on wireless pads, load-balancing algorithms and bidirectional interfaces illustrate a technology race favouring firms with cross-domain skill sets.
Cost barriers linked to panel upgrades continue to challenge expansion, yet software-defined load control is closing the gap. Companies such as Emporia now embed current-sensing modules in chargers, dynamically allocating household power without extra copper runs. As standardisation of power-control protocols matures, additional players will enter, keeping prices in check and sustaining healthy competition.
Residential EV Charger Industry Leaders
-
Tesla, Inc.
-
ChargePoint, Inc.
-
ABB Ltd.
-
Schneider Electric SE
-
Wallbox N.V.
- *Disclaimer: Major Players sorted in no particular order

Recent Industry Developments
- May 2025: Eaton and ChargePoint announced an integrated-infrastructure partnership covering the United States, Canada and Europe.
- April 2025: ABB E-mobility released the A200/300 All-in-One chargers plus ChargeDock Dispenser to cut total cost of ownership.
- January 2025: Schneider Electric debuted Charge Pro, a commercial-grade charger tailored to multifamily residences with remote monitoring.
- November 2024: Eaton partnered with Treehouse to blend AI-driven software with electrical hardware for easier home electrification.


Research Methodology Framework and Report Scope
Market Definitions and Key Coverage
Our study defines the residential EV charger market as the sale of new alternating or direct current devices up to 22 kW that are permanently or semi permanently installed at single-family homes and multi-unit dwellings to replenish electric passenger vehicles overnight or during extended parking.
Scope Exclusions: Portable emergency cables, public or workplace charge points, and post-sale maintenance services are outside this scope.
Segmentation Overview
-
By Charger Type
- Level 1 ( Up to 1.9 kW)
- Level 2 (2- 22 kW)
- DC Fast (50 kW and Above)
- Wireless / Inductive
-
By Vehicle Type
- Passenger Cars
- Light Commercial Vehicles
- Two-Wheelers / Micro-mobility
-
By Charging-Station Power Band
- Low ( Up to 3.7 kW)
- Medium (3.8 - 11 kW)
- High (Above 11 kW)
-
By Connectivity
- Smart / Networked
- Non-Smart
-
By Installation Type
- Wall-Mounted
- Pedestal-Mounted
- Portable Plug-in
-
By Purchase Channel
- OEM Bundled
- EV Dealerships
- Online Retail
- Specialist EV Stores / Installers
-
By Geography
-
North America
- United States
- Canada
- Rest of North America
-
South America
- Brazil
- Argentina
- Rest of South America
-
Europe
- Germany
- United Kingdom
- France
- Italy
- Spain
- Russia
- Rest of Europe
-
Asia-Pacific
- China
- Japan
- India
- South Korea
- Australia
- Rest of Asia-Pacific
-
Middle East and Africa
- Saudi Arabia
- United Arab Emirates
- Turkey
- South Africa
- Egypt
- Rest of Middle East and Africa
-
North America
Detailed Research Methodology and Data Validation
Primary Research
Mordor analysts interviewed charger OEM product managers, residential installers, utilities, and EV owner associations across North America, Europe, China, and emerging ASEAN markets. These conversations validated household adoption curves, average selling prices, and failure rate assumptions that secondary sources could only hint at, letting us fine tune penetration and replacement cycles.
Desk Research
We began with public datasets such as the IEA Global EV Outlook, the US DOE Alternative Fuels Data Center, Eurostat trade filings, and China Customs import codes to size charger flows and price bands. Industry bodies such as the Electric Drive Transportation Association and AVERE supplied installation ratios, while peer-reviewed journals clarified load management efficiencies. To benchmark manufacturer revenues and shipment splits, we tapped paid databases that Mordor analysts subscribe to, including D&B Hoovers for company financials and Dow Jones Factiva for recent expansion news. This list is illustrative; several other open and subscription sources informed data checks and context building.
A second desk research wave collated regulatory triggers, home charger subsidies, building code mandates, and metering tariffs across 30 major EV nations; these inputs framed scenario bounds and ensured country models aligned with policy momentum.
Market-Sizing & Forecasting
A top down pool of installed EV stock by country is rebuilt from registration data and adjusted by our surveyed 'home charging share.' That demand pool is multiplied by weighted replacement and first fit rates, then cross checked with bottom up samples of supplier shipments and installer invoices. Key variables like EV parc growth, single-family housing mix, charger subsidy value, average unit price, and smart charger uptake feed a multivariate regression that projects demand through 2030. Where installer data were patchy, we bridged gaps with median ASPs from online retail trackers and regional proxy ratios derived from similar appliance roll outs.
Data Validation & Update Cycle
Model outputs pass three reviews: variance checks versus import records, peer analyst audits, and a reconciliation against electricity meter connections. Reports refresh annually, with interim tweaks when subsidy structures or major code revisions materially shift the outlook. Before delivery, an analyst conducts a last minute news sweep so clients receive our latest view.
Why Mordor's Residential EV Charger Baseline Deserves Decision-Maker Confidence
Published numbers differ because some publishers fold in commercial stations, others blend hardware with services, and several use outdated EV stock baselines.
By selecting a charger only lens, applying live ASP sampling, and revisiting inputs every twelve months, Mordor produces a balanced midpoint, neither overly bullish nor cautious, that executives can trace back to observable levers.
Benchmark comparison
| Market Size | Anonymized source | Primary gap driver |
|---|---|---|
| USD 9.68 B (2025) | Mordor Intelligence | - |
| USD 14.49 B (2024) | Global Consultancy A | Includes public and workplace units, older currency rates |
| USD 4.20 B (2024) | Industry Journal B | Excludes multi-unit dwellings and uses conservative EV stock forecast |
The comparison shows that figures swing mainly on scope breadth, housing type coverage, and refresh cadence.
By anchoring estimates to clear device definitions and policy aligned variables, Mordor delivers a transparent, reproducible baseline that planners can rely upon with confidence.


Key Questions Answered in the Report
How large is the residential EV charging market in 2026?
The residential EV charging market size stands at USD 12.23 billion in 2026.
What annual growth rate is projected through 2031?
Market value is expected to rise at a 26.35% CAGR, reaching about USD 39.4 billion by 2031.
Which charger type leads current sales?
Level 2 equipment dominates with 66.88% 2025 revenue, due to overnight-charging capability and compatibility with typical home circuits.
Which region is growing fastest?
The Middle East and Africa will expand at roughly 16.74% CAGR between 2026-2031, led by the UAE’s aggressive infrastructure goals.
What is the main barrier to wider adoption?
High installation costs, particularly panel-upgrade expenses, slow adoption but are being mitigated by smart load-management solutions.
Who are the market leaders?
Tesla, followed by Wallbox, and Schneider Electric collectively shaping a moderately concentrated landscape.
Page last updated on:


