Market Overview
| Study Period | 2019 - 2031 |
|---|---|
| Forecast Data Period | 2026 - 2031 |
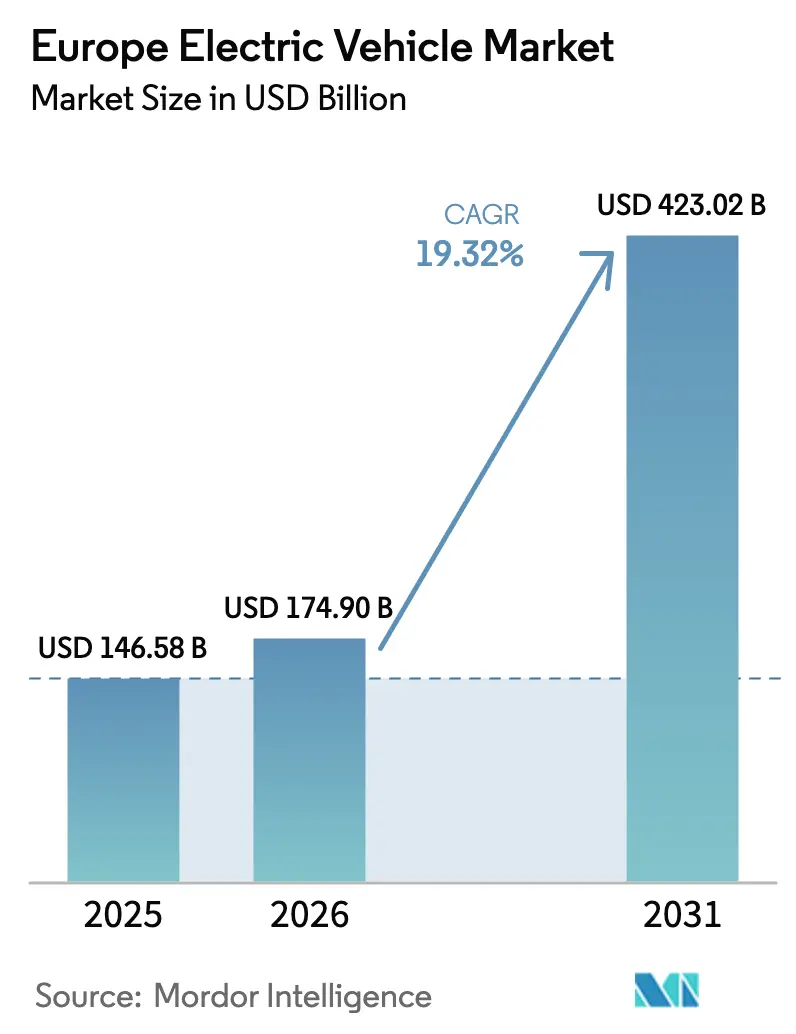
| Base Year Market Size (2025) | USD 146.58 Billion |
| Market Size (2026) | USD 174.90 Billion |
| Market Size (2031) | USD 423.02 Billion |
| Growth Rate (2026 - 2031) | 19.32% CAGR |
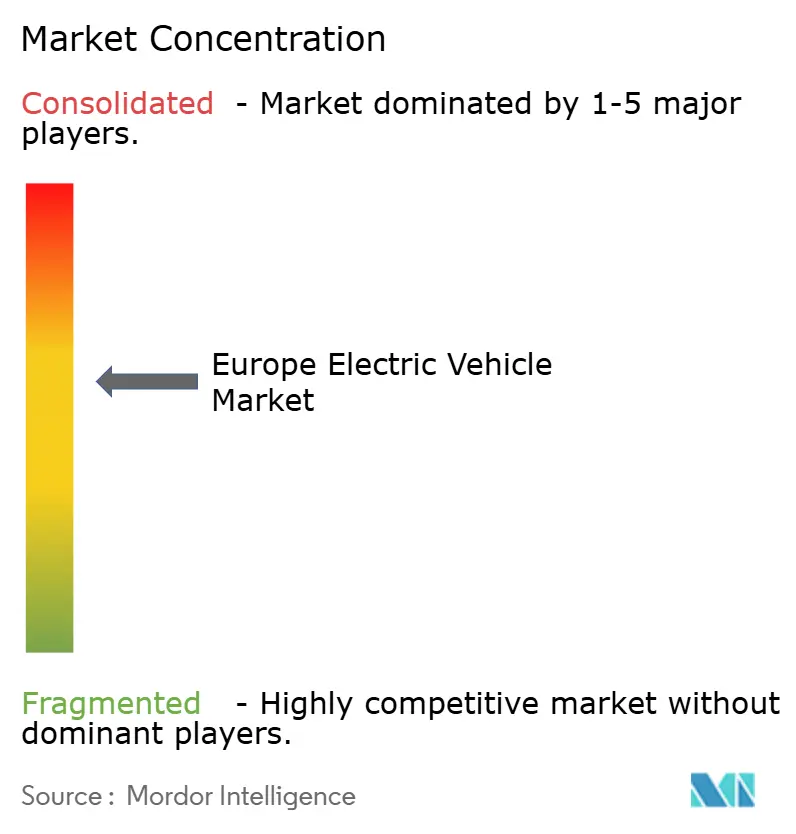
| Market Concentration | Medium |
Major Players*Disclaimer: Major Players sorted in no particular order Image © Mordor Intelligence. Reuse requires attribution under CC BY 4.0. | |
Europe Electric Vehicle Market Analysis by Mordor Intelligence
The European electric vehicle market size is expected to grow from USD 146.58 billion in 2025 to USD 174.90 billion in 2026 and is forecast to reach USD 423.02 billion by 2031 at a 19.32% CAGR over 2026–2031. The scale-up reflects binding EU carbon-reduction policies, sharp declines in battery costs, and the region’s expanding public-charging footprint. Battery electric vehicles already dominate volumes and margins, while high-voltage drivetrains, permanent-magnet synchronous motors, and lithium-iron-phosphate chemistries are shaping next-generation cost curves. Automakers are prioritizing dedicated EV architectures, Chinese entrants are compressing price points, and policy-aligned fleet commitments are accelerating demand across light commercial segments. Financing and residual-value innovation are lowering ownership barriers in price-sensitive sub-regions as the European electric vehicle market deepens its structural transition.
Key Report Takeaways
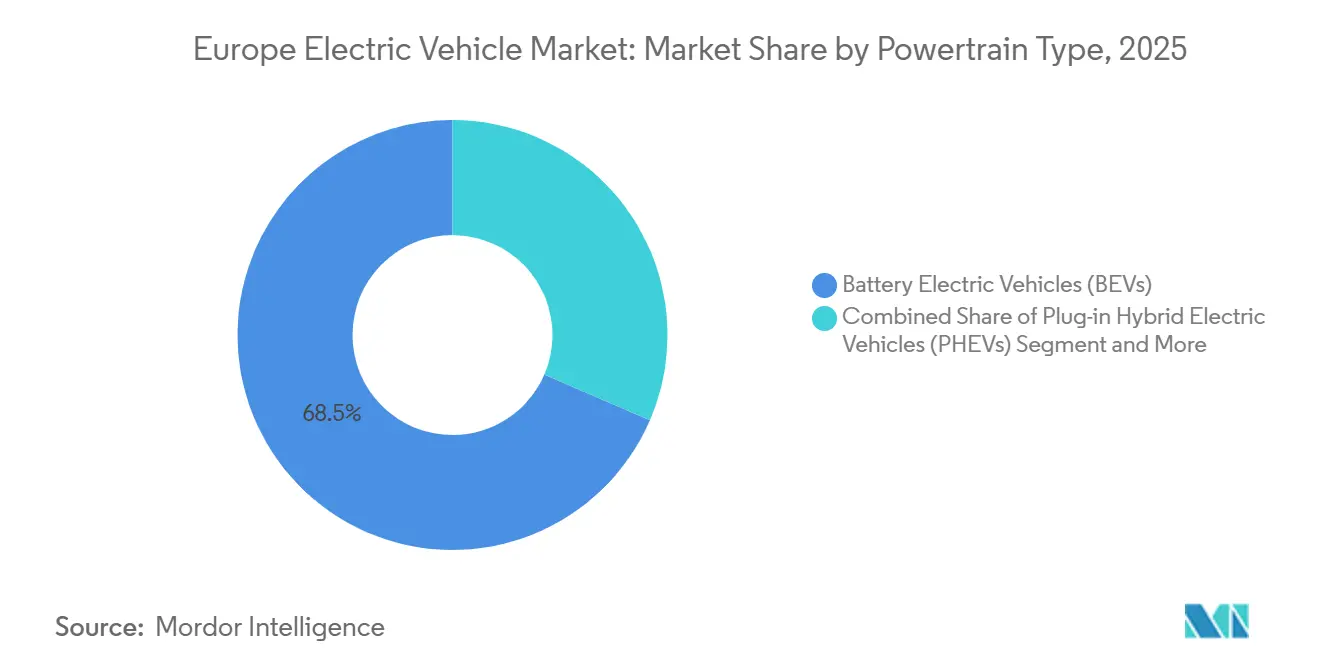
- By powertrain, battery electric vehicles captured 68.52% of the European electric vehicle market share in 2025 and are forecast to expand at a 20.62% CAGR through 2031.
- By vehicle type, commercial vehicles accounted for 17.59% of the 2025 volume, yet they are projected to register the fastest growth of 23.31% CAGR over the forecast period.
- By battery chemistry, NMC commanded 44.37% revenue share in 2025, while LFP is expected to post a 22.29% CAGR to 2031.
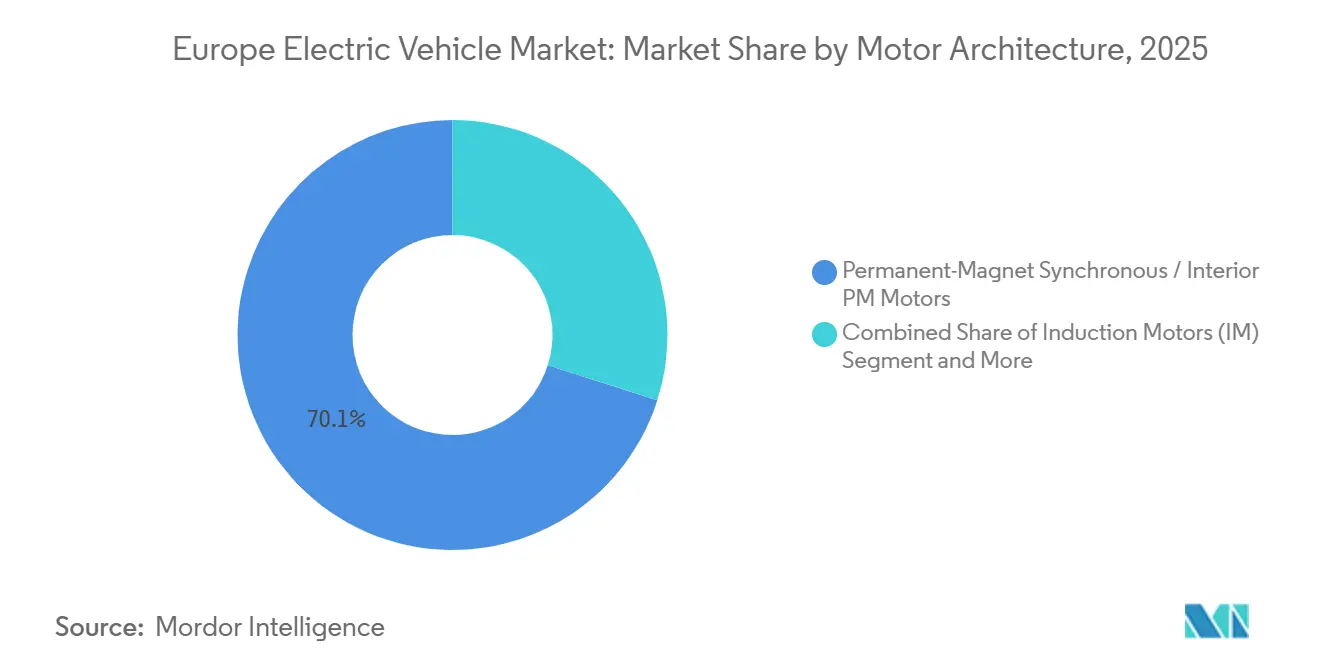
- By motor architecture, permanent-magnet synchronous motors led with a 70.09% share in 2025 and are expected to maintain a similar share through 2031, broadly in line with the total market’s 19.32% CAGR.
- By range, mid-range models (200-400 km) accounted for 40.61% of 2025 sales, whereas long-range variants (400-600 km) are set to grow at a 21.74% CAGR to 2031.
- By voltage architecture, mid-voltage systems (200-400 V) held 43.44% share in 2025, while high-voltage platforms (400-800 V) are projected to advance at a 21.26% CAGR by 2031.
- By country, Germany contributed 28.76% of 2025 revenue, whereas Spain is forecast to achieve the highest 21.86% CAGR through 2031.
Note: Market size and forecast figures in this report are generated using Mordor Intelligence’s proprietary estimation framework, updated with the latest available data and insights as of January 2026.
Market Trends and Insights
Drivers Impact Analysis of Europe Electric Vehicle Market*
| Driver | (~) % Impact on CAGR Forecast | Geographic Relevance | Impact Timeline |
|---|---|---|---|
| Declining Battery USD/kWh and Higher Density | +4.1% | Western Europe | Long term (≥ 4 years) |
| EU CO₂ Targets and 2035 ICE Phase-Out | +3.5% | EU27, United Kingdom, Norway | Medium term (2-4 years) |
| Expansion of EU-Funded Public Charging | +3.2% | Germany, France, Spain, Benelux | Short term (≤ 2 years) |
| Corporate Fleet Electrification Mandates | +2.8% | Germany, United Kingdom, France, Netherlands | Medium term (2-4 years) |
| Battery-Passport Rules Boosting EU Cell Plants | +2.1% | France, Germany, Spain, Poland, Hungary | Medium term (2-4 years) |
| Vehicle-to-Grid Revenue for Fleets | +1.6% | Germany, Netherlands, Denmark, United Kingdom | Long term (≥ 4 years) |
| Source: Mordor Intelligence | |||


Declining Battery USD/kWh and Rising Energy Density
Average pack costs have decreased significantly, driven by the scaling of larger cathode plants, the substitution of LFP, and the adoption of streamlined cell-to-pack formats. CATL's Qilin architecture, now licensed by major automotive manufacturers for future launches, delivers a notable improvement in pack-level output compared to previous modular designs. While solid-state prototypes have demonstrated impressive energy density in laboratory settings, mass production is anticipated to occur later. This enhanced density enables vehicles to achieve longer ranges with more miniature packs, reducing vehicle mass and improving efficiency, which helps narrow the lifetime cost differences with traditional powertrains.
EU CO₂ Targets and 2035 ICE Phase-Out Deadlines
The binding 2035 prohibition on new internal-combustion registrations removes strategic uncertainty, forcing automakers to front-load capital into battery-electric platforms. Fleet-average CO₂ thresholds tighten to 93.6 g/km in 2025, with EUR 95 penalties per excess gram applied to annual deliveries, exposing multibillion-euro risks for non-compliant OEMs [1]“Fit for 55: further strengthening CO₂ emission performance standards for new cars and vans,”, European Commission, europa.eu. Volkswagen already provisioned EUR 1.5 billion in 2024 for potential fines, illustrating the regulation’s balance-sheet impact. While ultra-low-volume marques enjoy exemptions, luxury producers benefit, leaving mainstream brands without such relief. This disparity accelerates platform consolidation and the pooling of emissions credits. Consequently, the policy fuels both model proliferation and supplier rationalization in Europe's electric vehicle market. As capital shifts away from internal-combustion research, it bolsters battery innovation pipelines, solidifying a zero-emission lead by the end of the decade.
Rapid Expansion of EU-Funded Public Charging Networks
By 2027, the Alternative Fuels Infrastructure Regulation requires the installation of a 400 kW public fast charger every 60 km along core corridors, effectively addressing previous coverage gaps [2]“Alternative Fuels Infrastructure Regulation,”, European Commission, europa.eu. In 2024, Germany introduced 23,000 new DC fast chargers, while France added 18,000, bringing the total in the EU27 to approximately 150,000 high-power charging points. Operators like Ionity and Fastned have implemented software-driven pricing strategies, successfully reducing congestion during peak hours by 30%. Thanks to the interoperable payment standards introduced under AFIR, the previous fragmentation caused by multiple apps—often a deterrent for occasional long-distance users—has been resolved. This enhanced visibility and convenience significantly reduce perceived risks, particularly in markets where first-time buyers are transitioning into the European electric vehicle landscape.
Corporate Fleet Electrification Mandates
Germany’s climate law obliges all federal and state fleets to purchase exclusively zero-emission vehicles by 2030, securing roughly 300,000 units of demand. The United Kingdom offers a 100% first-year capital allowance on zero-emission commercial vehicles until 2028, resulting in GBP 6,000-8,000 in tax relief per unit for standard-rate corporate taxpayers. Total-cost-of-ownership parity is achieved at 80,000 km of annual mileage for light-duty vans, which is significantly lower than the 120,000 km typical of parcel fleets. Leasing majors, including ALD Automotive and LeasePlan, pledge that 50% of new contracts will be BEVs by 2025, ensuring a steady pipeline for secondary-market volumes that further broaden the European electric vehicle market.
Restraints Impact Analysis of Europe Electric Vehicle Market*
| Restraint | (~) % Impact on CAGR Forecast | Geographic Relevance | Impact Timeline |
|---|---|---|---|
| Up-Front EV Price Premium in CEE | -1.4% | Poland, Czech Republic, Hungary, Romania, Baltics | Short term (≤ 2 years) |
| Critical-Mineral Supply Risk | -1.2% | EU27, United Kingdom | Long term (≥ 4 years) |
| Rural Fast-Charging Coverage Gaps | -0.9% | Spain, France, Poland, Scandinavian rural areas | Medium term (2-4 years) |
| Shortage of High-Voltage Repair Technicians | -0.7% | Germany, France, Italy, Spain | Medium term (2-4 years) |
| Source: Mordor Intelligence | |||
Up-Front EV Price Premium in Central and Eastern Europe
In recent times, average transaction prices for battery electric vehicles (BEVs) in Poland and Hungary have significantly exceeded the median household income, with a much lower ratio observed in Germany [3]“Median equivalised net income 2024,”, Eurostat, ec.europa.eu. Poland's "Mój Elektryk" grant, which has a capped allocation, supports a limited number of vehicles annually. However, the allocated funds are typically depleted shortly after each application window opens. The supply of used cars remains limited, and resale values after a few years stay high compared to their original prices, leading to increased leasing rates. While Chinese brands offer more affordable models, their dealer networks are not yet widespread. These affordability challenges are expected to hinder the short-term growth of the electric vehicle market in Europe unless credit penetration and subsidy budgets expand.
Critical-Mineral Supply Risk Under the Due-Diligence Act
Under the Corporate Sustainability Due Diligence Directive, automakers face fines if they fail to ensure their supply chains comply with environmental and human rights standards. The Democratic Republic of the Congo, which is responsible for a significant portion of the world's cobalt supply, faces significant labor-practice issues in artisanal mining, accounting for a notable share of its output. While the Commission mandates that a substantial portion of the EU's annual cobalt demand be processed domestically, current refining capacity remains minimal. This shortfall necessitates significant additional investment, a sum that competes directly with budgets for cell plants. Moves towards vertical integration, exemplified by Mercedes-Benz's investment in a German lithium refinery, offer only a partial shield against these challenges.
*Our forecasts treat driver/restraint impacts as directional, not additive. The impact forecasts reflect baseline growth, mix effects, and variable interactions.
Europe Electric Vehicle Market Segment Analysis
By Powertrain:
Regulatory Deadlines Accelerate BEV DominanceBattery electric vehicles commanded 68.52% of the European electric vehicle market in 2025 and are expected to maintain a 20.62% CAGR through 2031 as internal-combustion engine sales decline. Plug-in hybrids lose strategic relevance because compliance credit fades and real-world emissions exceed laboratory results. Fuel-cell volumes remain niche, given the 250 hydrogen stations in Europe.
Continuous battery-cost compression aligns the total cost of BEVs with that of diesel at high-utilization thresholds, thereby strengthening fleet uptake. The looming 2035 ban locks capital into all-electric platforms, and model portfolios indicate a phased wind-down of PHEVs by 2029. The European electric vehicle market, therefore, pivots from transitional powertrains toward full electrification across all volume brackets.


By Vehicle Type:
Commercial Fleets Become the Growth EnginePassenger cars still accounted for 82.41% of 2025 deliveries, yet commercial vehicles are expected to outpace them at a 23.31% CAGR through 2031 as zero-emission city zones influence fleet purchase cycles. Light-duty vans reach operating-cost parity at 80,000 km per year thanks to lower energy and maintenance expenses.
High-capacity electric buses and medium-duty trucks are advancing with municipal procurement mandates and weight-optimized 600 kWh packs, targeting routes of up to 500 km. SUV and crossover architectures dominate passenger adoption due to packaging flexibility for larger batteries, while premium sedans reserve long-range margins. These dynamics diversify demand pools within the European electric vehicle market.
By Battery Chemistry:
LFP Expands on Cost AdvantageNMC delivered 44.37% of pack installations in 2025, with a density of 200-250 Wh/kg, which supports 500-km vehicles. LFP, however, is forecast to grow at a 22.29% annual rate through 2031 as Tesla, Volkswagen, and Stellantis deploy unified cell formats to push entry-level sticker prices below EUR 25,000.
LFP’s 3,000-cycle durability underpins 10-year warranties and stronger residual values, traits attractive to corporate fleets. NCA remains concentrated in ultra-premium long-range vehicles. Emerging chemistries such as LMFP lift density 15% above standard LFP and enable further cost moderation. Cost-driven chemistry shifts will shape the European electric vehicle market size across mass segments equitably.
By Motor Architecture:
Efficiency Sustains PMSM SupremacyPermanent-magnet synchronous motors held 70.09% share in 2025 and will advance at 19.92% CAGR. Their 92-95% efficiency delivers an extended urban range, and compact design preserves cabin volume. Supply exposure to neodymium prompts parallel research into magnet-free induction and wound-rotor solutions.
Induction motors supply 22% of units, favored for rear-axle torque without the use of rare earths, while axial-flux designs address niche performance targets. Diversified motor roadmaps reduce raw-material risk without eroding the efficiency premium that secures PMSM leadership in the European electric vehicle market.
By Range:
Long-Range Variants Capture Premium DemandMid-range models (200-400 km) accounted for 40.61% of 2025 registrations, aligning with the average daily driving needs in Europe. Long-range vehicles (400-600 km) are expected to expand by 21.74% per year through 2031, as declining battery costs enable wider price accessibility.
A strong psychological preference for extended driving range allows automakers to command significant price premiums over mid-range trims. While short-range microcars play a crucial role in urban sharing schemes, they face the threat of margin compression as the cost of longer-range battery modules declines. Consequently, this range stratification creates distinct price segments within the European electric vehicle market.
By Voltage:
800-Volt Systems Normalize Fast ChargingMid-voltage 400 V platforms represented 43.44% of installations in 2025; however, 800 V architectures are expected to grow at a rate of 21.26% annually as networked 350 kW chargers scale. Higher voltage halves charging current, reducing thermal loss and cable mass.
Stellantis and Hyundai embed 800V across their upcoming midsize lines, promising 10-minute 300km top-ups that align with driver expectations formed by gasoline refueling. Ultra-high voltage remains a luxury-segment territory until component and insulation costs fall. Voltage migration underpins user-experience gains that will fortify the European electric vehicle market.
Geography Analysis
Germany and Spain Electric Vehicle Market
Germany supplied 28.76% of 2025 revenue. Volkswagen has committed a substantial budget to electrification, bolstered by the installation of numerous public DC chargers. While the removal of a purchase incentive initially dampened volumes, the market stabilized as infrastructure expanded and model offerings diversified. Spain will register the fastest 21.86% CAGR, thanks to dual gigafactory projects in Valencia and Zaragoza, which secure domestic supply and create 6,000 direct jobs.
France and United Kingdom Electric Vehicle Market
France, with a significant share, benefits from an ecological bonus that applies to vehicles manufactured within the European Economic Area, effectively safeguarding local producers from import-induced price pressures. The United Kingdom, with a notable market share, is steering towards an ambitious goal: achieving high zero-emission vehicle penetration primarily through manufacturer sales quotas rather than direct consumer grants.
Norway and Romania Electric Vehicle Market
Norway, leveraging tax exemptions and toll waivers, has achieved remarkable penetration of Battery Electric Vehicles (BEVs) in its new-car sales, setting a gold standard for policy-driven adoption. Meanwhile, Central and Eastern Europe collectively command a smaller market share but grapple with challenges related to pricing and infrastructure. A stark contrast in public charger density highlights the uneven landscape: Norway boasts one charger for every few EVs, while Romania lags with significantly fewer chargers per vehicle.
Competitive Landscape
The top players dominate the scene, clinching a significant share of BEV registrations. Volkswagen Group, through its multiple brands, harnesses modular platforms, reaping scale economies that support both its entry models and its luxury variants. Meanwhile, Tesla, with its vertical integration of cells, software, and direct sales, enjoys high gross margins, granting it a pricing flexibility that dealer-reliant competitors lack.
Chinese players BYD, NIO, and SAIC Motor Europe are making waves by significantly reducing prices. Their edge comes from in-house production of batteries and semiconductors, insulating them from supply disruptions. As they expand in Europe, they're setting up new assembly sites and establishing after-sales services that circumvent the costs associated with traditional dealerships.
The European Patent Office has seen a surge of applications, predominantly centered on fast-charging and thermal management technologies. As compliance requirements for battery traceability loom, OEMs with the capability to internally audit their upstream chains stand to benefit, potentially sidelining smaller players. Such dynamics are shaping the consolidation trends in Europe's electric vehicle landscape.
Europe Electric Vehicle Industry Leaders
Groupe Renault
Tesla Inc.
Toyota Motor Corporation
Volkswagen AG
BMW AG
- *Disclaimer: Major Players sorted in no particular order
Europe Electric Vehicle Market Companies Covered in this Report
- BMW AG
- Groupe Renault
- Hyundai Motor Company
- Kia Corporation
- Mercedes-Benz Group AG
- Tesla Inc.
- Toyota Motor Corporation
- Volkswagen AG
- Volvo Car AB
- Stellantis N.V.
- BYD Company Ltd.
- NIO Inc.
- Ford Motor Company
- MG Motor Europe
- Rivian Automotive LLC

Recent Industry Developments in Europe Electric Vehicle Market
- December 2025: HKS Co., Ltd. (HKS) revealed its partnership with U.K.-based Caterham Cars Ltd. (Caterham Cars) to co-develop electric vehicles (EVs). HKS is set to supply its suspension for Caterham Cars' prototype electric sports coupe and will engage in vehicle analysis and other developmental aspects. This marks HKS's inaugural venture into developing components for an electric sports car, bolstering Caterham's EV initiative, “Project V.”
- December 2025: LG Energy Solution Ltd., the EV battery arm of LG Chem Ltd., clinched a USD 1.4 billion deal with Mercedes-Benz. This seven-year agreement, spanning from March 2028 to June 2035, mandates LG Energy Solution to supply batteries for Mercedes-Benz's electric vehicles in Europe and North America.
- November 2025: Porsche has introduced the Cayenne Electric and Cayenne Turbo Electric SUVs. Both models in the electric Cayenne lineup come with all-wheel drive and feature Porsche’s advanced electronic Traction Management system. The latest Cayenne measures 4,985mm in length, 1,980mm in width, and stands 1,674mm tall, boasting a wheelbase extended to 3,023 mm. It provides a generous rear cargo space ranging from 781 to 1,588 litres, complemented by a 90-litre front trunk. Depending on the configuration, the SUV has a towing capacity of up to 3.5 tons.


Europe Electric Vehicle Market Report Scope
The Europe electric vehicle market report is is segmented by powertrain (BEV, PHEV, and FCEV), vehicle Type (passenger car, and commercial vehicle), battery chemistry (LFP, NMC, and More), motor architecture (PMSM, induction, and others), range (short, mid, long, and ultra-long), voltage (low, mid, high, and ultra-high), and country. The market forecasts are provided in both value (USD) and volume (Units).
Segmentation Overview
By Powertrain
| Battery Electric Vehicles (BEVs) |
| Plug-in Hybrid Electric Vehicles (PHEVs) |
| Fuel-Cell Electric Vehicles (FCEVs) |
By Vehicle Type
| Passenger Car | Hatchback |
| Sedan | |
| Sports Utility Vehicle/Crossover | |
| Multi-purpose Vehicle | |
| Commercial Vehicle | Light Commercial Vehicle |
| Medium and Heavy-duty Truck | |
| Bus |
By Battery Chemistry
| Lithium Iron Phosphate (LFP) |
| Lithium Nickel Manganese Cobalt Oxide (NMC) |
| Lithium Nickel Cobalt Aluminum Oxide (NCA) |
| Others |
By Motor Architecture
| Permanent-Magnet Synchronous / Interior PM Motors |
| Induction Motors (IM) |
| Others (SRM, Axial Flux, etc.) |
By Range
| Short (Below 200 km) |
| Mid (200-400 km) |
| Long (400-600 km) |
| Ultra-Long (Above 600 km) |
By Voltage
| Low Voltage (Below 200 V) |
| Mid Voltage (200-400 V) |
| High Voltage (400-800 V) |
| Ultra-High Voltage (Above 800 V) |
By Country
| Austria |
| Belgium |
| Czech Republic |
| Denmark |
| Estonia |
| France |
| Germany |
| Ireland |
| Italy |
| Latvia |
| Lithuania |
| Norway |
| Poland |
| Russia |
| Spain |
| Sweden |
| United Kingdom |
| Rest-of-Europe |
| By Powertrain | Battery Electric Vehicles (BEVs) | |
| Plug-in Hybrid Electric Vehicles (PHEVs) | ||
| Fuel-Cell Electric Vehicles (FCEVs) | ||
| By Vehicle Type | Passenger Car | Hatchback |
| Sedan | ||
| Sports Utility Vehicle/Crossover | ||
| Multi-purpose Vehicle | ||
| Commercial Vehicle | Light Commercial Vehicle | |
| Medium and Heavy-duty Truck | ||
| Bus | ||
| By Battery Chemistry | Lithium Iron Phosphate (LFP) | |
| Lithium Nickel Manganese Cobalt Oxide (NMC) | ||
| Lithium Nickel Cobalt Aluminum Oxide (NCA) | ||
| Others | ||
| By Motor Architecture | Permanent-Magnet Synchronous / Interior PM Motors | |
| Induction Motors (IM) | ||
| Others (SRM, Axial Flux, etc.) | ||
| By Range | Short (Below 200 km) | |
| Mid (200-400 km) | ||
| Long (400-600 km) | ||
| Ultra-Long (Above 600 km) | ||
| By Voltage | Low Voltage (Below 200 V) | |
| Mid Voltage (200-400 V) | ||
| High Voltage (400-800 V) | ||
| Ultra-High Voltage (Above 800 V) | ||
| By Country | Austria | |
| Belgium | ||
| Czech Republic | ||
| Denmark | ||
| Estonia | ||
| France | ||
| Germany | ||
| Ireland | ||
| Italy | ||
| Latvia | ||
| Lithuania | ||
| Norway | ||
| Poland | ||
| Russia | ||
| Spain | ||
| Sweden | ||
| United Kingdom | ||
| Rest-of-Europe | ||


Market Definition
- Vehicle Type - The category includes passenger cars, commercial vehicles, and two-wheelers.
- Vehicle Body Type - TUnder Passenger Cars, the category includes Hatchbacks, Sedans, Sports Utility Vehicles, and Multi-purpose Vehicles; for Commercial Vehicles, it covers Light Commercial Pick-up Trucks, Light Commercial Vans, Medium-duty Commercial Trucks, Heavy-duty Commercial Trucks, and Medium and Heavy Duty Buses; and for Two-Wheelers, it encompasses Scooters and Motorcycles.
- Fuel Category - The category exclusively covers electric propulsion systems, including various types such as HEV (Hybrid Electric Vehicles), PHEV (Plug-in Hybrid Electric Vehicles), BEV (Battery Electric Vehicles), and FCEV (Fuel Cell Electric Vehicles).
| Keyword | Definition |
|---|---|
| Electric Vehicle (EV) | A vehicle which uses one or more electric motors for propulsion. Includes cars, buses, and trucks. This term includes all-electric vehicles or battery electric vehicles and plug-in hybrid electric vehicles. |
| BEV | A BEV relies completely on a battery and a motor for propulsion. The battery in the vehicle must be charged by plugging it into an outlet or public charging station. BEVs do not have an ICE and hence are pollution-free. They have a low cost of operation and reduced engine noise as compared to conventional fuel engines. However, they have a shorter range and higher prices than their equivalent gasoline models. |
| PEV | A plug-in electric vehicle is an electric vehicle that can be externally charged and generally includes all-electric vehicles as well as plug-in hybrids. |
| Plug-in Hybrid EV | A vehicle that can be powered either by an ICE or an electric motor. In contrast to normal hybrid EVs, they can be charged externally. |
| Internal combustion engine | An engine in which the burning of fuels occurs in a confined space called a combustion chamber. Usually run with gasoline/petrol or diesel. |
| Hybrid EV | A vehicle powered by an ICE in combination with one or more electric motors that use energy stored in batteries. These are continually recharged with power from the ICE and regenerative braking. |
| Commercial Vehicles | Commercial vehicles are motorized road vehicles designed for transporting people or goods. The category includes light commercial vehicles (LCVs) and medium and heavy-duty vehicles (M&HCV). |
| Passenger Vehicles | Passenger cars are electric motor– or engine-driven vehicles with at least four wheels. These vehicles are used for the transport of passengers and comprise no more than eight seats in addition to the driver’s seat. |
| Light Commercial Vehicles | Commercial vehicles that weigh less than 6,000 lb (Class 1) and in the range of 6,001–10,000 lb (Class 2) are covered under this category. |
| M&HDT | Commercial vehicles that weigh in the range of 10,001–14,000 lb (Class 3), 14,001–16,000 lb (Class 4), 16,001–19,500 lb (Class 5), 19,501–26,000 lb (Class 6), 26,001–33,000 lb (Class 7) and above 33,001 lb (Class 8) are covered under this category. |
| Bus | A mode of transportation that typically refers to a large vehicle designed to carry passengers over long distances. This includes transit bus, school bus, shuttle bus, and trolleybuses. |
| Diesel | It includes vehicles that use diesel as their primary fuel. A diesel engine vehicle have a compression-ignited injection system rather than the spark-ignited system used by most gasoline vehicles. In such vehicles, fuel is injected into the combustion chamber and ignited by the high temperature achieved when gas is greatly compressed. |
| Gasoline | It includes vehicles that use gas/petrol as their primary fuel. A gasoline car typically uses a spark-ignited internal combustion engine. In such vehicles, fuel is injected into either the intake manifold or the combustion chamber, where it is combined with air, and the air/fuel mixture is ignited by the spark from a spark plug. |
| LPG | It includes vehicles that use LPG as their primary fuel. Both dedicated and bi-fuel LPG vehicles are considered under the scope of the study. |
| CNG | It includes vehicles that use CNG as their primary fuel. These are vehicles that operate like gasoline-powered vehicles with spark-ignited internal combustion engines. |
| HEV | All the electric vehicles that use batteries and an internal combustion engine (ICE) as their primary source for propulsion are considered under this category. HEVs generally use a diesel-electric powertrain and are also known as hybrid diesel-electric vehicles. An HEV converts the vehicle momentum (kinetic energy) into electricity that recharges the battery when the vehicle slows down or stops. The battery of HEV cannot be charged using plug-in devices. |
| PHEV | PHEVs are powered by a battery as well as an ICE. The battery can be charged through either regenerative breaking using the ICE or by plugging into some external charging source. PHEVs have a better range than BEVs but are comparatively less eco-friendly. |
| Hatchback | These are compact-sized cars with a hatch-type door provided at the rear end. |
| Sedan | These are usually two- or four-door passenger cars, with a separate area provided at the rear end for luggage. |
| SUV | Popularly known as SUVs, these cars come with four-wheel drive, and usually have high ground clearance. These cars can also be used as off-road vehicles. |
| MPV | These are multi-purpose vehicles (also called minivans) designed to carry a larger number of passengers. They carry between five and seven people and have room for luggage too. They are usually taller than the average family saloon car, to provide greater headroom and ease of access, and they are usually front-wheel drive. |


Research Methodology
Mordor Intelligence follows a four-step methodology in all its reports.
- Step-1: Identify Key Variables: To build a robust forecasting methodology, the variables and factors identified in Step-1 are tested against available historical market numbers. Through an iterative process, the variables required for market forecast are set and the model is built based on these variables.
- Step-2: Build a Market Model: Market-size estimations for the historical and forecast years have been provided in revenue and volume terms. Market revenue is calculated by multiplying the sales volume with their respective average selling price (ASP). While estimating ASP factors like average inflation, market demand shift, manufacturing cost, technological advancement, and varying consumer preference, among others have been taken into account.
- Step-3: Validate and Finalize: In this important step, all market numbers, variables, and analyst calls are validated through an extensive network of primary research experts from the market studied. The respondents are selected across levels and functions to generate a holistic picture of the market studied.
- Step-4: Research Outputs: Syndicated Reports, Custom Consulting Assignments, Databases & Subscription Platforms.


