Canada Telecom Towers Market Size and Share
Market Overview
| Study Period | 2020 - 2031 |
|---|---|
| Forecast Data Period | 2026 - 2031 |
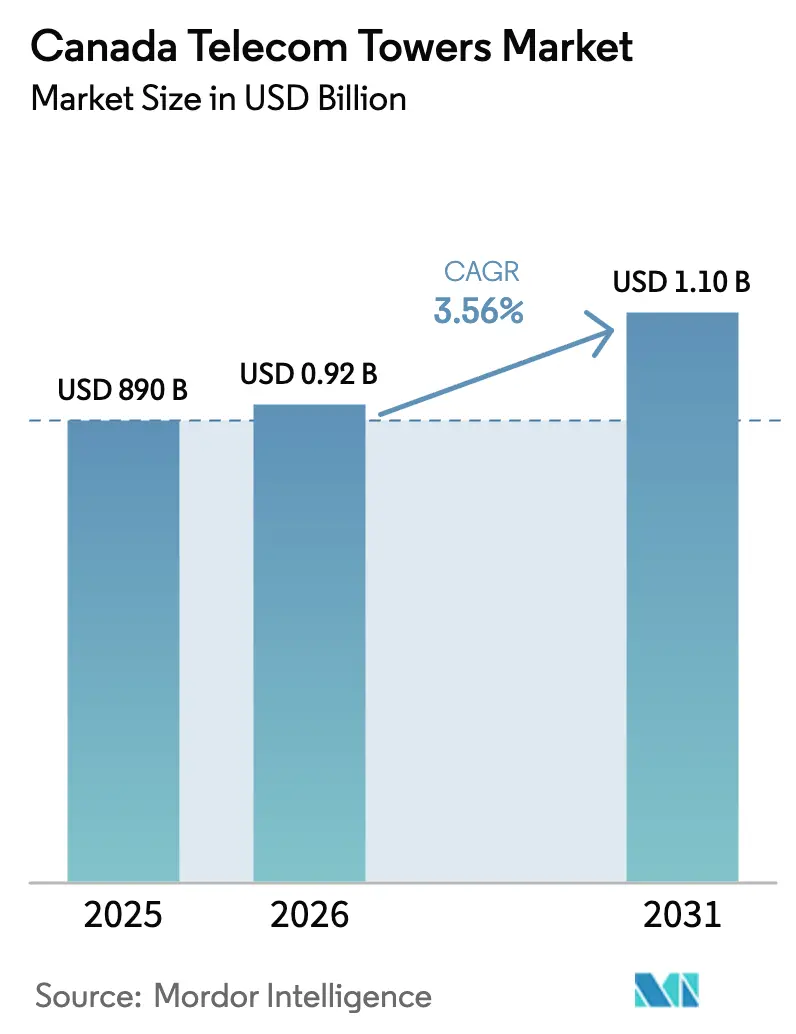
| Base Year Market Size (2025) | USD 890 Billion |
| Market Size (2026) | USD 0.92 Billion |
| Market Size (2031) | USD 1.1 Billion |
| Growth Rate (2026 - 2031) | 3.56% CAGR |
| Market Concentration | High |
Major Players *Disclaimer: Major Players sorted in no particular order Image © Mordor Intelligence. Reuse requires attribution under CC BY 4.0. | |
Canada Telecom Towers Market Analysis by Mordor Intelligence
Canada Telecom Towers Market size in 2026 is estimated at USD 920 million, growing from 2025 value of USD 890 million with 2031 projections showing USD 1.1 billion, growing at 3.56% CAGR over 2026-2031.
The measured expansion stems from densification of existing macro-sites for 5G low- and mid-band spectrum, steady government funding for rural connectivity and the growing use of network-sharing pacts among mobile network operators. Independent TowerCos accelerate growth as operators monetize passive assets, while renewable-power upgrades unlock fresh revenue streams and satisfy corporate carbon targets. Macro-economic headwinds such as higher interest rates and lengthy municipal approvals temper greenfield activity but reinforce demand for colocation, structural reinforcement and stealth solutions in urban cores.
Key Report Takeaways
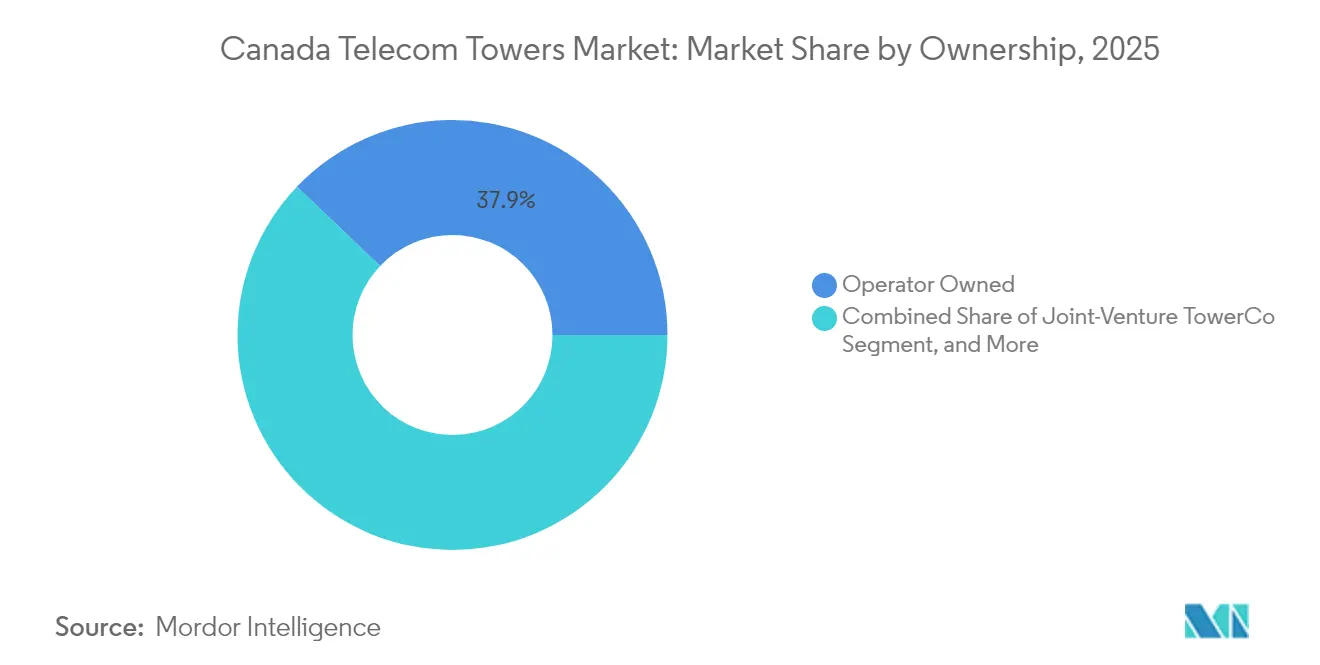
- By ownership, operator-owned assets controlled 37.88% of the Canada telecom towers market share in 2025; independent TowerCos are projected to expand at 10.75% CAGR through 2031.
- By installation type, ground-based towers led with 64.05% revenue share in 2025, while rooftop sites are advancing at a 4.71% CAGR to 2031.
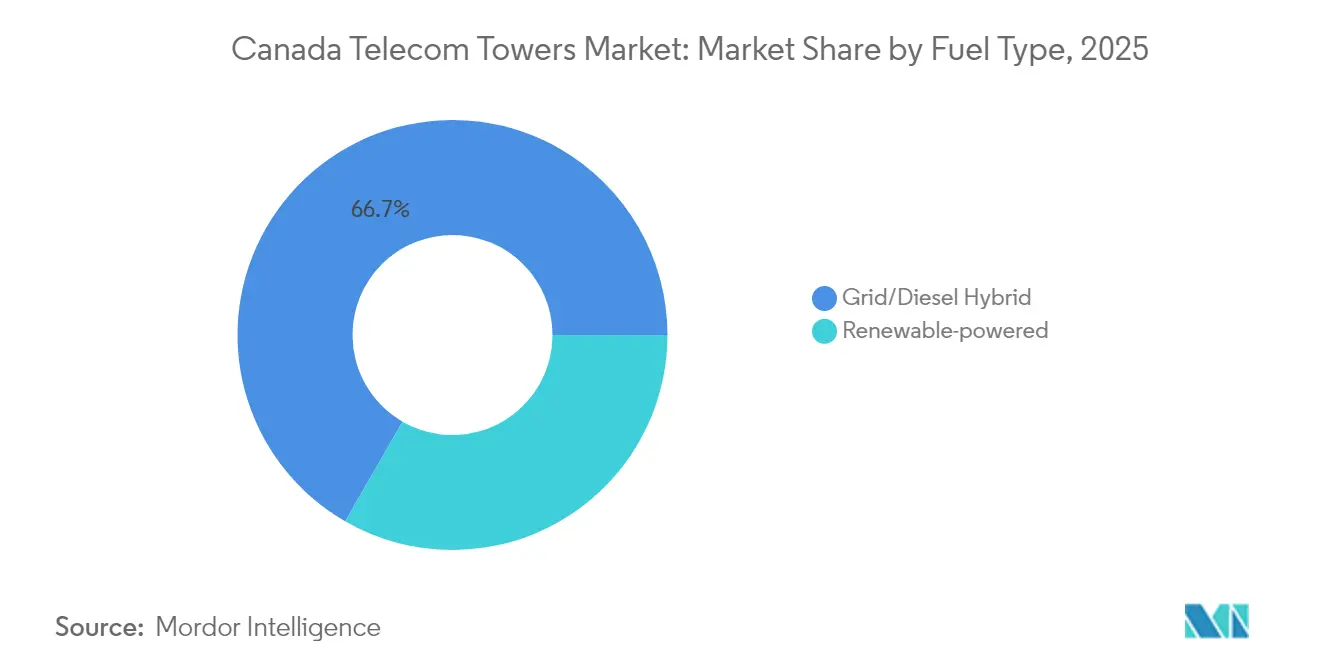
- By fuel type, grid/diesel hybrid systems accounted for 66.68% of the Canada telecom towers market size in 2025; renewable-powered sites are set to grow at 13.92% CAGR between 2026-2031.
- By tower type, monopoles held 54.72% share of the Canada telecom towers market size in 2025, whereas stealth and other concealed structures record the fastest 6.12% CAGR through 2031.
Note: Market size and forecast figures in this report are generated using Mordor Intelligence’s proprietary estimation framework, updated with the latest available data and insights as of 2026.
Canada Telecom Towers Market Trends and Insights
Drivers Impact Analysis*
| Driver | (~) % Impact on CAGR Forecast | Geographic Relevance | Impact Timeline |
|---|---|---|---|
| Accelerated 5G spectrum deployment across 600 MHz and 3.5 GHz bands | +1.2% | National, with concentration in Toronto, Montreal, Vancouver metro areas | Short term (≤ 2 years) |
| Government-funded rural coverage programs (EORN Cell-Gap, Universal Broadband Fund) | +0.8% | Rural Canada, Northern Ontario, Atlantic provinces, Indigenous territories | Medium term (2-4 years) |
| Carrier network-sharing and RAN-sharing agreements boosting colocation ratios | +0.6% | National, with early gains in suburban and rural markets | Medium term (2-4 years) |
| Corporate ESG targets driving conversion to hybrid/renewable-powered sites | +0.4% | National, with leadership in British Columbia and Quebec | Long term (≥ 4 years) |
| First Nations digital-inclusion partnerships creating remote tower demand | +0.3% | Northern Canada, Indigenous territories, remote communities | Long term (≥ 4 years) |
| Emergence of tower-mounted edge-micro-datacentres enabling new revenue lines | +0.2% | Urban centers, industrial corridors, transportation hubs | Long term (≥ 4 years) |
| Source: Mordor Intelligence | |||
Accelerated 5G Spectrum Deployment
Rapid utilization of 600 MHz and 3.5 GHz bands obliges carriers to reinforce or add antenna arrays on existing structures, especially in Toronto, Montréal and Vancouver. The 3800 MHz auction alone raised CAD 8.91 billion and requires 5G coverage to reach half the population by 2026. Low-band assets stretch coverage in rural corridors, whereas mid-band spectrum drives dense urban overlays that rely on shorter site spacing. Most operators now favor tower modification over new builds, lifting structural-upgrade revenue and elevating average colocation ratios.
Government-Funded Rural Connectivity Programs
The Universal Broadband Fund (CAD 2.75 billion) and Ontario’s EORN Cell-Gap initiative subsidize as much as 75% of tower project costs in communities with fewer than 500 inhabitants per square kilometer. [1]Government of Canada, “Universal Broadband Fund Program Details,” canada.caPublic funding offsets land purchase, environmental review and construction expenses that routinely top CAD 400,000 per rural macro-site. Federal targets to reach 98% population coverage by 2026 imply 1,200-1,500 additional towers in low-density areas, delivering long-run visibility for TowerCos via mandatory 10-year service commitments
Network-Sharing Agreements
Joint-radio-access networks between Bell and Telus as well as evolving Rogers-Videotron accords now span roughly 35,000 locations and push average tenancy from 1.8 to 2.4 per tower. [2]Bell Canada, “Network Sharing Framework With Telus,” bell.caShared sites unlock 40-60% higher revenue relative to single-tenant locations, compress deployment timelines and lower per-operator capital outlays. Industry Canada’s supportive stance expedites permits for shared infrastructure, trimming activation cycles to nine months in many rural zones.
Corporate ESG Mandates
Major carriers pledge carbon neutrality by 2030, prompting wholesale conversion of diesel-backed sites to solar-battery or hybrid systems. Rogers has committed to upgrade 4,500 locations, and Bell is now sourcing 100% renewable electricity for network operations. [3]Rogers Communications, “Net-Zero Commitment and Tower Energy Strategy,” rogers.comEnergy-as-a-service contracts deliver recurring fees for TowerCos, while operators capture annual opex savings of CAD 15,000-25,000 per remote site and curb diesel emissions.
Restraints Impact Analysis*
| Restraint | (~) % Impact on CAGR Forecast | Geographic Relevance | Impact Timeline |
|---|---|---|---|
| Lengthy municipal zoning and aesthetics approvals for new macro-sites | -0.9% | Urban centers, suburban municipalities, heritage districts | Short term (≤ 2 years) |
| Community health-risk perception and view-scape opposition | -0.6% | Residential areas, school zones, environmental sensitive areas | Medium term (2-4 years) |
| High capital-intensity amid rising interest rates squeezing TowerCo ROIC | -0.7% | National, affecting all market participants | Short term (≤ 2 years) |
| Massive-MIMO efficiency slowing incremental macro-tower build-outs | -0.4% | Urban markets, high-density coverage areas | Medium term (2-4 years) |
| Source: Mordor Intelligence | |||
Municipal Zoning Challenges
Cities such as Toronto now require 120-meter setbacks from homes and architectural screening, stretching permit cycles from nine to nearly 24 months. Vancouver imposes outright bans on lattice designs within 500 meters of heritage properties, steering applicants toward pricier stealth alternatives that add 40-60% to build cost. Protracted approvals hamper urban 5G roll-outs and increase soft costs to CAD 50,000-75,000 per project
Rising Interest Rates
Weighted average borrowing costs for tower operators climbed from 3-4% in 2021 to about 6-8% in 2024. American Tower’s recent refinancing priced near 5.8%, eroding return-on-capital thresholds for new builds. Smaller TowerCos now struggle to clear the 12-15% internal-rate-of-return hurdle, encouraging portfolio monetization and asset recycling rather than large-scale greenfield expansion.
*Our forecasts treat driver/restraint impacts as directional, not additive. The impact forecasts reflect baseline growth, mix effects, and variable interactions.
Segment Analysis
By Ownership: Independent TowerCos Gain Momentum
Independent players captured incremental share as operators pivoted to asset-light models. Although operator-owned facilities still represented 37.88% of the Canada telecom towers market size in 2025, monetization deals such as Rogers’ USD 7 billion sale of 2,800 sites reshaped the landscape. Master lease-back contracts guarantee carrier access while freeing capital for spectrum and fiber spending. Specialist TowerCos consolidate operations, lowering per-site opex by up to 25% through scale-driven maintenance, power management and insurance savings. Neutral hosting attracts additional tenants, which multiplies cash flow per location and supports an 10.75% CAGR for independent ownership through 2031. Over the outlook, new joint-ventures between infrastructure funds and regional operators will deepen market depth and diversify tenancy risk.
Independent entities deploy advanced analytics to optimize uptime, energy consumption and planned maintenance cycles. These data-driven practices underpin rising tenancy ratios and wider EBITDA margins relative to operator captive portfolios. Conversely, captive tower subsidiaries offer operators the flexibility to divest incremental stakes as capital-market conditions permit. The shifting balance between outright sale, carve-outs and joint-ventures ensures ownership fragmentation remains a defining trait of the Canada telecom towers market.


By Installation: Rooftop Deployments Address Urban Densification
Ground-based structures maintained 64.05% share of the Canada telecom towers market size in 2025, yet rooftop solutions are forecast to post a 4.71% CAGR amid downtown 5G densification. In Toronto’s central business district, around 60% of fresh 3.5 GHz sites now occupy building tops where zoning barriers are lighter and land parcels trade above CAD 1 million. Rooftops trim capital cost by 40-50%, give superior line-of-sight in canyons and reduce time to market by three to six months.
Structural limits remain a hurdle because many roofs cannot support multi-tenant arrays. Single-tenant ceilings curb revenue potential relative to macro-sites that host three or more carriers. Small-cell overlays and in-building DAS are emerging complements that allow owners of premium roofs to command CAD 2,000-4,000 monthly rental income. Ultimately, carriers choose between ground and rooftop based on coverage radius, population density and zoning risk, a calculus that will continue to diversify deployment types across the Canada telecom towers market.
By Fuel Type: Renewable Power Gains Momentum
Grid/diesel hybrids supplied power to 66.68% of active sites in 2025, underscoring their reliability across remote terrain. Nevertheless, renewable-first configurations are projected to expand at 13.92% CAGR, the fastest rate among all segments. EdgePoint’s roll-out of 200 solar-battery sites proves the economics: autonomy of 80-90% in southern provinces and diesel cuts of nearly 70% in the North. Provincial carbon pricing mechanisms in British Columbia and Québec, coupled with carrier net-zero pledges, sweeten payback to as little as five years.
Purely renewable towers remain confined to select geographies where sunlight hours, wind resources or hydro micro-grids provide adequate redundancy. Most operators prefer hybrid designs that incorporate diesel for lengthy winter nights. Renewable energy as a service gives TowerCos an add-on revenue line while enhancing tenants’ ESG scores. As battery costs decline, the penetration of renewables across the Canada telecom towers market is likely to outpace earlier solar pilot programs.
By Tower Type: Stealth Solutions Address Aesthetic Concerns
Monopoles accounted for 54.72% share in 2025 thanks to their compact footprint and mid-level visual impact. Concealed or stealth structures, however, will log a 6.12% CAGR to 2031 as municipalities place rising emphasis on skyline preservation. Tree-mimicking poles, shrouded antenna housings and architecturally blended façades gain traction in residential and heritage districts where standard lattice construction faces resistance.
Stealth formats carry 40-60% higher capital outlay but accelerate approvals and unlock premium lease rates in dense districts. Lattice towers still dominate rural corridors where load requirements and land availability outweigh visual concerns. Guyed towers remain niche, reserved for expansive tracts with minimal habitation. Manufacturers continue to refine materials and camouflage techniques, enabling full 5G antenna arrays without compromising municipal aesthetic standards. The tower-type mix will therefore converge on a hybrid split, matching structural need with local regulatory preferences across the Canada telecom towers market.
Geography Analysis
Ontario and Québec together host roughly 60% of national tower stock, reflecting their combined 75% share of Canadian population and dense urban footprints. The Greater Toronto Area alone supports more than 3,000 live sites, with mid-band 5G requiring inter-site distances of 800-1,200 meters. In contrast, rural pockets of the same provinces use 5-10 kilometer spacing, demanding additional builds to hit federal 98% coverage targets by 2026. British Columbia’s mountainous topography inflates average construction budgets by 25-30% because of helicopter lifts and extended permitting for environmental impacts.
Alberta’s tower grid mirrors its energy-sector geography; corridors serving oil sands and pipeline routes demand mission-critical uptime and backhaul redundancy. Atlantic Canada relies heavily on public funding to overcome low population density, with EORN and analogous grants underwriting as much as three-quarters of capex in select coastal zones. Northern territories face permafrost, extreme weather and limited road access that elevate per-site cost to CAD 800,000-1.2 million, roughly triple southern outlays. The First Nations Technology Council’s plan to connect 203 Indigenous communities draws collaborative investment from carriers and the federal government, adding niche growth corridors while extending project timelines for consultation and revenue-sharing processes.
Provincial policy deltas further color the geographic mosaic. Québec enforces French-language signage on towers, adding compliance overhead, while British Columbia mandates expanded environmental reviews, stretching project cycles. These asymmetries oblige TowerCos to adapt operating models, zoning playbooks and stakeholder engagement strategies by province, shaping site economics across the Canada telecom towers market.
Competitive Landscape
Market concentration is moderate, with the top five entities—American Tower, SBA Communications, Rogers, Bell and Telus controlling a substantial share of live sites. Rogers’ USD 7 billion divestiture to Blackstone and subsequent CAD 1.2 billion sale to Brookfield illustrate how operators recycle passive assets to fund spectrum and fiber programs. Telus is pursuing a similar monetization for its 13,000-site book, valued at up to CAD 1.5 billion. These moves enlarge the independent TowerCo pool and create fresh neutral-host options for smaller carriers. American Tower secured CAD 400 million to add 200 sites in Ontario and Québec, demonstrating continued appetite for expansion despite higher borrowing costs.
Technology leadership also shapes rivalry. EdgePoint’s renewable energy-as-a-service model and tower-mounted micro-data-centers enable incremental rent streams of CAD 5,000-8,000 monthly. SBA’s entry through a CAD 300 million acquisition of 180 Alberta and British Columbia assets signals interest in energy-corridor growth bands. Regulatory competence is another differentiator; incumbents with decade-long municipal relationships can compress approval windows that routinely reach 18-24 months in metro regions. As a result, barriers to entry remain high, even as asset-light strategies open new windows for global infrastructure funds within the Canada telecom towers market.
Emergent dynamics include community engagement programs to mitigate health concerns, joint-ventures aimed at First Nations connectivity, and escalating ESG scrutiny that favors operators able to report verifiable carbon cuts. Competitive intensity is expected to sharpen as tenancy ratios rise and new spectrum bands demand yet another cycle of structural upgrades and strategic colocations.
Canada Telecom Towers Industry Leaders
Rogers Communications Towers
SBA Communications
Shared Tower Inc
SIGNUM Wireless
American Tower Corporation
- *Disclaimer: Major Players sorted in no particular order

Recent Industry Developments
- March 2025: American Tower Corporation arranged CAD 400 million in financing to build 200 new sites across Ontario and Québec.
- February 2025: Telus Communications formed a partnership with Northleaf Capital to explore the sale of stakes in 13,000 towers, valuing the portfolio at CAD 1.2-1.5 billion.
- January 2025: Rogers Communications concluded its tower monetization program, transferring 800 additional sites to Brookfield for CAD 1.2 billion.
- December 2024: Bell Canada finalized the conversion of 1,200 towers to hybrid solar-battery power at a cost of CAD 180 million.


Canada Telecom Towers Market Report Scope
Telecommunication towers encompass a variety of structures, such as monopoles, tripoles, lattice towers, guyed towers, self-supporting towers, poles, masts, and other similar forms. These towers, equipped with one or more telecommunication antennas, facilitate radio communications. They can be situated on the ground or atop a building's rooftop and often include storage for equipment and electronic components.
The Canada telecom towers market is segmented by ownership (operator-owned, private-owned, and MNO captive sites), by installation (rooftop, and ground-based), and by fuel type (renewable and non-renewable).
The market size and forecasts are provided in terms of installed base (Thousand Units) for all the above segments.
| Operator-owned |
| Independent TowerCo |
| Joint-Venture TowerCo |
| MNO Captive |
| Rooftop |
| Ground-based |
| Renewable-powered |
| Grid/Diesel Hybrid |
| Monopole |
| Lattice |
| Guyed |
| Stealth / Concealed |
| By Ownership | Operator-owned |
| Independent TowerCo | |
| Joint-Venture TowerCo | |
| MNO Captive | |
| By Installation | Rooftop |
| Ground-based | |
| By Fuel Type | Renewable-powered |
| Grid/Diesel Hybrid | |
| By Tower Type | Monopole |
| Lattice | |
| Guyed | |
| Stealth / Concealed |


Key Questions Answered in the Report
How large is the Canada telecom towers market in 2026?
The market stands at USD 920 million in 2026 and is projected to reach USD 1.1 billion by 2031.
What is the expected growth rate for Canadian tower infrastructure?
Market revenue is forecast to increase at a 3.56% CAGR between 2026 and 2031.
Which ownership model is growing fastest?
Independent TowerCos are expanding at 10.75% CAGR as operators pursue asset-light strategies.
How are renewable power systems affecting tower economics?
Solar-battery and hybrid conversions cut diesel use by up to 70% and add energy-as-a-service income for TowerCos.
What hurdles most constrain new tower builds in urban Canada?
Lengthy municipal zoning processes and aesthetic requirements now extend approvals to 18-24 months in many cities.
Which provinces require the highest tower capex?
Mountainous British Columbia and the northern territories face per-site costs up to CAD 1.2 million due to terrain and access challenges.
Page last updated on:


