Europe Refillable And Reusable Packaging Market Size and Share
Market Overview
| Study Period | 2020 - 2031 |
|---|---|
| Forecast Data Period | 2026 - 2031 |
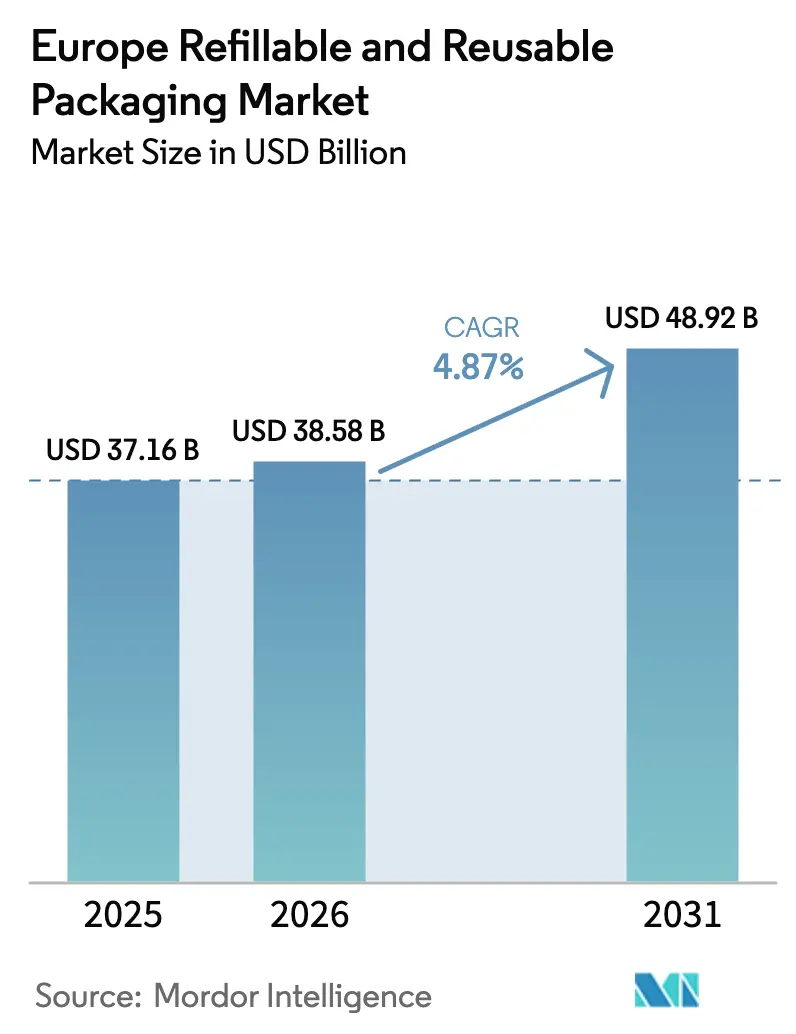
| Base Year Market Size (2025) | USD 37.16 Billion |
| Market Size (2026) | USD 38.58 Billion |
| Market Size (2031) | USD 48.92 Billion |
| Growth Rate (2026 - 2031) | 4.87% CAGR |
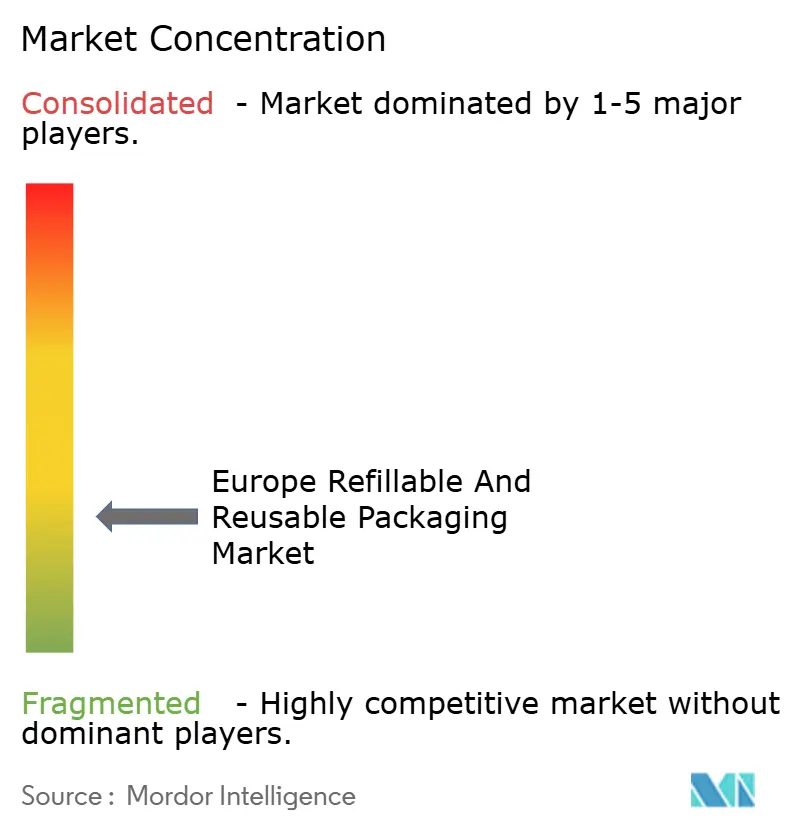
| Market Concentration | Low |
Major Players*Disclaimer: Major Players sorted in no particular order Image © Mordor Intelligence. Reuse requires attribution under CC BY 4.0. | |
Europe Refillable And Reusable Packaging Market Analysis by Mordor Intelligence
The Europe refillable and reusable packaging market size was valued at USD 37.16 billion in 2025 and is estimated to grow from USD 38.58 billion in 2026 to reach USD 48.92 billion by 2031, at a CAGR of 4.87% during the forecast period (2026-2031). This steady expansion reflects stricter EU legislation that mandates minimum reuse levels, growing retailer participation in deposit-return systems, and rising corporate investment in closed-loop logistics. Scaling wash-hub capacity, widespread IoT tagging of transport assets, and harmonized ecodesign criteria further reinforce structural demand. Brand owners see cost savings from lower material loss and reduced carbon liabilities, while logistics providers replace one-way flows with asset-recovery models optimized by predictive analytics. Combined, these shifts produce durable tailwinds that keep the Europe refillable and reusable packaging market on a mid-single-digit growth path despite macroeconomic volatility.
Key Report Takeaways
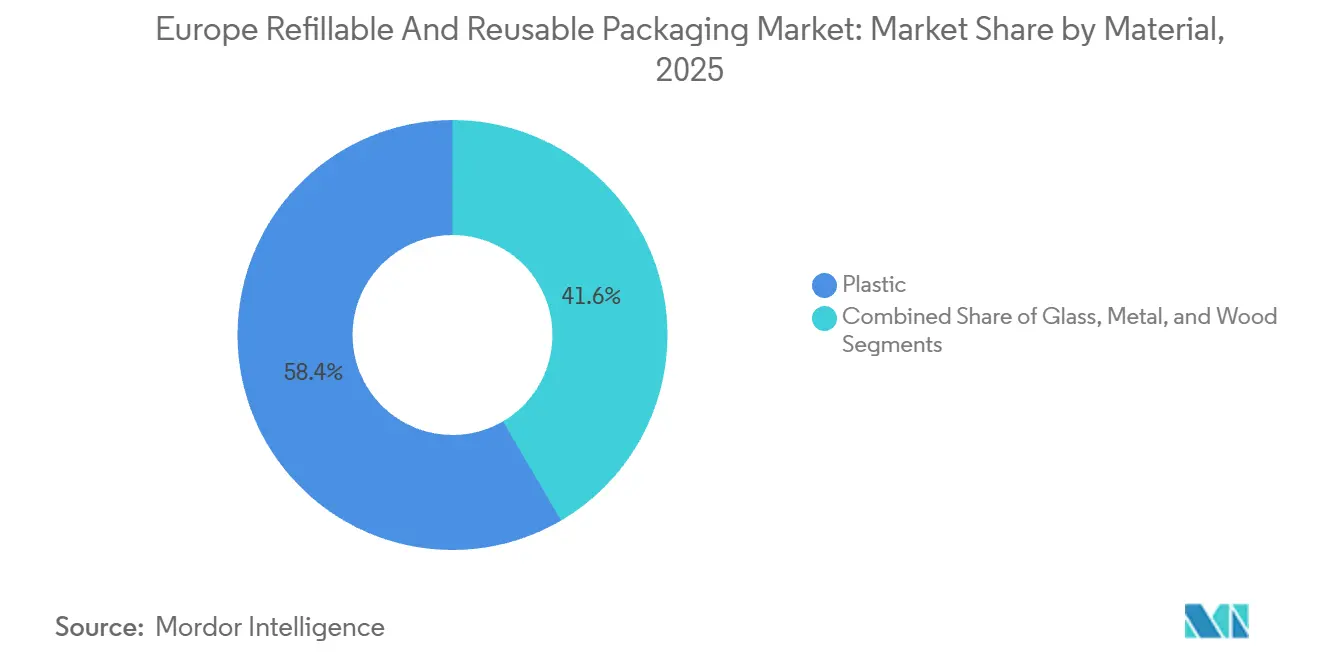
- By material, plastic captured 58.43% of the Europe refillable and reusable packaging market share in 2025, and it is forecast to grow at a 5.23% CAGR to 2031.
- By product type, pallets and crates held 28.79% of the Europe refillable and reusable packaging market size in 2025, while intermediate bulk containers are set to expand at a 5.64% CAGR through 2031.
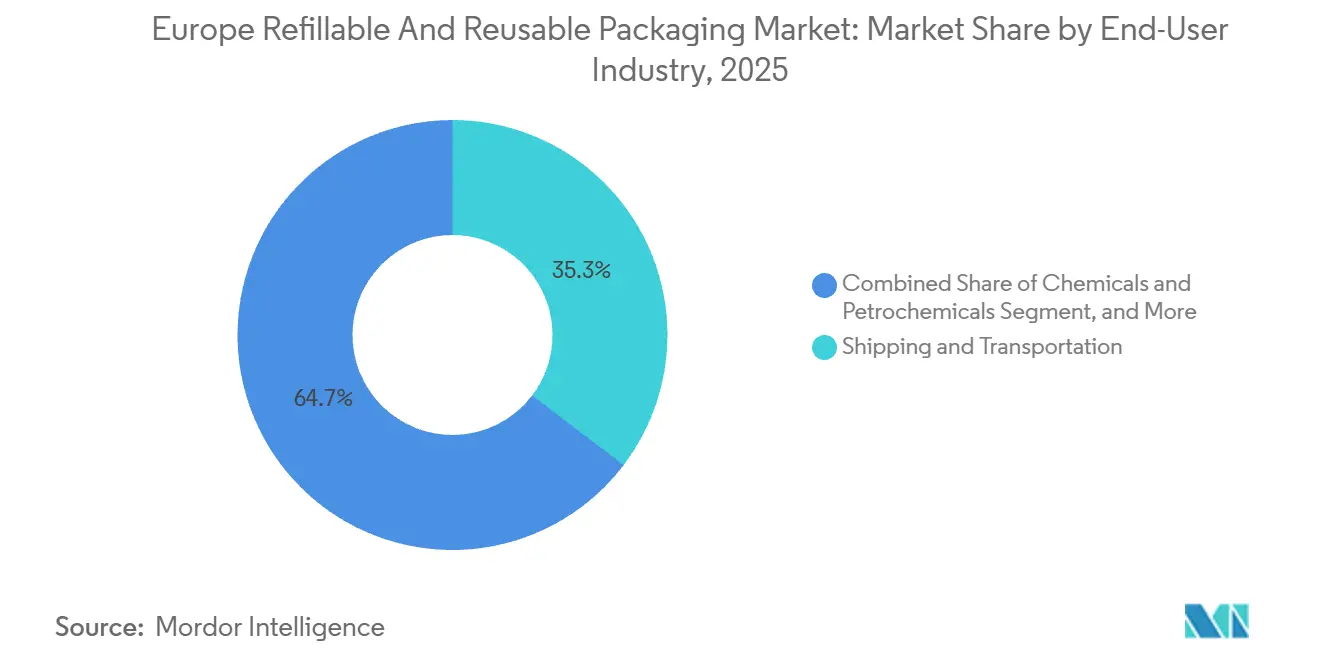
- By end-user industry, shipping and transportation accounted for 35.34% revenue share in 2025, whereas chemicals and petrochemicals record the highest projected CAGR at 5.98% to 2031.
- By country, Germany led with 21.45% share in 2025, and Poland is advancing at a 6.21% CAGR during the forecast period.
Note: Market size and forecast figures in this report are generated using Mordor Intelligence’s proprietary estimation framework, updated with the latest available data and insights as of January 2026.
Worldwide, activity is shaped by contributions from multiple regions, with Europe representing one of the more structurally developed among them. The global report on refillable and reusable packaging market by Mordor Intelligence reflects how these regional layers combine into a single system.
Europe Refillable And Reusable Packaging Market Trends and Insights
Drivers Impact Analysis*
| Driver | (~) % Impact on CAGR Forecast | Geographic Relevance | Impact Timeline |
|---|---|---|---|
| Mandatory Deposit-Return Schemes Across EU Member States | +0.9% | Germany, Netherlands, Denmark, Sweden, Finland, Estonia, Lithuania, Croatia, with rollout in France and Spain by 2027 | Medium term (2-4 years) |
| Cold-Chain Retail Shift to IoT-Enabled Reusable Crates | +0.7% | Germany, France, Netherlands, UK, with adoption spreading to Poland and Czech Republic | Short term (≤ 2 years) |
| Mandatory Re-use Targets in Regulation (EU) 2025/40 | +1.1% | EU-wide, with early enforcement in Germany, Netherlands, Belgium | Long term (≥ 4 years) |
| Brewery Adoption of Universal Returnable Glass Bottles | +0.5% | Germany, Belgium, Netherlands, Austria, Czech Republic | Medium term (2-4 years) |
| Surge in Closed-Loop Logistics Contracts with 3PLs | +0.8% | Germany, France, UK, Poland, Italy | Short term (≤ 2 years) |
| AI-Optimised Reverse-Logistics Platforms Boost ROI | +0.6% | Germany, Netherlands, UK, France, with pilot programs in Spain and Poland | Medium term (2-4 years) |
| Source: Mordor Intelligence | |||
Mandatory Deposit-Return Schemes Across EU Member States
Twelve member states now operate legally binding deposit-return schemes that require consumers to pay a refundable deposit on beverage containers, with Germany’s Pfand system achieving return rates above 98%. The forthcoming Packaging and Packaging Waste Regulation sets a 90% return-rate target for single-use beverage containers by 2029, compelling retailers to install reverse-vending machines and integrate deposit accounting into point-of-sale software. France began national deployment in January 2025, ordering 30,000 reverse-vending machines and triggering EUR 200 million (USD 220 million) of capital expenditure for equipment suppliers. Spain’s early pilot in Catalonia highlighted an urban–rural gap that policymakers must bridge before nationwide rollout. Material recovery economics are compelling, as recycled aluminum saves 95% of the energy needed for primary smelting.
Cold-Chain Retail Shift to IoT-Enabled Reusable Crates
Fresh-food distributors embed Bluetooth Low-Energy tags and location sensors in plastic crates to monitor temperature, humidity, and shock events in 15-minute increments, lowering spoilage by 12-18%.[1]IFCO Systems, “IoT-Enabled Reusable Packaging Solutions,” ifco.com IFCO deployed more than 2 million sensor-equipped crates across Germany, France, and the Netherlands in 2024, while Schoeller Allibert’s SmartLink system achieved 99.7% scan accuracy at distribution-center gates. The EUR 8–12 (USD 8.8–13.2) sensor premium amortizes in under 18 months because labor savings eliminate manual counts. Geo-fencing tools also reduce theft and loss to below 1% of asset pools. New EHEDG guidance confirms that embedded electronics withstand 85 °C caustic wash cycles, giving retailers assurance on food-contact safety.[2]European Hygienic Engineering and Design Group, “Reusable Food-Contact Guidance,” ehedg.org
Mandatory Re-use Targets in Regulation (EU) 2025/40
The regulation binds producers to make 10% of transport packaging and 20% of consumer packaging refillable or reusable by 2030, rising to 25% and 40% by 2040. Liability shifts upstream, requiring companies to finance take-back schemes or face fines ranging from EUR 0.50 to EUR 2.00 (USD 0.55–2.20) per non-compliant unit. Germany enacted mirror legislation in December 2024, prompting quick-service restaurants to partner with Vytal’s digital deposit platform, which processed 8 million transactions in 2025. Belgium extended similar mandates to e-commerce packaging, creating logistical complexity that postal operators such as bpost actively solve through pickup-point networks. Harmonized ecodesign rules now require at least 50 cycles for plastic crates, steering procurement toward durable polypropylene grades.
Surge in Closed-Loop Logistics Contracts with 3PLs
Third-party logistics specialists bundle reusable-asset management into multi-year contracts valued between EUR 50 million and EUR 150 million (USD 55–165 million), shifting capital risk away from brand owners. DHL Supply Chain’s 2024 agreement covers 5 million crates and guarantees 95% asset availability through RFID tracking and predictive maintenance. DB Schenker’s automotive platform cut empty-return miles by 18%, eliminating 22,000 tons of CO₂ annually. Blockchain custody-transfer systems from Kuehne + Nagel reduce invoice disputes by 60% and deliver real-time asset visibility. These service-level agreements embed strict performance clauses on return and cleanliness rates that align provider incentives with asset longevity.
Restraints Impact Analysis*
| Restraint | (~) % Impact on CAGR Forecast | Geographic Relevance | Impact Timeline |
|---|---|---|---|
| High CAPEX for Centralised Wash-Hubs | -0.5% | Germany, Netherlands, Italy, France, with limited capacity in Spain, Poland, Romania | Medium term (2-4 years) |
| Fragmented National Hygiene Standards | -0.3% | EU-wide, with divergence between northern and southern member states | Long term (≥ 4 years) |
| Return-Rate Volatility in Urban vs Rural Areas | -0.4% | Spain, Poland, Italy, France (rural regions), contrasted with Germany, Netherlands (urban efficiency) | Short term (≤ 2 years) |
| Energy-Intensive Glass Melting Costs | -0.2% | Germany, France, Italy, Austria, Czech Republic | Medium term (2-4 years) |
| Source: Mordor Intelligence | |||
High CAPEX for Centralised Wash-Hubs
Building a 10-ton-per-hour wash-hub demands EUR 5–15 million (USD 5.5–16.5 million) for conveyors, caustic dosing, and wastewater treatment, concentrating capacity in Germany, the Netherlands, and northern Italy. Permits take up to 18 months, and operating costs add EUR 0.15–0.30 (USD 0.17–0.33) per wash because each crate consumes 0.8–1.2 kWh and up to 4 liters of water. Eastern markets move soiled assets 300-500 km for cleaning, inflating logistics costs by 25-40%. Seasonality worsens bottlenecks as harvest volumes spike 30-50%, and the top three operators now control 65% of total European wash capacity, limiting competition.
Return-Rate Volatility in Urban vs Rural Areas
Recovery exceeds 90% in dense cities such as Berlin and Amsterdam, but falls to 60-75% in rural Andalusia or Podlaskie, depressing utilization and raising replacement costs.[3]European Environment Agency, “Return Rate Variability Across the EU,” eea.europa.eu Irregular backhauls disrupt scheduling, forcing poolers to hold higher safety stock. Government incentives often focus on urban pilots, leaving peripheral areas underserved. Asset-tracking data shows rural collection routes carry 25% more empty miles and 15% higher fuel spend per recovered unit. Mobile collection points and variable deposits are under evaluation but remain nascent.
*Our forecasts treat driver/restraint impacts as directional, not additive. The impact forecasts reflect baseline growth, mix effects, and variable interactions.
Segment Analysis
By Material: Lightweight Plastic Outruns Legacy Formats
Plastic held a 58.43% market share in 2025 within the Europe refillable and reusable packaging market, and it is projected to advance at a 5.23% CAGR through 2031. This dominance rests on polypropylene crates weighing 1.2–1.8 kg, roughly half the weight of wood alternatives, enabling trucks to carry 8–12% more payload. Lower fuel burn combined with smooth, sealed surfaces that meet EHEDG hygiene norms persuades retailers to pay a EUR 8–15 (USD 8.8–16.5) premium per unit. Glass retains niche strength in beer and premium spirits because consumers equate it with quality, yet natural-gas-linked energy costs equaling 15–20% of production expenses crimp margins during price spikes. Meanwhile, metal drums and kegs serve chemical and beverage uses that demand pressure resistance, and reconditioners report 15–20-year asset lives.
Regulation (EU) 2024/1781 stipulates a minimum durability of 50 cycles that polypropylene effortlessly exceeds, whereas glass bottle manufacturers thicken walls to comply, raising weight and transport costs. Coca-Cola and Schoeller Allibert’s 97% recycled-content crate illustrates a move to closed-loop resin supply, cutting carbon footprint 65% and insulating buyers from virgin polymer volatility. ALPLA’s 40,000-ton rPET and rHDPE expansion in Austria and Poland secures feedstock for next-generation reusable goods. Metal growth aligns with stricter ADR rules; Mauser’s reconditioning network retains 92–95% of steel IBCs in circulation and extends single-container life to 15 years.


By Product Type: Pallets Anchor, IBCs Accelerate
Pallets and crates delivered 28.79% of the Europe refillable and reusable packaging market size in 2025 on the back of ubiquity in retail, automotive, and fresh-produce supply chains. CHEP’s pool of 345 million pallets turns every 45–60 days and posts 95% return rates in Germany and the Netherlands. EUR-pallet standardization (1,200 × 800 mm) facilitates cross-industry interchange, yet Brexit-driven divergence toward 1,200 × 1,000 mm in the United Kingdom creates friction at Dover. Intermediate bulk containers are the fastest-growing product at 5.64% CAGR because chemical producers swap single-use drums for 1,000-liter composite IBCs that can cut packaging waste 90% per ton of product. Schutz links digital tracking to fill status and maintenance history, shrinking loss to under 1%.
Returnable glass bottles flourish inside expanding brewery consortia; universal 330-ml and 500-ml molds reduce sorting errors 25% and extend cycle life to 50 refills. Drums and barrels preserve niche roles in lubricants and edible oils, with Greif reporting 10–15 cycles before fatigue drives retirement. Corrugated plastic or fiberboard boxes scale in e-commerce, yet return rates dip in rural settings where single-use alternatives remain more convenient. Specialty containers in pharmaceuticals and electronics emphasize temperature control and anti-static properties, areas where Nefab competes on custom engineering.
By End-User Industry: Shipping Commands, Chemicals Accelerate
Shipping and transportation accounted for 35.34% of 2025 revenue, underscoring the legacy dominance of pallet pooling, which moves goods across European borders daily. Dynamic load matching, pioneered in the 1990s, now achieves 85–90% asset utilization. Food and beverage follows closely, banking on IFCO’s 2.5 million produce crates that lower spoilage by up to 18% and support supermarket waste-reduction goals. Cosmetics brands such as L’Oréal test refill stations, yet consumer uptake lags because hygiene perceptions still favor sealed single-use packs.
Chemicals and petrochemicals are the fastest-growing end-user segment, with a 5.98% CAGR, driven by ADR regulations requiring traceable, leak-proof containers for hazardous goods. BASF and Dow channel used IBCs to Mauser and Greif sites for re-certification, saving 30–40% on packaging costs while meeting circularity targets. E-commerce experiments with reusable mailers reach 74% return rates in urban centers but struggle in low-density regions, highlighting a frontier for the Europe refillable and reusable packaging market. Pharmaceuticals and electronics purchase highly customized, high-margin containers where asset life can exceed 100 turns, but volume remains limited.
Geography Analysis
Germany’s dominance stems from its mature deposit-return ecosystem, which processes 3 billion containers annually and delivers 98% return rates, the highest benchmark within the Europe refillable and reusable packaging market. Industrial clusters in Bavaria and North Rhine-Westphalia lean on 35 million-crate wash capacity that keeps turnaround times under 48 hours. Federal transposition of Regulation 2025/40 in late 2024 obliges quick-service restaurants to offer reusable formats, accelerating consumer uptake.
Poland’s 6.21% growth rate reflects EUR 500 million (USD 550 million) in announced projects, including Mauser’s Wrocław IBC reconditioner, which serves BASF and Covestro. Automotive suppliers in Katowice demand standardized pallets, while e-commerce hubs in Poznań pilot reusable mailers. Infrastructure, however, remains thin, only eight commercial wash-hubs operate nationwide, compelling long-haul transport of soiled assets.
France, the second-largest economy, triggered EUR 200 million (USD 220 million) in equipment orders for its 2025 DRS launch, expecting return rates to rise to 85% by 2027. Italy struggles with north-south divergence; Lombardy wash-hubs process 65% of the national volume, leaving southern operators with longer round-trips. Spain replicates the issue, as Catalonia posts high urban returns but rural zones lag. The Netherlands hosts 12 wash-hubs that also serve Belgium and Luxembourg in a tightly integrated Benelux pool, and Belgium’s Fost Plus extension to takeaway containers adds 50 million units to the circular stream. Across Scandinavia, high consumer environmental awareness keeps return rates near 95%, although sparsely populated northern areas incur higher transport costs.
Competitive Landscape
The Europe refillable and reusable packaging market shows fragmentation. CHEP leverages a 345-million-asset base to negotiate wash and RFID rates 15-20% below smaller rivals. IFCO dominates fresh-produce crates with IoT-enabled pools that reduce spoilage 18%, locking in long-term supermarket contracts. The market is also witnessing increased investments in sustainable packaging solutions to meet regulatory and consumer demands.
Scale-driven mergers continue, as IPL and Schoeller Allibert announced a USD 1.4 billion deal in April 2025 that unites injection-molding know-how and a network covering 18 countries. Mondi’s USD 690 million Schumacher acquisition added corrugated capacity and four wash-hubs in Germany and Austria. Smurfit WestRock, created in July 2024, integrates corrugated and reusable portfolios to win e-commerce customers across 40 countries.
Digitalization differentiates competitors; Kuehne + Nagel’s blockchain chain-of-custody tracks every pallet handoff, reducing disputes 60%. Vytal and Loop run QR-based consumer deposit platforms that remove the need for physical reverse-vending machines, cutting capital outlays 60-70% in pilot programs. AI route optimization, now embedded in CHEP scheduling, trims 12% of truck dispatches and raises utilization, further consolidating advantage for scale leaders.
Europe Refillable And Reusable Packaging Industry Leaders
Schoeller Allibert Services BV
Nefab Group AB
Vetropack Holding AG
Mondi Group
Greif, Inc.
- *Disclaimer: Major Players sorted in no particular order

Recent Industry Developments
- April 2025: IPL and Schoeller Allibert signed a definitive USD 1.4 billion merger agreement combining injection-molding capacity with reusable-packaging pooling networks across 18 European countries, with closing targeted for Q3 2025 and combined management of more than 100 million plastic crates and pallets annually.
- March 2025: Belgium expanded the Fost Plus deposit-return system to cover reusable food containers for takeaway meals, adding an estimated 50 million assets to the circular pool and requiring restaurants nationwide to accept returns at no charge, tracked through QR-code scans.
- February 2025: ALPLA committed EUR 80 million (USD 88 million) to enlarge its Wöllersdorf, Austria recycling plant by 40,000 tons of annual rPET and rHDPE capacity, securing feedstock for reusable-packaging producers across Central Europe with commissioning slated for Q4 2025.
- January 2025: France launched its national deposit-return scheme, installing 30,000 reverse-vending machines at retail sites to process 1.5 billion PET bottles and aluminum cans a year, with deposits of EUR 0.15–0.25 designed to lift container return rates to 90% by 2029.


Europe Refillable And Reusable Packaging Market Report Scope
The Europe refillable and reusable packaging market evaluates revenue generated from refillable and reusable packaging solutions. The analysis encompasses both B2B (business-to-business) and B2C (business-to-consumer) markets, with a focus on industries committed to sustainability and circular-economy practices. The study excludes products designed for household use, such as metal containers or bottles for personal storage, and service costs tied to refilling, reconditioning, or maintenance.
The Europe Refillable and Reusable Packaging Market Report is Segmented by Material (Plastic, Glass, Metal, and Wood), Product Type (Bottles, Pallets and Crates, Intermediate Bulk Containers, Drums and Barrels, Boxes and Cartons, Other Product Types), End-User Industry (Food and Beverage, Cosmetics and Personal Care, Chemicals and Petrochemicals, Shipping and Transportation, E-commerce and Retail Fulfilment, and Other End-user Industries), and Country (United Kingdom, Germany, France, Italy, Spain, Poland, and Rest of Europe). The Market Forecasts are Provided in Terms of Value (USD).
| Plastic |
| Glass |
| Metal |
| Wood |
| Bottles |
| Pallets and Crates |
| Intermediate Bulk Containers |
| Drums and Barrels |
| Boxes and Cartons |
| Other Product Types |
| Food and Beverage |
| Cosmetics and Personal Care |
| Chemicals and Petrochemicals |
| Shipping and Transportation |
| E-commerce and Retail Fulfilment |
| Other End-user Industries |
| United Kingdom |
| Germany |
| France |
| Italy |
| Spain |
| Poland |
| Rest of Europe |
| By Material | Plastic |
| Glass | |
| Metal | |
| Wood | |
| By Product Type | Bottles |
| Pallets and Crates | |
| Intermediate Bulk Containers | |
| Drums and Barrels | |
| Boxes and Cartons | |
| Other Product Types | |
| By End-User Industry | Food and Beverage |
| Cosmetics and Personal Care | |
| Chemicals and Petrochemicals | |
| Shipping and Transportation | |
| E-commerce and Retail Fulfilment | |
| Other End-user Industries | |
| By Country | United Kingdom |
| Germany | |
| France | |
| Italy | |
| Spain | |
| Poland | |
| Rest of Europe |


Key Questions Answered in the Report
How big is the Europe refillable and reusable packaging market in 2026?
It reached USD 38.58 billion in 2026 and is projected to hit USD 48.92 billion by 2031.
What CAGR is expected for Europe refillable and reusable packaging through 2031?
The market is forecast to grow at a 4.87% CAGR over the 2026-2031 period.
Which material holds the largest share in European refillable and reusable packaging?
Plastic leads with a 58.43% share thanks to its lighter weight and compliance with hygiene standards.
Which product segment is growing fastest?
Intermediate bulk containers show the highest growth at a 5.64% CAGR through 2031.
Why are deposit-return schemes important for reusable packaging growth?
They guarantee high recovery rates, lower litter, and provide a regulatory push that boosts asset pooling investment.
Which country is expanding most quickly?
Poland is advancing at a 6.21% CAGR due to automotive and e-commerce supply-chain investments.
Page last updated on:


