Europe Rigid Plastic Packaging Market Size and Share
Market Overview
| Study Period | 2020 - 2031 |
|---|---|
| Forecast Data Period | 2026 - 2031 |
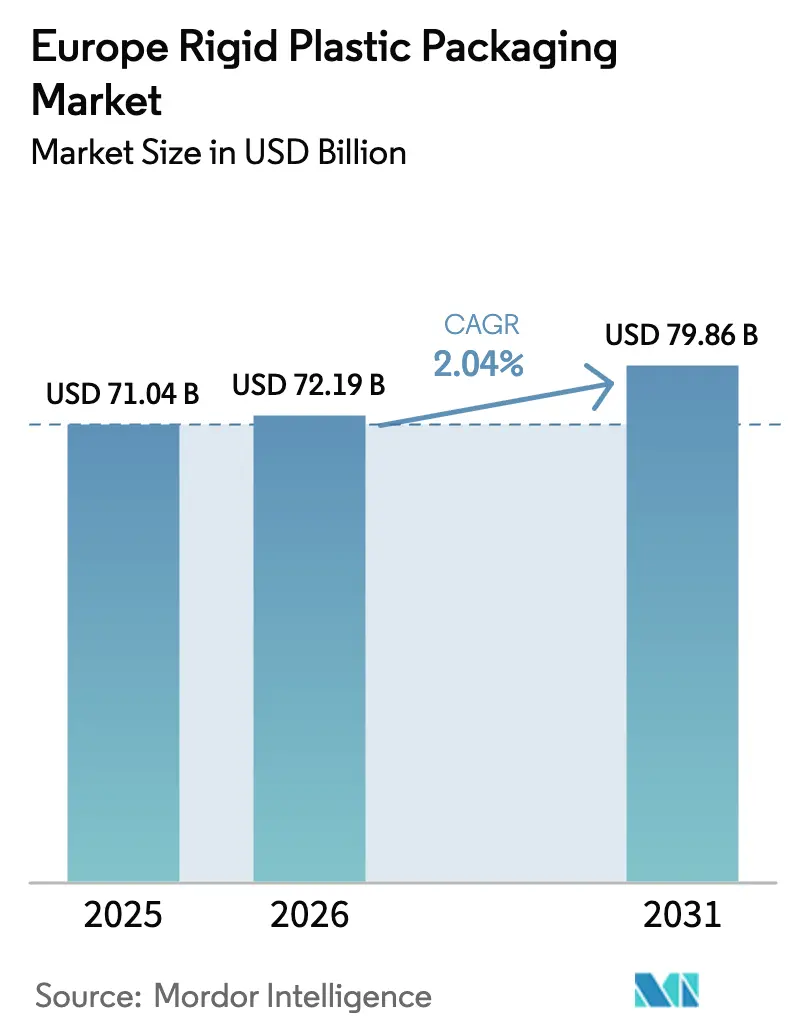
| Base Year Market Size (2025) | USD 71.04 Billion |
| Market Size (2026) | USD 72.19 Billion |
| Market Size (2031) | USD 79.86 Billion |
| Growth Rate (2026 - 2031) | 2.04% CAGR |
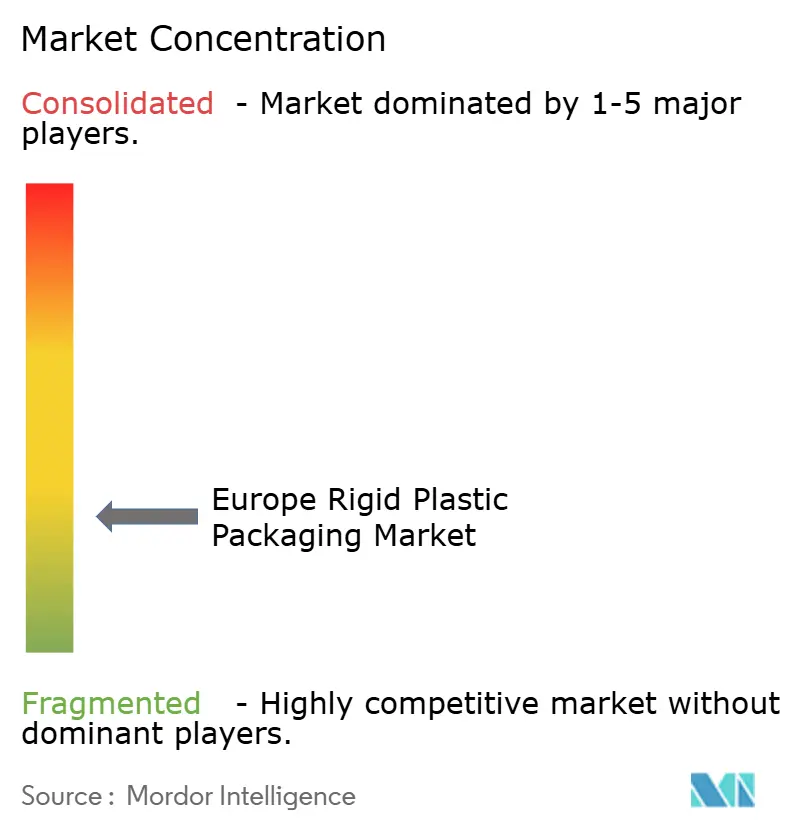
| Market Concentration | Low |
Major Players *Disclaimer: Major Players sorted in no particular order Image © Mordor Intelligence. Reuse requires attribution under CC BY 4.0. | |
Europe Rigid Plastic Packaging Market Analysis by Mordor Intelligence
The Europe rigid plastic packaging market size is projected to expand from USD 71.04 billion in 2025 and USD 72.19 billion in 2026 to USD 79.86 billion by 2031, registering a CAGR of 2.04% between 2026 to 2031. Mandatory recycled-content quotas and the proliferation of deposit-return schemes are lifting demand for high-density polyethylene and polyethylene terephthalate, even as single-use-plastic taxes and lightweight flexible substitutes temper overall volume growth. Brand owners are redesigning bottles meeting tethered-cap rules in July 2024, while converters race to secure recycled-resin feedstock through vertical integration. Energy-price volatility is accelerating investment in electric servo-driven extrusion and injection systems that trim power consumption by up to 40%, preserving margins during periods of natural-gas shocks. Rapid bioplastics scale-up, especially polylactic acid and bio-based polyethylene, is opening premium niches in cosmetics and industrial chemicals, yet feedstock costs remain a hurdle for mass adoption.
Key Report Takeaways
- By product type, bottles and jars led with 46.65% market share in 2025, while caps and closures is projected to advance at a 3.37% CAGR through 2031.
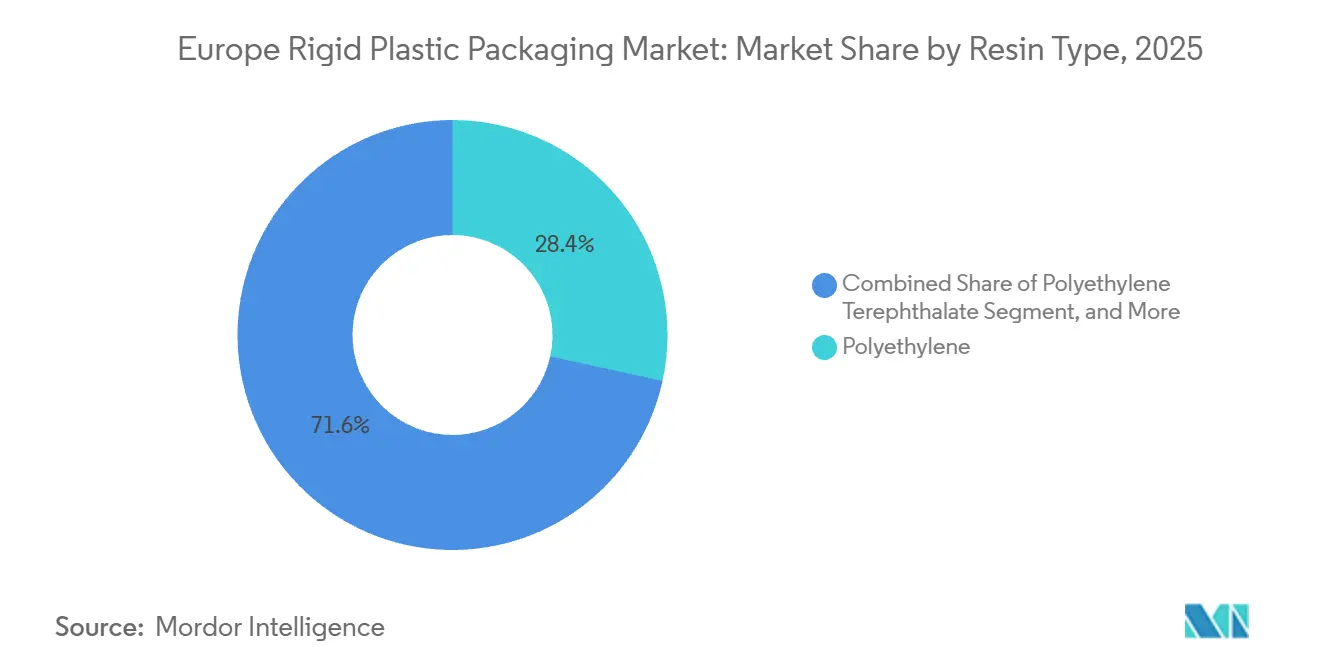
- By resin type, polyethylene accounted for 28.43% of the Europe rigid plastic packaging market share in 2025; polyethylene terephthalate is forecast to expand at a 3.12% CAGR to 2031.
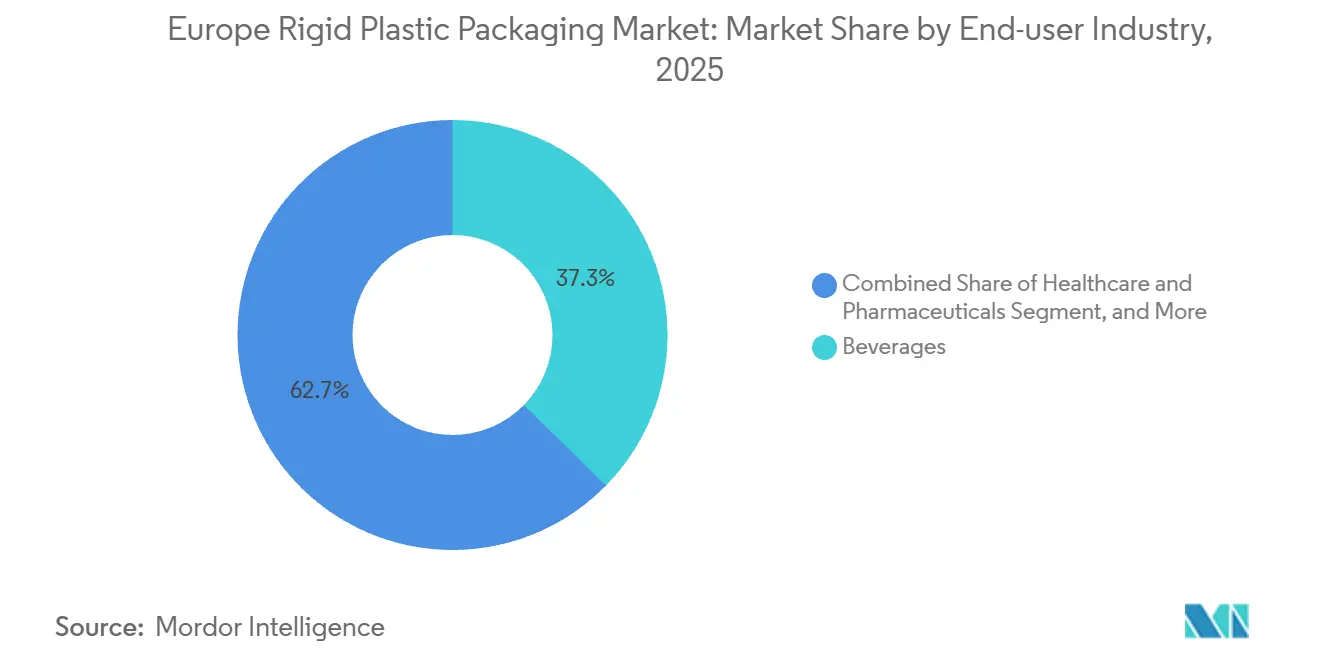
- By end-user industry, beverages held 37.34% share in 2025, whereas healthcare and pharmaceuticals is the fastest-growing segment at 4.23% CAGR through 2031.
- By manufacturing process, blow moulding dominated with nearly 40% of market share in 2025, but thermoforming is on track for a 3.68% CAGR over 2026-2031.
- By country, Germany commanded 21.54% in 2025, while Poland is poised to record the highest CAGR of 3.96% through 2031.
Note: Market size and forecast figures in this report are generated using Mordor Intelligence’s proprietary estimation framework, updated with the latest available data and insights as of 2026.
Europe Rigid Plastic Packaging Market Trends and Insights
Drivers Impact Analysis*
| Driver | (~) % Impact on CAGR Forecast | Geographic Relevance | Impact Timeline |
|---|---|---|---|
| Surging Demand for Recyclable Rigid PET Bottles in Beverages | +0.9% | Germany, Netherlands, France, Nordic countries | Medium term (2-4 years) |
| Booming E-Commerce Boosting Protective Rigid Formats | +0.6% | Germany, United Kingdom, France, Poland | Short term (≤ 2 years) |
| Growth of EU Deposit-Return Schemes Accelerating Collection Infrastructure | +0.8% | Germany, Netherlands, Poland, Lithuania, France, Spain | Medium term (2-4 years) |
| Rapid Scale-Up of European Bioplastics Capacity | +0.4% | Germany, Italy, Netherlands, Belgium | Long term (≥ 4 years) |
| Refill-and-Reuse Store Pilots Driving HDPE Bottle Redesigns | +0.3% | Netherlands, Germany, United Kingdom, France | Long term (≥ 4 years) |
| Pharma Cold-Chain Expansion Needing High-Barrier Rigid Packs | +0.7% | Germany, Switzerland, Belgium, Ireland | Medium term (2-4 years) |
| Source: Mordor Intelligence | |||
Surging Demand for Recyclable Rigid PET Bottles in Beverages
Beverage producers are shifting to 100% recyclable PET to meet the European Union’s 25% recycled-content rule by 2025 and the 30% threshold by 2030, spurring investment in bottle-to-bottle recycling in Germany, the Netherlands, and France. Germany’s deposit network captured 98.5% of PET containers in 2025, supplying roughly 450,000 tonnes of food-grade rPET feedstock.[1]Deutsche Umwelthilfe, “Getränke in Mehrweg und Einweg 2025,” duh.de Spot prices for Western European rPET averaged EUR 1,200-1,500 per tonne (USD 1,356-1,695 per tonne) yet brand owners lock in multi-year contracts that mute volatility.[2]International Chemical Information Service, “European rPET Pricing Report,” icis.com Stretch-blow-moulding upgrades trimmed average water-bottle weight from 18 g to 15 g, cutting resin use by 17%. Continued regulatory pressure and consumer preference for transparent sustainability claims are forecast to drive double-digit rPET bottle demand through 2028.
Booming E-Commerce Boosting Protective Rigid Formats
Western Europe’s online retail share rose to 22% of total sales in 2025, up from 18% in 2023, heightening demand for rigid trays, clamshells, and reusable HDPE crates that protect fragile goods during urban last-mile delivery. Returnable transport packaging adopted in Polish fulfillment hubs withstands 50-100 cycles and lowers per-trip cost by 40% relative to corrugated alternatives. Thermoformed polypropylene trays with snap-fit lids are replacing secondary cardboard for e-grocery produce, reducing overall packaging weight by 25%. Cosmetics brands favor rigid jars with tamper-evident closures to elevate unboxing experiences in direct-to-consumer channels. This structural shift suggests that e-commerce-oriented rigid formats will continue to outpace traditional retail packaging, especially in dense metro markets served by same-day couriers.
Growth of EU Deposit-Return Schemes Accelerating Collection Infrastructure
Nationwide deposit systems launched in France and Spain in 2025, extending coverage to 350 million Europeans and targeting 90% recovery of PET and aluminum by 2029. Germany’s Pfand system processed 3.1 billion PET bottles in 2025, while the Netherlands added 150 million sub-1 L bottles after expanding its program in January 2025. Poland’s Warsaw-Krakow pilot achieved an 85% return rate within six months, prompting a 2027 national rollout. Converters are co-locating washing lines with bottle plants to secure captive rPET and slash logistics costs by up to 15%. Broader DRS coverage is expected to stabilize rPET pricing once long-term offtake contracts replace spot trades in 2028.
Rapid Scale-Up of European Bioplastics Capacity
European bioplastics capacity reached 1.2 million tonnes in 2025, led by polylactic acid, bio-PE, and PHAs, which together accounted for 65% of output. Novamont added 30,000 tonnes of Mater-Bi in Italy in 2024, targeting rigid industrial-chemical containers. BASF’s pilot line for bio-PP in Ludwigshafen came online in early 2025 for cosmetics jars that comply with ISO 14855 compostability. Bio-based PE still carries a 40-50% premium over fossil grades, confining uptake to premium personal-care and specialty-food niches. The proposed EU Packaging and Packaging Waste Regulation introduces incentives for bio-attributed content, a move that could lift bioplastics to 7% of rigid-packaging volume by 2031.
Restraints Impact Analysis*
| Restraint | (~) % Impact on CAGR Forecast | Geographic Relevance | Impact Timeline |
|---|---|---|---|
| Single-Use-Plastic Taxes and Extended Producer Responsibility Fees | -0.5% | United Kingdom, Spain, Italy, France, Poland | Short term (≤ 2 years) |
| Shift Toward Paper and Flexible Substitutes for Lightweighting | -0.4% | Germany, France, Netherlands, Nordic countries | Medium term (2-4 years) |
| Energy-Price Shocks Raising Extrusion and Injection Costs | -0.3% | Germany, Italy, Poland, Spain | Short term (≤ 2 years) |
| Volatile rPET and rHDPE Prices Squeezing Converter Margins | -0.3% | Germany, France, United Kingdom, Netherlands | Medium term (2-4 years) |
| Source: Mordor Intelligence | |||
Single-Use-Plastic Taxes and Extended Producer Responsibility Fees
The United Kingdom levies GBP 210.82 per tonne (USD 274 per tonne) on packaging containing less than 30% recycled content, increasing converter costs by roughly 10% in 2025.[3]UK HM Revenue and Customs, “Plastic Packaging Tax Rates,” gov.uk Spain’s EUR 0.45 per kg (USD 0.51 per kg) tax, in place since 2023, spurred meat processors to switch from polystyrene trays to fiber-based alternatives. Italy’s eco-modulation scheme charges EUR 0.05-0.80 per kg (USD 0.06-0.90 per kg) based on recyclability, penalizing multilayer packs. Smaller thermoformers lacking scale are therefore prime consolidation targets, as seen in multiple 2025 acquisitions across Poland and the Czech Republic. Administrative reporting burdens divert resources from innovation, and fee harmonization discussions suggest further tightening through 2028.
Shift Toward Paper and Flexible Substitutes for Lightweighting
Paper and flexible film displaced about 4% of traditional rigid plastic in 2025, particularly in dry-food, personal-care sachets, and chemical pouches. German grocers Aldi and Lidl swapped fiber trays for produce and bakery, cutting rigid demand by 12,000 tonnes annually. Stand-up pouches save 60% in weight compared to polypropylene jars in pet food, yet require multilayer constructions that complicate recycling. Paper trays require polymer coatings for moisture resistance, which limits their acceptance in many municipal systems. Because rigid structures still outperform on puncture resistance and cold-chain integrity, substitution is expected to plateau near 7% of Europe rigid plastic packaging market volume by 2031.
*Our forecasts treat driver/restraint impacts as directional, not additive. The impact forecasts reflect baseline growth, mix effects, and variable interactions.
Segment Analysis
By Resin Type: PET Gains on Recycled-Content Mandates
Polyethylene retained 28.43% market share in 2025, anchored by high-density bottles for dairy, detergents and transport crates. In contrast, polyethylene terephthalate is forecast to grow 3.12% annually through 2031, propelled by deposit-return schemes that widen rPET feedstock and by EU rules mandating 30% recycled PET in bottles by 2030. Bottle-to-bottle recycling capacity climbed to 2.8 million tonnes in 2025, yet a 15% shortfall keeps rPET at a premium, reinforcing converter investments in washing and flake lines close to beverage plants.
Chemical recycling pilots, such as Eastman’s 160,000-tonne glycolysis unit in Normandy, are expected to boost food-grade supply beyond 2027. Polypropylene, holding roughly 23% of volume, remains a staple for hot-fill trays and pharmaceutical blister packs that demand heat resistance and clarity. Refill pilots by consumer-goods majors use durable HDPE bottles engineered for 10-15 refill cycles, trimming virgin resin per use by one-third. Despite polystyrene declines tied to French and Belgian foam bans, PET’s momentum will likely narrow the gap with polyethylene before 2029, shifting the Europe rigid plastic packaging market size composition toward higher-recycled-content formats.


By Product Type: Caps and Closures Accelerate on Tethered Designs
Bottles and jars dominated with 46.65% share in 2025, servicing beverages, dairy and personal care. However, caps and closures are on pace for the strongest 3.37% CAGR through 2031 as every beverage player converts to tethered-cap geometry to satisfy July 2024 Single-Use Plastics Directive rules. Retooling costs of EUR 50,000-150,000 (USD 56,500-169,500) per cavity have prompted exit by small moulders, shifting volume toward large closure specialists.
Lightweighted PET bottles, already down to 15 g for 500 mL water, exemplify material-efficiency gains without sacrificing drop performance. Rigid polypropylene trays capture 30% volume in produce and chilled food, resisting the creep of paper trays where moisture is a concern. Intermediate bulk containers, predominantly HDPE drums, remain indispensable for chemicals and coatings, and adoption of leasing models is expected to open recurring revenue streams. Overall, caps will likely keep outpacing other product lines as design guidelines become uniform across the bloc, reinforcing tooling investment and consumer-education spending.
By End-User Industry: Healthcare Outpaces Beverages
Beverages provided 37.34% of market share in 2025, but healthcare and pharmaceuticals will deliver a 4.23% CAGR, narrowing the gap by the decade’s end. Cold-chain biologics, gene therapies, and personalized medicines push for cyclic-olefin and polypropylene vials that tolerate -20 °C logistics and maintain low extractables. Annex 1 updates from the European Medicines Agency elevate sterility requirements, prompting drug-makers to shift to pre-sterilized rigid packs, a tailwind for converters able to certify ISO-class manufacturing rooms.
While functional drinks and plant-based dairy sustain small-format PET bottle volumes, tap-water adoption and reusable personal bottles restrain growth in mainstream categories. Food applications, roughly one-fifth of volume, are caught between single-use bans and shelf-life needs, driving the switch from expanded polystyrene to polypropylene or PET trays compatible with municipal recycling lines. High-barrier multilayer packs for extended-shelf-life dairy represent a white-space opportunity in the Europe rigid plastic packaging industry.
By Manufacturing Process: Thermoforming Gains On Lightweighting
Injection moulding covered 24.77% of market share in 2025, vital for precision caps and durable containers. Thermoforming, set for a 3.68% CAGR, benefits from forming 0.3-0.5 mm polypropylene sheets into dairy trays that weigh 25-30% less than injection counterparts, cutting transport emissions. Blow moulding still owns nearly 40% of the Europe rigid plastic packaging market size, yet rising power prices have sped adoption of all-electric machines that lower energy draw by up to 40%.
Pharmaceutical blister packs rely on thermoformed cavities with aluminum lidding that extends tablet shelf life by 12-18 months. Compression moulding remains niche but is gaining interest for cyclic-olefin copolymer vials, where controlled cooling ensures optical clarity. Energy-intensive blow moulders continue to hedge volatility with renewable-power sourcing agreements, preserving competitiveness against thermoforming’s material-efficiency edge.
Geography Analysis
Germany held 21.54% of regional revenue in 2025, underpinned by the Pfand deposit system that yields 450,000 tonnes of food-grade rPET annually and by pharmaceutical clusters in Baden-Württemberg and Bavaria that demand sterile rigid vials. Poland is the fastest-growing market at 3.96% CAGR, fueled by nearshored moulding capacity and booming e-commerce fulfillment centers; Greiner’s 25,000-tonne tray plant in Poznań exemplifies the capital influx. The United Kingdom, with 14-16% volume, is navigating divergent post-Brexit recycled-content thresholds that raise administrative expense for converters serving both UK and EU customers.
France captures a 13-15% share, anchored by premium cosmetics players that consume up to 100,000 tonnes of rigid jars and bottles yearly. Its nationwide deposit scheme, launched in 2025, adds 200 million PET bottles to the recycling stream. Italy and Spain together represent nearly one-fifth of volume, with Italy’s mozzarella and pasta sectors driving thermoformed tray demand, while Spain’s agriculture relies on HDPE drums for fertilizers. The Netherlands, though accounting for only 4-5% of volume, piloted refill-and-reuse HDPE bottle systems that reduce virgin resin use by 30% per use. Nordic nations lead in deposit-return adoption, and Central-Eastern states like Czechia and Hungary attract investment in industrial-chemical packaging, rounding out regional demand.
Central and Eastern Europe outside Poland is also gathering momentum as automotive, electronics and industrial-chemical suppliers diversify away from Western European cost centers. Hungary approved incentives for two multinational blow-moulders in June 2025, tying tax credits to the installation of energy-efficient all-electric machines that curb power demand by 35%. The Czech Republic’s automotive hub around Ostrava is stimulating HDPE-drum demand for lubricants and battery-electrolyte additives, with volumes growing faster than national GDP. Nordic nations such as Norway and Sweden continue to post collection rates above 90% for PET and aluminum beverage containers, underpinning a robust regional supply of food-grade rPET even though their absolute market sizes remain small. Across the Adriatic, Greece is piloting a voluntary deposit-return scheme on the islands of Crete and Rhodes, an early step toward a national rollout that could unlock fresh rPET feedstock for southern converters by 2028. These divergent policy landscapes underscore how local legislation, industrial mix and foreign direct investment together shape the trajectory of country-level growth within the Europe rigid plastic packaging market.
Competitive Landscape
The market is fragmented, with players including Alpla, Amcor, Greiner, Plastipak, Silgan, and others. Alpla’s 50% stake in PET Recycling Team secured 60,000 tonnes of rPET for bottle-to-bottle loops, illustrating the rush toward backward integration. Amcor’s co-located washing lines trim logistics costs by 15% and ensure a food-grade resin supply. Greiner’s five-year pact with Eastman guarantees 20,000 tonnes of chemically recycled polyester annually, bypassing color-sorting limits.
Technology upgrades are redefining cost curves; Plastipak’s near-infrared sorters reach 99.5% clear-PET purity, winning price premiums of 5-8%. Mauser’s circular leasing of intermediate bulk containers converts one-off drum sales into recurring service fees, lowering customer capex by up to 50%. Disruptors like RETAL expanded Polish preform capacity by 30,000 tonnes to offer short lead times to Eastern European beverage brands. Competitive advantage will hinge on access to recycled-resin supply, an agile footprint, and design-for-recycling services as EU rules progressively tighten.
Digitalization is emerging as the next battleground. Several mid-tier converters have begun installing cloud-connected mould sensors that capture cavity-level pressure and temperature data, enabling predictive maintenance and reducing unplanned downtime by up to 20%. Blockchain pilots are also underway to trace recycled-resin batches from collection to conversion, a feature that large retailers increasingly require for audit purposes. At the design front end, generative topology software is helping engineers cut wall thickness without compromising drop resistance, shortening development cycles for lightweight jars and closures to mere weeks. Sustainability credentials now influence customer tenders as strongly as price, meaning converters that demonstrate verifiable reductions in scope-3 emissions stand to gain preferred-supplier status with multinational brand owners. Against this backdrop, privately held regional specialists focused on high-barrier or pharmaceutical niches remain attractive acquisition targets for the top five players seeking both scale and technology differentiation.
Europe Rigid Plastic Packaging Industry Leaders
Alpla Werke Alwin Lehner GmbH & Co KG
Amcor plc
Greiner Packaging International GmbH
PACCOR Packaging GmbH (Faerch Group)
Silgan Holdings Inc.
- *Disclaimer: Major Players sorted in no particular order

Recent Industry Developments
- January 2026: Amcor earmarked EUR 120 million (USD 135 million) to raise PET-bottle output in Wrocław, Poland, by 40,000 tonnes annually, featuring stretch-blow equipment that cuts weight 15%.
- December 2025: Greiner Packaging sealed a five-year deal with Eastman Chemical for 20,000 tonnes of chemically recycled polyester each year to exceed EU recycled-content targets.
- October 2025: Plastipak boosted HDPE-bottle capacity in Łódź, Poland, by 15,000 tonnes using servo-driven extrusion lines that slash energy use 30%.
- September 2025: Silgan Holdings bought a Netherlands closures maker for EUR 85 million (USD 96 million), expanding tethered-cap capability ahead of the 2024 deadline.


Europe Rigid Plastic Packaging Market Report Scope
The market study tracks demand for rigid plastic packaging products across the food, foodservice, beverage, healthcare, personal care, and cosmetic industries; industrial, building and construction, and automotive industries; and other end-user industries. Rigid plastics can be of different grades and different material combinations based on the type of product being packed, like polyethylene, polypropylene, polyvinyl chloride, polyethylene terephthalate, bioplastics, and other materials.
The Europe Rigid Plastic Packaging Market Report is Segmented by Resin Type (Polyethylene, Polyethylene Terephthalate, Polypropylene, Polystyrene and EPS, and Other Resins), Product Type (Bottles and Jars, Trays and Containers, Caps and Closures, Intermediate Bulk Containers (IBCs), Drums, and Other Products), End-user Industry (Food, Beverage, Healthcare and Pharmaceuticals, Cosmetics and Personal Care, Industrial Chemicals, Building and Construction, and Other End-users), Manufacturing Process (Injection Moulding, Blow Moulding, Thermoforming, Compression Moulding, Extrusion, and Other Processes), and Country (United Kingdom, Germany, France, Italy, Spain, Poland, Netherlands, and Rest of Europe). The Market Forecasts are Provided in Terms of Value (USD).
| Polyethylene | High-Density Polyethylene (HDPE) |
| Low-Density Polyethylene (LDPE) | |
| Linear Low-Density Polyethylene (LLDPE) | |
| Polyethylene Terephthalate | |
| Polypropylene | |
| Polystyrene and EPS | |
| Other Resin Types |
| Bottles and Jars |
| Trays and Containers |
| Caps and Closures |
| Intermediate Bulk Containers (IBCs) |
| Drums |
| Other Product Types |
| Food | Candy and Confectionery |
| Dairy and Frozen | |
| Meat, Poultry and Seafood | |
| Other Food Types | |
| Beverage | |
| Healthcare and Pharmaceuticals | |
| Cosmetics and Personal Care | |
| Industrial Chemicals | |
| Building and Construction | |
| Other End-user Industries |
| Injection Moulding |
| Blow Moulding |
| Thermoforming |
| Compression Moulding |
| Extrusion |
| Other Manufacturing Process |
| United Kingdom |
| Germany |
| France |
| Italy |
| Spain |
| Poland |
| Netherlands |
| Rest of Europe |
| By Resin Type | Polyethylene | High-Density Polyethylene (HDPE) |
| Low-Density Polyethylene (LDPE) | ||
| Linear Low-Density Polyethylene (LLDPE) | ||
| Polyethylene Terephthalate | ||
| Polypropylene | ||
| Polystyrene and EPS | ||
| Other Resin Types | ||
| By Product Type | Bottles and Jars | |
| Trays and Containers | ||
| Caps and Closures | ||
| Intermediate Bulk Containers (IBCs) | ||
| Drums | ||
| Other Product Types | ||
| By End-user Industry | Food | Candy and Confectionery |
| Dairy and Frozen | ||
| Meat, Poultry and Seafood | ||
| Other Food Types | ||
| Beverage | ||
| Healthcare and Pharmaceuticals | ||
| Cosmetics and Personal Care | ||
| Industrial Chemicals | ||
| Building and Construction | ||
| Other End-user Industries | ||
| By Manufacturing Process | Injection Moulding | |
| Blow Moulding | ||
| Thermoforming | ||
| Compression Moulding | ||
| Extrusion | ||
| Other Manufacturing Process | ||
| By Country | United Kingdom | |
| Germany | ||
| France | ||
| Italy | ||
| Spain | ||
| Poland | ||
| Netherlands | ||
| Rest of Europe | ||


Key Questions Answered in the Report
What is the current value of the Europe rigid plastic packaging market?
It stands at USD 72.19 billion in 2026 and is projected to reach USD 79.86 billion by 2031.
Which segment is growing fastest within regional rigid plastics?
Healthcare and pharmaceuticals, with a 4.23% CAGR through 2031.
Why are caps and closures attracting fresh investment?
EU rules require tethered caps from July 2024, pushing converters to retool and boosting demand for new closures.
How are deposit-return schemes influencing resin supply?
They raise PET bottle collection to near-90% levels, expanding rPET feedstock and stabilizing prices.
Which country is set to record the highest growth?
Poland, expected to grow 3.96% annually thanks to nearshoring and e-commerce logistics demand.
What strategies help converters secure recycled resin?
Backward integration into washing lines, long-term offtake agreements with chemical recyclers and co-location with bottle plants.
Page last updated on:


