Refillable And Reusable Packaging Market Size and Share
Market Overview
| Study Period | 2021 - 2031 |
|---|---|
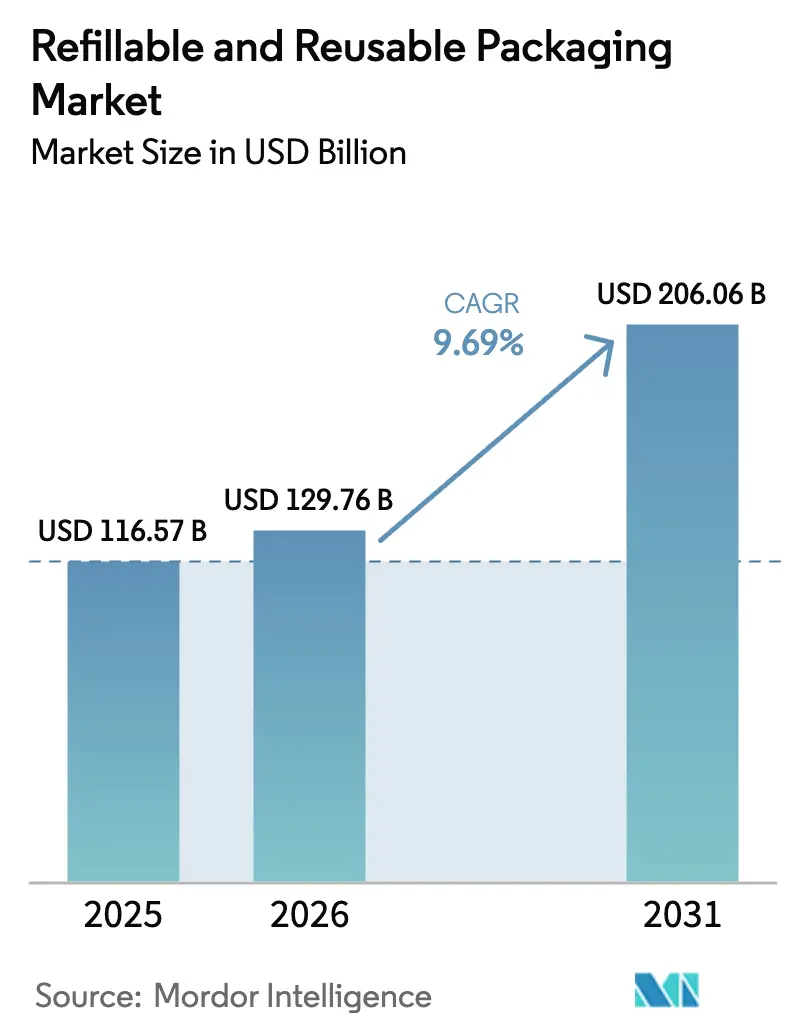
| Market Size (2026) | USD 129.76 Billion |
| Market Size (2031) | USD 206.06 Billion |
| Growth Rate (2026 - 2031) | 9.69% CAGR |
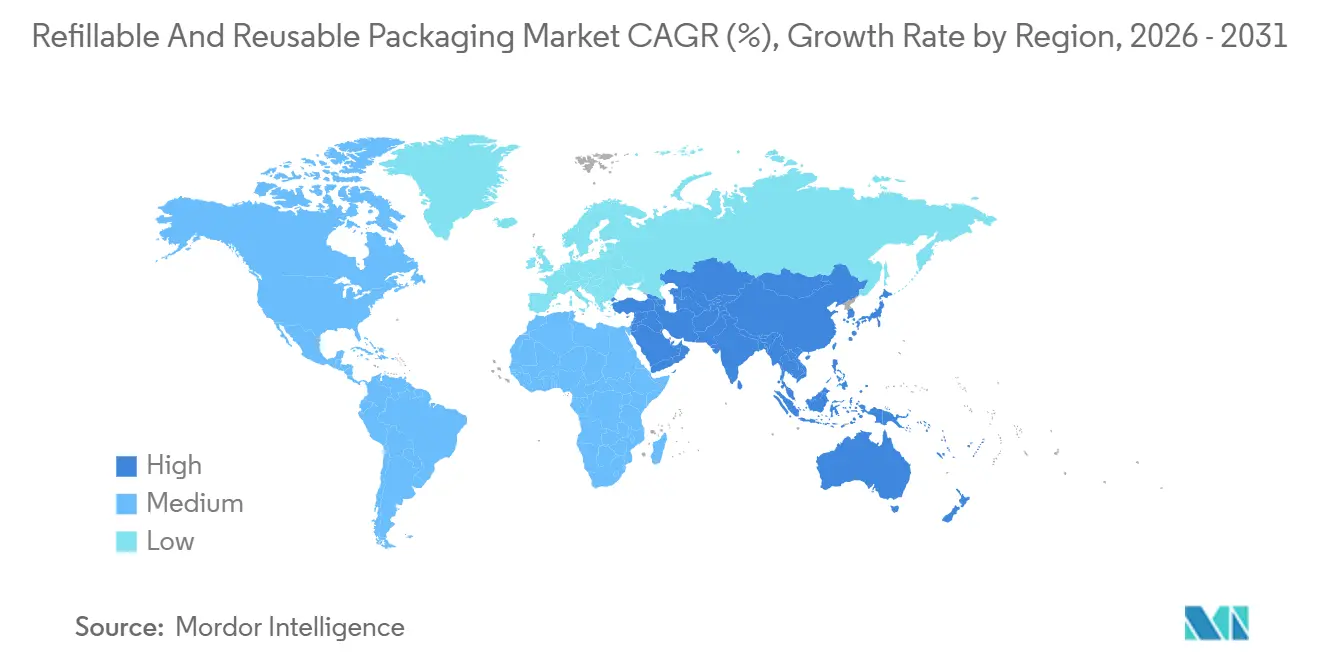
| Fastest Growing Market | Asia Pacific |
| Largest Market | Europe |
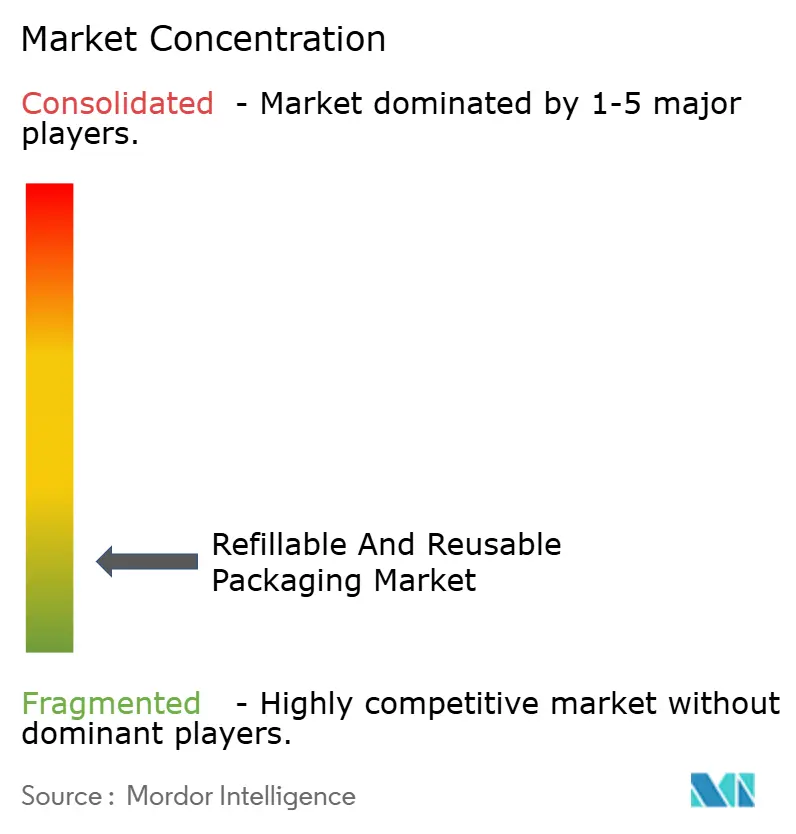
| Market Concentration | Low |
Major Players *Disclaimer: Major Players sorted in no particular order Image © Mordor Intelligence. Reuse requires attribution under CC BY 4.0. | |
Refillable And Reusable Packaging Market Analysis by Mordor Intelligence
The refillable and reusable packaging market size is projected to expand from USD 116.57 billion in 2025 and USD 129.76 billion in 2026 to USD 206.06 billion by 2031, registering a CAGR of 9.69% between 2026 to 2031. Growing legislative pressure, escalating zero-waste commitments, and maturing reverse-logistics platforms are accelerating the migration away from single-use formats. Brand owners are front-loading capital into durable containers because rising virgin-plastic taxes are shrinking the historical cost gap. Supply-chain operators also find that standardized multi-trip assets cut damage rates and improve truck utilization, pushing boardrooms to treat reuse as an operational efficiency play rather than a pure sustainability expense. At the same time, digital tracking layers are turning every container into a data node, enabling predictive pickup schedules that lower dwell time and support credible ESG reporting. Collectively, these forces are expected to reinforce the long-term expansion of the refillable and reusable packaging market.
Key Report Takeaways
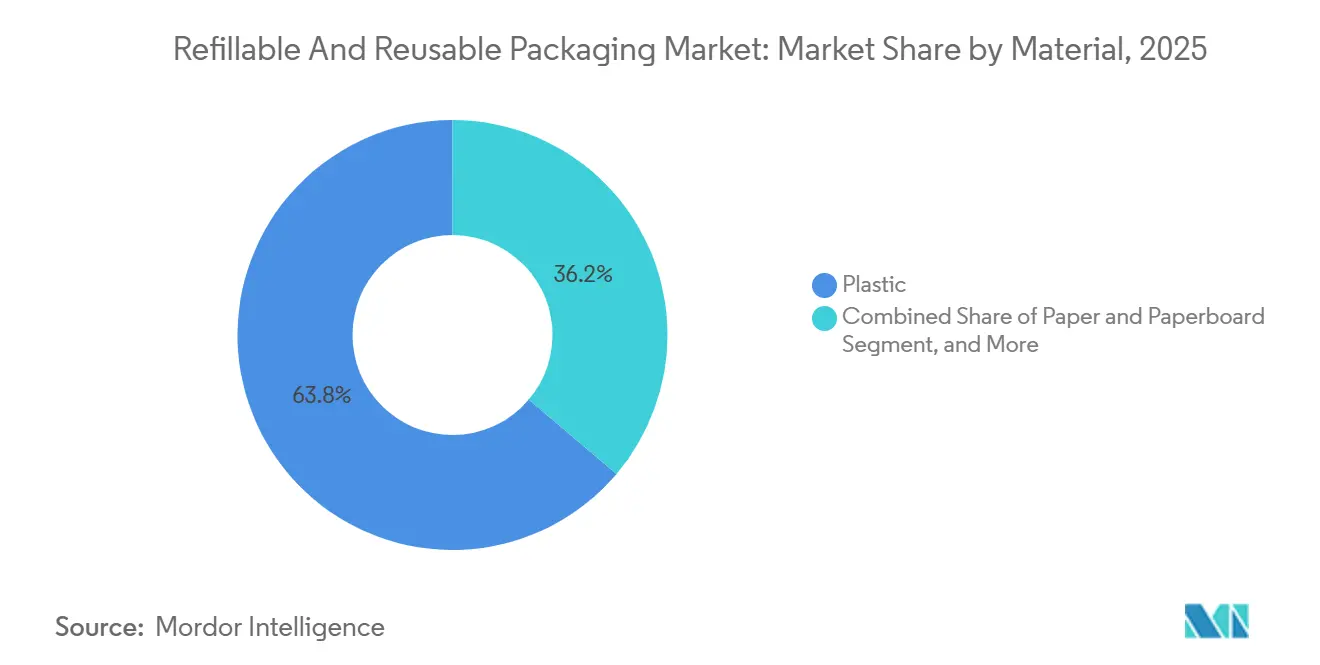
- By material, plastic led with 63.82% of the refillable and reusable packaging market share in 2025, while metal is advancing at a 10.43% CAGR through 2031.
- By product, pallets and crates commanded 52.12% of the refillable and reusable packaging market in 2025, whereas intermediate bulk containers are projected to expand at a 11.07% CAGR during 2026-2031.
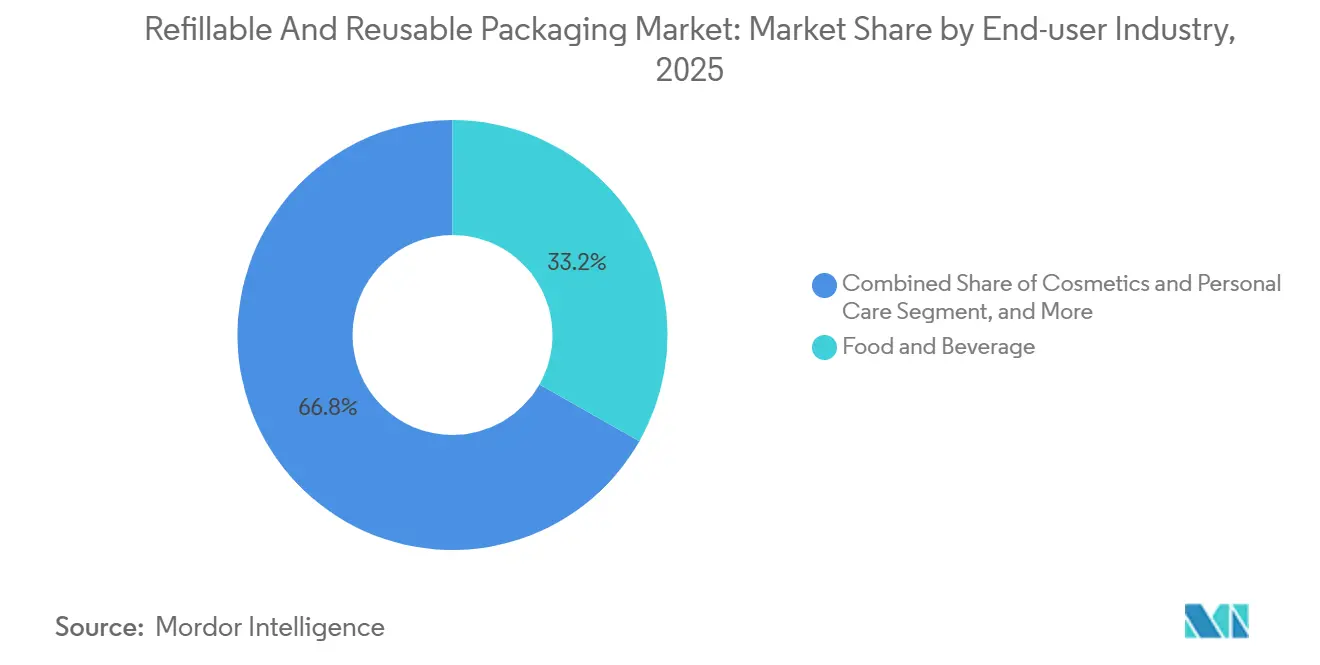
- By end-user industry, food and beverage accounted for 33.23% of the refillable and reusable packaging market share in 2025, and shipping and transportation is pacing the sector with an 11.03% CAGR to 2031.
- By geography, Asia-Pacific accounted for 35.34% of revenue in 2025 and is forecast to grow at a 10.64% CAGR, the fastest among all regions.
Note: Market size and forecast figures in this report are generated using Mordor Intelligence’s proprietary estimation framework, updated with the latest available data and insights as of 2026.
Global Refillable And Reusable Packaging Market Trends and Insights
Drivers Impact Analysis*
| Driver | (~) % Impact on CAGR Forecast | Geographic Relevance | Impact Timeline |
|---|---|---|---|
| Legislative Push Towards Circular-Economy Mandates | +2.8% | Europe, Asia-Pacific core, spillover to North America | Medium Term (2–4 Years) |
| Cost Savings From Closed-Loop Supply Chains | +2.1% | Global, with early gains in North America and Europe | Short Term (≤ 2 Years) |
| Consumer Preference For Sustainable Brands | +1.5% | Europe and North America, emerging in Asia-Pacific urban centers | Medium Term (2–4 Years) |
| Emerging IoT-Enabled Refill-On-The-Go Retail | +1.3% | North America and Europe, pilot deployments in Asia-Pacific | Long Term (≥ 4 Years) |
| ESG-Linked Zero-Waste Corporate Financing | +0.9% | Global, concentrated in publicly listed multinationals | Medium Term (2–4 Years) |
| Polymer-To-Polymer Cleaning Breakthroughs | +0.7% | Global, with R&D hubs in Europe and North America | Long Term (≥ 4 Years) |
| Source: Mordor Intelligence | |||
Legislative Push Towards Circular-Economy Mandates
Regulators across Europe and Asia-Pacific have upgraded voluntary reuse goals into binding quotas, forcing packaging decision-makers to redesign formats for multi-trip performance. The European Union now requires 10% reusable transport packaging by 2030 and 20% by 2040, while France accelerated adoption by obligating hypermarkets to install bulk-refill stations beginning in 2025.[1]European Commission, “Packaging and Packaging Waste Regulation,” euroPA.eu China scaled its deposit-return scheme to cover 420 million residents in 2025, diverting an extra 2.3 billion beverage containers into closed-loop channels. South Korea’s tiered landfill levy also tilts cost competitiveness toward reusable crates for electronics and auto parts. Because compliance penalties can quickly erase thin consumer-goods margins, boardrooms are prioritizing reuse infrastructure in capital budgets, cementing a durable tailwind for the refillable and reusable packaging market.
Cost Savings From Closed-Loop Supply Chains
When return rates stabilize above 80% and containers exceed 20 life-cycle trips, operating costs trend below those of single-use alternatives. A pooled-crate study showed 12%-18% end-to-end logistics savings compared with corrugate, largely through reduced product damage and improved truck utilization. Automotive suppliers that shifted to steel racks recouped their capital within 2 years and subsequently realized pure margins with each additional cycle. In Germany, beverage producers amortized bottle costs over 40-50 refills by achieving 98% return rates, cutting packaging outlay per hectoliter by more than 20%. These economics underpin the rapid scaling of the refillable and reusable packaging market.
Consumer Preference For Sustainable Brands
Mainstream shoppers increasingly view packaging waste as a deciding factor in purchase decisions. A 2025 survey found that 64% of Europeans and 58% of North Americans were willing to switch brands for refillable alternatives, and two-fifths accepted a moderate price premium.[2]PwC Analysts, “Global Consumer Insights Pulse Survey 2025,” pwc.com Beauty brands monetized that sentiment; a refillable lipstick line captured 14% of the prestige market share within 9 months of launch. Similar loyalty dynamics surfaced in concentrated detergent pouches, where repeat-purchase rates exceeded 90%. These shifts funnel additional volume into the refillable and reusable packaging market.
Emerging IoT-Enabled Refill-On-The-Go Retail
Smart containers embedded with RFID or sensor arrays are transforming packaging into a data platform that supports predictive collection and personalized promotions. Loop Industries achieved 89% tote return within 48 hours by combining location pings with automated SMS nudges. In Europe, tracked parcel bags generated behavioral datasets that merchants resold to logistics partners. Blockchain pilots in Asia-Pacific, meanwhile, allow multiple brands to share container pools without revealing sensitive volume flows. This digital layer increases asset utilization, further enlarging the economic moat of the refillable and reusable packaging market.
Restraints Impact Analysis*
| Restraint | (~) % Impact on CAGR Forecast | Geographic Relevance | Impact Timeline |
|---|---|---|---|
| High Reverse-Logistics Costs | -1.4% | Global, acute in low-density rural corridors | Short Term (≤ 2 Years) |
| Ambiguity In Food-Contact Reuse Standards | -0.9% | North America and Europe, regulatory divergence | Medium Term (2–4 Years) |
| Microbial-Contamination Risks In Tropical Zones | -0.6% | Asia-Pacific, Middle East, Africa, South America | Medium Term (2–4 Years) |
| Fragmented Track-And-Trace Data Protocols | -0.4% | Global, pronounced in Asia-Pacific and South America | Long Term (≥ 4 Years) |
| Source: Mordor Intelligence | |||
High Reverse-Logistics Costs
Reverse loops add USD 0.15-0.40 per container in handling, washing, and redistribution, eroding financial gains when return densities are thin.[3]Financial Times Correspondent, “Reverse-Logistics Economics of Reusable Packaging,” ft.com Rural pickup legs absorb more than half of that cost as trucks cover long distances partially loaded. Labor-heavy inspection processes push per-unit expenses higher, and volatile utility prices magnify washing overheads. While decentralized micro-wash hubs cut travel miles, their USD 2-5 million capital tag remains prohibitive for smaller brands. Until density thresholds are crossed, the refillable and reusable packaging market will contend with structural cost friction.
Ambiguity In Food-Contact Reuse Standards
Regulatory fragmentation forces multinationals to juggle multiple wash protocols and validation studies. The U.S. FDA insists on premarket consultations yet offers no harmonized residue benchmarks, compelling brands to fund bespoke migration analyses that can cost six-figure sums per format. Europe’s EFSA applies an “equivalent safety” clause, but individual states interpret it differently.[4] EFSA Panel, “Food Contact Materials Scientific Opinion,” efsa.europa.eu Asia-Pacific policies range widely, adding further complexity. The uncertainty slows capex decisions, tempering the growth trajectory of the refillable and reusable packaging market.
*Our forecasts treat driver/restraint impacts as directional, not additive. The impact forecasts reflect baseline growth, mix effects, and variable interactions.
Segment Analysis
By Material: Plastic Dominance Meets Glass Innovation
Metal containers are forecast to grow faster than the overall refillable and reusable packaging market, posting a 10.43% CAGR during 2026-2031. Stainless-steel intermediate bulk containers, already 38% of metal revenues in 2025, deliver 50-100 trips, far exceeding plastic counterparts and justifying the up-front premium. Aluminum kegs shorten chill cycles for craft brewers and extend shelf life, while RFID-enabled steel drums now meet pharmaceutical traceability rules.
Plastic retains the lion’s share today because of its low cost and manufacturing scalability. However, virgin-plastic surcharges in Europe and rising EPR fees globally are eroding that edge, nudging value chains toward hybrid or all-metal alternatives. Paper-based mailers continue to carve a niche in fashion e-commerce returns, and lightweight glass finds favor in premium cosmetics. These shifts indicate a gradual material rebalance inside the refillable and reusable packaging market.


By Product: Intermediate Bulk Containers Capture Industrial Upside
Intermediate bulk containers are the fastest-growing product, expanding at an 11.07% CAGR on booming demand from chemicals and food processing. One 1,000-liter IBC replaces scores of drums, slashing labor and warehouse footprints while improving traceability FT.COM. Composite IBCs dominate volume due to their balanced weight and durability, whereas all-metal designs win in highly corrosive applications.
Pallets and crates still account for more than half of product revenue, anchored by entrenched pooling models in grocery and automotive channels. Yet growth is moderating as operators migrate capital toward asset-intensive formats with stronger payback math. Bottles, drums, cartons, and pails each serve specialized roles that depend on local collection hubs. This evolving product mix illustrates the broadening opportunity landscape across the refillable and reusable packaging market.
By End-User Industry: Logistics Providers Accelerate Pooling Adoption
Shipping and transportation are projected to clock an 11.03% CAGR as third-party logistics firms standardize pooled pallets, reusable dunnage, and collapsible air-cargo boxes. One study found plastic pallets cut loading times by over one-fifth and boosted worker throughput, savings that aggregate quickly in hub-and-spoke networks. Intermodal carriers are likewise experimenting with reusable cushioning systems that nest compactly on return legs, improving asset turns.
Food and beverage remains the largest buyer today. Deposit-return regimes in Northern Europe achieve world-leading 95%-plus bottle recovery rates, allowing breweries and dairies to stretch container life to 40-50 refills. Cosmetics, household care, chemicals, and construction materials collectively deepen market penetration, each driven by distinct safety, branding, or waste-diversion imperatives. This diversity solidifies the long-run momentum of the refillable and reusable packaging market.
Geography Analysis
Asia-Pacific accounted for 35.34% of 2025 revenue and is projected to compound at 10.64% annually through 2031, the fastest regional growth rate. China’s province-wide expansion of deposit-return, India’s integration of informal collectors, and South Korea’s landfill levy combine to pull large container volumes into organized reverse loops. Japan’s mature bottle infrastructures further reinforce baseline demand, while Southeast Asian incentives for RFID and wash-plant investments are building network density.
Europe follows with roughly 30% of 2025 sales, propelled by binding reuse targets under the Packaging and Packaging Waste Regulation. France, Germany, and the Netherlands showcase near-perfect bottle-return ecosystems that are now extending to crates and transport packaging. The United Kingdom’s 2025 launch of a GBP 0.20 (USD 0.25) deposit scheme is forecast to divert billions of units annually, accelerating domestic adoption.
North America accounts for about one-fifth of turnover, driven by voluntary corporate pledges rather than overarching federal mandates. Multinationals have set 25%-50% refillable targets for 2030, and innovative platforms like Loop Industries are scaling tote networks across major metro areas. Canada’s draft national deposit framework and Mexico’s successful pooled-crate pilots hint at regulatory tightening in the medium term. South America, the Middle East, and Africa contribute the balance, with South Africa’s minimum-reuse standards and Brazil’s updated EPR fees acting as early growth catalysts. Diverse policy timing across these regions ensures a staggered, multi-year expansion path for the wider refillable and reusable packaging market.
Mordor Intelligence provides coverage of the refillable and reusable packaging market across other key regional markets, including Europe, each with their regulatory frameworks and demand patterns.

Competitive Landscape
The top five suppliers together hold just 18%-22% of global revenue, underscoring a market that rewards localized wash-and-fill scale rather than centralized manufacturing muscle. Pooling giants IFCO Systems and Orbis Corporation operate 50-plus depots per continent, bundling container rental, cleaning, and tracking in turnkey service contracts that embed them deeply in client workflows. Vertically integrated packaging makers such as Greif and Mondi, meanwhile, are adding captive wash capacity to keep quality control in-house; Greif now runs 14 industrial wash sites that process 18 million IBCs every year.
Digital-native disruptors like Loop Industries and RePack monetize granular asset data. Their IoT-enabled fleets have cut customer buffer stock needs by close to one-fifth, and established players are racing to retrofit comparable telemetry via RFID partnerships. Intellectual-property filings in polymer-to-polymer cleaning jumped 34% year on year in 2025, signaling a technology arms race to unlock food-contact reuse without energy-intensive steam sterilization.
M&A activity is intensifying as regional operators seek scale economies. Greif’s USD 95 million stake in a Chinese pooling network and Amcor’s planned USD 180 million Indian wash hub illustrate a broader push to secure footholds in high-growth corridors. Capital barriers for micro-wash nodes remain a hurdle for small brands, setting the stage for joint-venture consortiums that co-finance infrastructure and pave the road toward a more consolidated refillable and reusable packaging market.
Refillable And Reusable Packaging Industry Leaders
International Paper
Nefab Group
IFCO Systems
Schoeller Allibert Services BV
Orbis Corporation
- *Disclaimer: Major Players sorted in no particular order

Recent Industry Developments
- February 2026: Amcor PLC committed USD 180 million to build a reusable-packaging wash and distribution center in Pune, India, with operations slated for Q3 2027.
- January 2026: Greif Inc. acquired a 60% stake in a Chinese IBC pooling network for USD 95 million, boosting its Asia-Pacific footprint to 22 wash sites and 8,500 client locations.
- December 2025: Smurfit WestRock piloted a blockchain platform that lets European retailers pool corrugated containers across brands, cutting idle inventory 14%.
- November 2025: IFCO Systems and a German grocery coalition rolled out 5 million RFID-tagged produce crates, trimming transport emissions 18%.
- October 2025: Mondi PLC opened a EUR 65 million (USD 70 million) Vienna innovation hub for polymer-to-polymer cleaning and automated inspection.


Global Refillable And Reusable Packaging Market Report Scope
The Refillable And Reusable Packaging Market Report is Segmented by Material (Plastic, Paper And Paperboard, Metal, Glass), Product (Bottles And Containers, Pallets And Crates, Intermediate Bulk Containers, Drums And Barrels, Boxes And Cartons, Cans And Pails, Other Products), End-User Industry (Food And Beverage, Cosmetics And Personal Care, Household Care, Chemicals And Petrochemicals, Building And Construction, Shipping And Transportation, Other End-User Industries), and Geography (North America, South America, Europe, Asia-Pacific, Middle East, Africa). The Market Forecasts are Provided in Terms of Value (USD).
| Plastic |
| Paper And Paperboard |
| Metal |
| Glass |
| Bottles And Containers |
| Pallets And Crates |
| Intermediate Bulk Containers (IBCs) |
| Drums And Barrels |
| Boxes And Cartons |
| Cans And Pails |
| Other Products, Rest Of Product |
| Food And Beverage |
| Cosmetics And Personal Care |
| Household Care |
| Chemicals And Petrochemicals |
| Building And Construction |
| Shipping And Transportation |
| Other End-User Industries, Rest Of End-User Industry |
| North America | United States |
| Canada | |
| Mexico | |
| South America | Brazil |
| Argentina | |
| Rest Of South America | |
| Europe | Germany |
| United Kingdom | |
| France | |
| Italy | |
| Spain | |
| Russia | |
| Rest Of Europe | |
| Asia-Pacific | China |
| Japan | |
| India | |
| South Korea | |
| South-East Asia | |
| Rest Of Asia-Pacific | |
| Middle East | Saudi Arabia |
| United Arab Emirates | |
| Turkey | |
| Rest Of Middle East | |
| Africa | South Africa |
| Nigeria | |
| Rest Of Africa |
| By Material | Plastic | |
| Paper And Paperboard | ||
| Metal | ||
| Glass | ||
| By Product | Bottles And Containers | |
| Pallets And Crates | ||
| Intermediate Bulk Containers (IBCs) | ||
| Drums And Barrels | ||
| Boxes And Cartons | ||
| Cans And Pails | ||
| Other Products, Rest Of Product | ||
| By End-User Industry | Food And Beverage | |
| Cosmetics And Personal Care | ||
| Household Care | ||
| Chemicals And Petrochemicals | ||
| Building And Construction | ||
| Shipping And Transportation | ||
| Other End-User Industries, Rest Of End-User Industry | ||
| By Geography | North America | United States |
| Canada | ||
| Mexico | ||
| South America | Brazil | |
| Argentina | ||
| Rest Of South America | ||
| Europe | Germany | |
| United Kingdom | ||
| France | ||
| Italy | ||
| Spain | ||
| Russia | ||
| Rest Of Europe | ||
| Asia-Pacific | China | |
| Japan | ||
| India | ||
| South Korea | ||
| South-East Asia | ||
| Rest Of Asia-Pacific | ||
| Middle East | Saudi Arabia | |
| United Arab Emirates | ||
| Turkey | ||
| Rest Of Middle East | ||
| Africa | South Africa | |
| Nigeria | ||
| Rest Of Africa | ||


Key Questions Answered in the Report
How large will global spending on refillable and reusable formats be by 2031?
The refillable and reusable packaging market size is forecast to reach USD 206.06 billion by 2031, rising from USD 129.76 billion in 2026.
Which material type is growing fastest in multi-trip applications?
Metal containers, led by stainless-steel intermediate bulk containers, are expanding at a 10.43% CAGR through 2031.
Why are logistics providers investing in pooled pallet networks?
Standardized reusable pallets cut trailer cube waste, shorten loading times by more than 20%, and support high asset-turn ratios, translating into lower total delivered cost.
What is the main regulatory driver behind reuse in Europe?
The EU Packaging and Packaging Waste Regulation mandates that 10% of transport packaging be reusable by 2030 and 20% by 2040.
How does smart tracking improve container economics?
RFID and sensor-equipped assets provide real-time location data, enabling predictive pickups that reduce idle inventory by up to 20% and curb loss or theft.
Are return rates high enough to justify investment in deposit-return systems?
Mature schemes in Germany and the Nordics achieve 95%-98% bottle returns, allowing producers to amortize containers over 40-50 trips and lower per-hectoliter packaging spend by more than 20%.
Page last updated on:


