
Environmental Health And Safety (EHS) Software Market Size and Share
Market Overview
| Study Period | 2020 - 2031 |
|---|---|
| Market Size (2026) | USD 2.48 Billion |
| Market Size (2031) | USD 3.92 Billion |
| Growth Rate (2026 - 2031) | 9.64 % |
| Fastest Growing Market | Asia Pacific |
| Largest Market | North America |
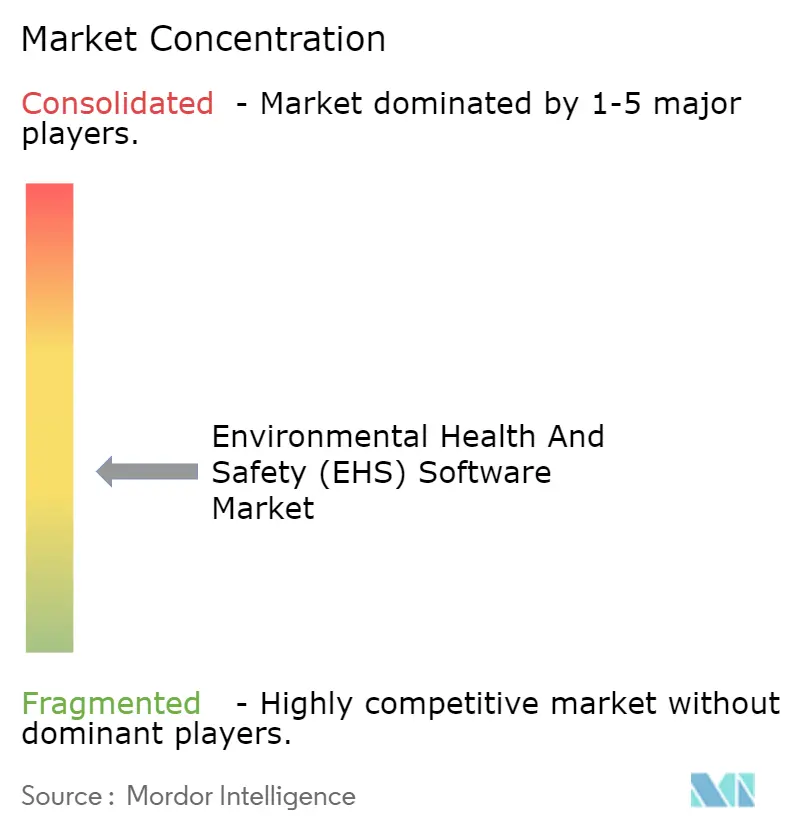
| Market Concentration | Medium |
Major Players *Disclaimer: Major Players sorted in no particular order Image © Mordor Intelligence. Reuse requires attribution under CC BY 4.0. | |
Environmental Health And Safety (EHS) Software Market Analysis by Mordor Intelligence
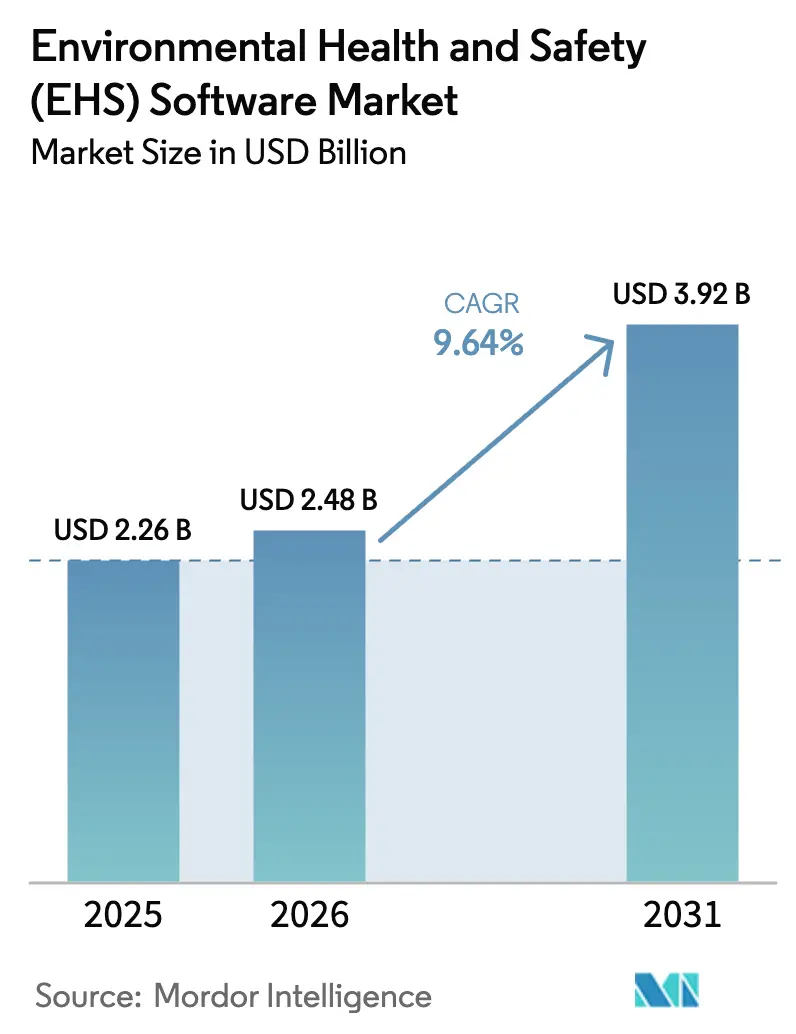
The Environmental Health And Safety Software Market size was valued at USD 2.26 billion in 2025 and is estimated to grow from USD 2.48 billion in 2026 to reach USD 3.92 billion by 2031, at a CAGR of 9.64% during the forecast period (2026-2031). Organizations now view EHS platforms as a strategic risk-intelligence layer that shapes insurance premiums, ESG ratings, and operational resilience instead of a compliance checkbox. Intensifying regulatory enforcement, especially in the United States and the European Union, is accelerating the shift from spreadsheets to real-time, cloud-native systems. Boards are also linking executive compensation to decarbonization goals, pushing ESG and carbon modules to the top of procurement lists. At the same time, software vendors are embedding artificial intelligence to predict incidents before they occur, strengthening business cases that hinge on lower injury rates and reduced insurance costs.
Key Report Takeaways
- By component, software captured 70.22% of 2025 revenue, while services are set to expand at an 11.42% CAGR through 2031.
- By deployment, cloud architectures represented 74.52% of 2025 spending and are advancing at a 12.84% CAGR over the outlook period.
- By solution type, incident and safety management led with a 35.64% slice of the EHS software market share in 2025, whereas ESG and carbon management tools are forecast to grow at an 11.68% CAGR to 2031.
- By organization size, large enterprises accounted for 64.52% of 2025 outlays; small and mid-sized enterprises are adopting at a 12.12% CAGR to 2031.
- By end-user, energy and utilities held 22.84% revenue share in 2025; healthcare and life sciences are set to register a 10.24% CAGR through 2031.
- By geography, North America maintained 37.46% of 2025 revenue; Asia Pacific is projected to post a 10.48% CAGR to 2031.
Note: Market size and forecast figures in this report are generated using Mordor Intelligence’s proprietary estimation framework, updated with the latest available data and insights as of January 2026.
Market Trends and Insights
Drivers Impact Analysis of Environmental Health And Safety (EHS) Software Market*
| Driver | (~) % Impact on CAGR Forecast | Geographic Relevance | Impact Timeline |
|---|---|---|---|
| Stringent Regulatory Enforcement and Rising Liability Exposure | +2.1% | Global, with peak intensity in North America and Europe | Short term (≤ 2 years) |
| Expansion of ESG and Sustainability Reporting Mandates | +1.8% | Global, led by Europe and North America, expanding to Asia Pacific | Medium term (2-4 years) |
| SaaS-first, Mobile-first EHS Platforms Reduce TCO | +1.5% | Global, with accelerated adoption in Asia Pacific and emerging markets | Medium term (2-4 years) |
| AI-driven Predictive Safety and Compliance Analytics | +1.3% | North America and Europe core, spillover to Asia Pacific manufacturing hubs | Long term (≥ 4 years) |
| Convergence with Digital Twin and Asset Management Stacks | +0.9% | North America and Europe industrial sectors, pilot deployments in Asia Pacific | Long term (≥ 4 years) |
| Corporate Insurance Linking Premiums to Real-time EHS Metrics | +0.7% | North America and Europe, early adoption in Australia | Medium term (2-4 years) |
| Source: Mordor Intelligence | |||


Stringent Regulatory Enforcement and Rising Liability Exposure
United States OSHA lifted maximum penalties for willful violations to USD 165,514 and serious violations to USD 16,550 in 2025, moving annual adjustments to an indexed model that climbs each January. Public violation databases heighten reputational risk, prompting companies to automate audit trails and corrective-action records. In parallel, the European Union harmonized occupational safety directives with ISO 45001, nudging multinationals toward a single global platform that satisfies both Brussels and Washington. Chevron’s Operations Excellence Management System earned ISO 14001:2015 and ISO 45001:2018 recertification for the 2025-2028 cycle, illustrating how integrated software underpins dual environmental and safety compliance.[1]Chevron Corporation, “Operations Excellence Management System ISO Certification,” chevron.com Heightened personal-liability statutes in China and South Korea further reinforce the business case for predictive, auditable systems.
Expansion of ESG and Sustainability Reporting Mandates
The United States SEC’s March 2024 climate-disclosure rules require large accelerated filers to furnish assured Scope 1 and Scope 2 emissions, nudging firms toward platforms that merge environmental, safety, and carbon data streams. Europe’s Corporate Sustainability Reporting Directive extends detailed disclosures to 50,000 entities, including non-EU companies with sizable regional activity. Demand for ESG and carbon modules is climbing at an 11.68% CAGR because these tools automate data pulls from meters, asset systems, and supplier portals, then map them into disclosure templates. Sphera and Evonik’s TÜV-certified automated life-cycle assessment tool slashes product-footprint reporting cycles from weeks to hours, underscoring the operational upside.
SaaS-First, Mobile-First EHS Platforms Reduce TCO
Cloud deployments accounted for 74.52% of 2025 spending and deliver savings by eliminating on-premise servers, database licenses, and patch cycles. Mobile interfaces let frontline workers capture photos, voice notes, and geotagged observations, cutting the lag between hazard detection and remediation from days to minutes. CPChem’s SWIFT electronic permitting system processed 65,000 digital permits in 2024, shrinking approval windows from 48 hours to under 4 hours. Vendors bundle disaster-recovery and penetration-testing controls, easing CIO concerns while converting capital expense into predictable subscription fees.
AI-Driven Predictive Safety and Compliance Analytics
Cority’s Cortex AI engine mines near-miss logs, sensor telemetry, and maintenance data to flag emerging risks and recommend interventions before incidents materialize. Intelex released real-time data-quality validation that automatically highlights anomalous emissions figures and faulty sensor inputs, reducing the likelihood of erroneous regulatory filings. Early adopters report measurable declines in recordable injury rates and lower insurance premiums as underwriters begin referencing predictive-risk dashboards.
Restraints Impact Analysis of Environmental Health And Safety (EHS) Software Market*
| Restraint | (~) % Impact on CAGR Forecast | Geographic Relevance | Impact Timeline |
|---|---|---|---|
| High Upfront Implementation and Change-management Cost | -1.4% | Global, with acute impact on SMEs in Asia Pacific and South America | Short term (≤ 2 years) |
| Cyber-security and Data-privacy Concerns in Cloud Roll-outs | -0.9% | Global, with heightened sensitivity in Europe (GDPR) and China (data localization) | Medium term (2-4 years) |
| Shortage of Data-science Talent for Next-gen EHS Tools | -0.7% | Global, most acute in North America and Europe | Long term (≥ 4 years) |
| Vendor Consolidation Creating Integration Lock-in Risk | -0.5% | Global, affecting enterprises with multi-vendor IT stacks | Medium term (2-4 years) |
| Source: Mordor Intelligence | |||
High Upfront Implementation and Change-Management Cost
A 5,000-employee deployment often exceeds USD 500,000 when licenses, consulting, data migration, and training are bundled, straining budgets for mid-tier manufacturers. Capital outlays compete with production upgrades, creating a deferral cycle that slows adoption even where long-run savings are clear. Change-management hurdles compound the burden: supervisors accustomed to clipboards resist new workflows, and harmonizing legacy taxonomies with modern data models absorbs scarce implementation hours. For many small and mid-sized enterprises, limited EHS staffing means project leadership falls to plant managers who juggle production targets alongside transformation tasks, extending timelines and diluting accountability.
Cyber-Security and Data-Privacy Concerns in Cloud Roll-Outs
Moving facility layouts, hazardous-material inventories, and incident records into multi-tenant clouds elevates exposure. Europe’s GDPR and China’s data-security laws restrict cross-border transfers, pushing vendors to launch regional data centers and maintain sovereign clouds that add cost and architectural complexity. Defense contractors and chemical producers worry that a breach could reveal sensitive process details, trigger shareholder lawsuits, and invite regulatory probes. Vendor consolidation heightens risk when newly merged platforms integrate disparate codebases, occasionally weakening controls during migration phases. Enterprises now demand SOC 2 Type II attestations and zero-trust architectures as contract prerequisites, extending procurement cycles.
*Our forecasts treat driver/restraint impacts as directional, not additive. The impact forecasts reflect baseline growth, mix effects, and variable interactions.
Environmental Health And Safety (EHS) Software Market Segment Analysis
By Component:
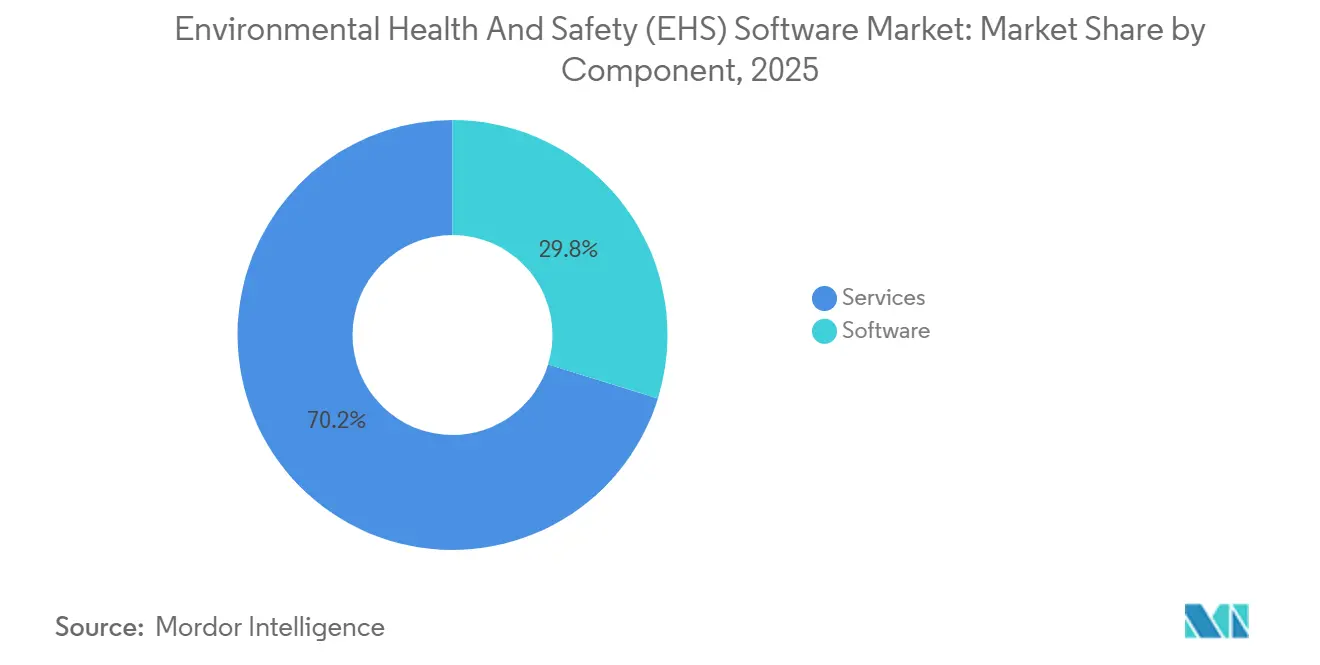
Services Climb as Integration Needs Outpace Software MaturityThe services slice of the EHS software market posted an 11.42% CAGR outlook, outperforming software revenue growth despite software commanding 70.22% of 2025 turnover. Consulting engagements covering current-state mapping, API development, and multi-language user training routinely span 12 to 18 months for global roll-outs. Managed services appeal to mid-sized firms that prefer OpEx over CapEx, handing vendors the keys to upgrades, regulatory-rule updates, and help-desk support.
AI implementations are enlarging the services pipeline. Data-science teams tune machine-learning models, validate risk scores, and craft executive dashboards that convert raw predictions into board-ready insights. Parallel efforts to certify disclosures under new SEC and EU rules generate demand for assurance and data-lineage validation, again tilting budgets toward service providers. The modularization of incident, audit, ESG, and training tools multiplies integration points, ensuring that services remain the fastest-growing component through 2031.

By Deployment Mode:
Cloud Dominance Rooted in Cost and Update VelocityCloud deployments held 74.52% share in 2025 and are tracking a 12.84% CAGR through 2031 in the environmental health and safety (EHS) software market. Continuous delivery lets vendors push regulatory templates within days of a new OSHA form or EU annex, a cadence on-premise customers cannot match without weekend maintenance windows and staff overtime. Subscription pricing spreads costs evenly, an advantage for enterprises under pressure to align cash flow with revenue.
On-premise installs persist in defense, nuclear, and certain Chinese operations where data-sovereignty laws require in-country hosting. However, five-year total cost modeling shows cloud deployments 30-40% cheaper once hardware refresh cycles, database patching, and disaster-recovery drills are counted. IoT sensor expansion reinforces the trend: streaming vibration, gas, and air-quality data directly into cloud dashboards is easier than installing edge servers at every site.
By Solution Type:
ESG and Carbon Modules Outpace Legacy Incident ToolsIncident and safety management retained 35.64% revenue share in 2025, yet ESG and carbon management modules are rising at an 11.68% CAGR as boards link executive bonuses to decarbonization milestones. The environmental health and safety (EHS) software market size for ESG solutions is forecast to widen rapidly because new disclosure regimes demand auditable, time-stamped emissions ledgers instead of annual spreadsheet uploads. TÜV-certified life-cycle assessment add-ons compress customer-questionnaire response times, turning compliance into a procurement advantage for suppliers.
Audit and inspection modules still act as onboarding gateways for sectors such as construction that perform mandated walkthroughs each quarter. Training modules are increasingly embedded, auto-assigning refreshers after near-miss entries. Integration pressures mount as buyers favor best-of-breed stacks, encouraging API marketplaces and low-code connectors to tie disparate modules together.
By Organization Size:
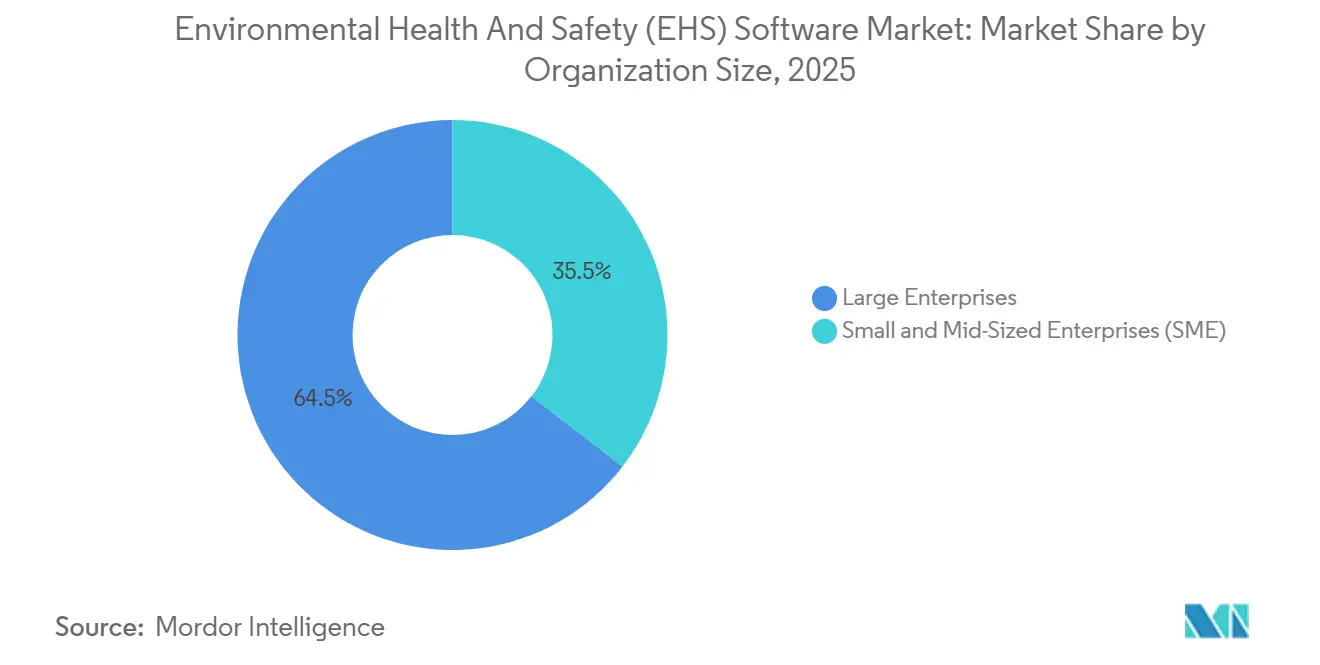
Mobile-First SaaS Narrows the Enterprise–SME GapLarge enterprises accounted for 64.52% of 2025 spending, but SME adoption is growing at 12.12% CAGR as mobile-first SaaS removes the server and database hurdles that historically blocked smaller firms. Subscription tiers with pay-as-you-grow seat counts match seasonal labor swings in construction and agriculture. SMEs also value pre-configured templates that embed local regulations, allowing deployments in weeks rather than quarters.
The EHS software market share gap is narrowing as vendors roll out self-service onboarding and AI chat-assistants that replace costly classroom training. Yet predictive-analytics benefits still skew toward enterprises that hold a decade of digitized incidents to feed machine-learning models. Vendors respond by offering anonymized, cross-client benchmarks so newer customers can bootstrap risk-scoring engines without extensive historical data.
By End-User Industry:
Healthcare Momentum Builds on EHR IntegrationEnergy and utilities retained 22.84% of 2025 revenue because unplanned outages and catastrophic events invite regulatory fines and investor backlash. Hospitals and life-science firms constitute the fastest-growing vertical at 10.24% CAGR, embedding EHS checks into electronic health records so infection-control teams can cross-reference staff exposures with patient outcomes. The environmental health and safety (EHS) software size for healthcare modules is set to accelerate as accreditation bodies demand proof of proactive worker-safety programs.
Oil and gas operators continue heavy investment to manage offshore drilling and LNG-terminal complexity, while chemicals firms use process-safety analytics to spot deviations before threshold breaches. Construction sites adopt mobile checklists that let supervisors geotag hazards and assign fixes without leaving the workface. Retail and logistics round out the long tail, drawn in by insurer incentives for real-time incident dashboards.
Geography Analysis
North America Environmental Health and Safety (EHS) Software Market
North America captured 37.46% of 2025 revenue, propelled by OSHA’s escalating penalties and the SEC’s climate-disclosure rule that effectively mandates continuous carbon accounting. High penetration among Fortune 500 firms intensifies competition for mid-market manufacturers and construction contractors still juggling clipboards and legacy databases. Vendor marketing increasingly highlights lower workers’ compensation premiums achieved by predictive-risk dashboards, resonating with CFOs seeking immediate savings.
Europe Environmental Health and Safety (EHS) Software Market
Europe follows closely, anchored by the Corporate Sustainability Reporting Directive, which obliges granular, digitized disclosures across 27 member states. ISO 45001 certification rates are highest in Germany, France, and the United Kingdom, reinforcing the regional appetite for platforms that harmonize audit workflows with sustainability metrics. Cloud uptake is tempered by GDPR requirements, yet sovereign-cloud offerings mitigate data-transfer anxieties, unlocking growth among chemical and aerospace firms.
APAC Environmental Health and Safety (EHS) Software Market
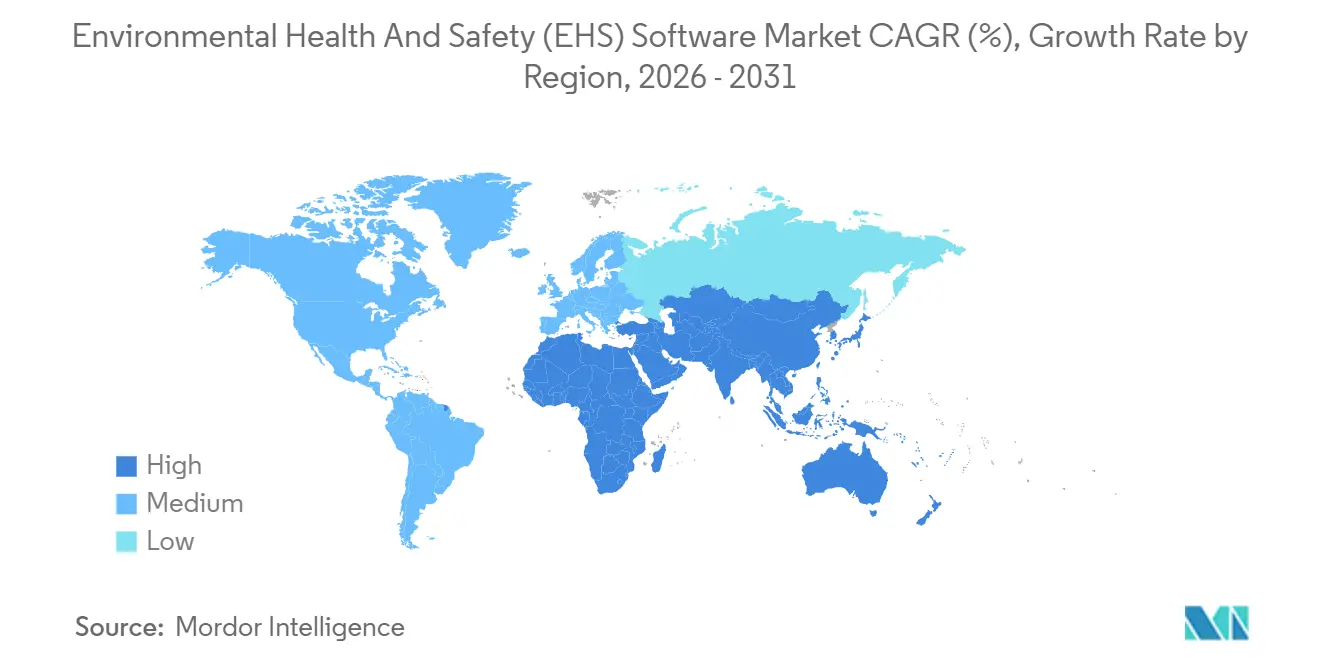
Asia Pacific is the fastest-growing theater at 10.48% CAGR in the environmental health and safety (EHS) software market. China’s revised Work Safety Law imposes criminal liability on executives after serious accidents, driving manufacturers to adopt real-time incident reporting and digital permit-to-work systems. India’s formal ISO 45001 guidance and new digital injury-reporting portal align local plants with multinational audit expectations. South Korea’s Serious Accidents Punishment Act, in force since 2022 but strictly enforced from 2024 onward, has catalyzed investments across shipbuilding and electronics supply chains.
MEA and South America Environmental Health and Safety (EHS) Software Market
The Middle East and Africa region gains momentum as national oil companies in Saudi Arabia and the United Arab Emirates embed EHS clauses into contractor agreements to satisfy Vision 2030 diversification goals. South Africa’s mining sector, historically plagued by high fatality rates, is shifting to cloud dashboards that surface geotechnical risks in near real-time. South America shows uneven progress: Brazil leads after high-profile dam and offshore incidents spurred Petrobras and Vale to fund enterprise-wide roll-outs, whereas smaller Andean markets remain in earlier adoption phases.

Regulatory Landscape
EHS software buying is anchored to auditable, regulator-facing digital records as enforcement tightens and reporting becomes more electronic. In the United States, OSHA increased maximum penalties in 2025 (USD 165,514 for willful violations and USD 16,550 for serious violations), which reinforces demand for time-stamped corrective actions, inspection evidence, and incident workflows that can withstand scrutiny.
Regulators are also pushing structured electronic submissions that favor platforms able to integrate with government portals. In February 2026, the U.S. EPA extended the Reporting Year 2025 deadline under the Greenhouse Gas Reporting Program to October 30, 2026, while EPA Technology Transitions reporting under the AIM Act routes submissions through Central Data Exchange (CDX) and the HAWK platform. This expands the need for standardized data capture and validation. In England, The Digital Waste Tracking (England) Regulations 2026 mandates a state-operated electronic system for controlled waste tracking from October 1, 2026, extending digital compliance beyond traditional workplace safety into environmental traceability workflows.
Value Chain Analysis
The EHS software value chain begins with data inputs (industrial IoT sensors, SCADA and maintenance systems, LIMS, HR systems, and regulatory content such as SDS libraries and emissions factors). These inputs then feed core platforms that normalize data, manage workflows (incident, audit, permits, risk and compliance), and generate disclosures for internal governance and external authorities. Delivery is increasingly cloud-first, with system integrators and specialized service partners handling data migration, taxonomy harmonization, configuration of regulatory templates, user training, and managed services for ongoing updates.
Ecosystem partnerships increasingly shape differentiation and distribution, particularly around AI and regulatory content. Cority collaborated with Google Cloud (announced December 2025) to integrate Gemini models into its Cortex AI suite, while 3E partnered with ServiceNow (announced December 2025) to embed 3E Protect SDS and indexed chemical data into ServiceNow Health and Safety Chemical Management. In parallel, 3E extended its partnership with SAP (announced November 2025) to deliver embedded regulatory content (including substance lists and occupational exposure limit values) for SAP S/4HANA product compliance and EHS. This reinforces the shift from standalone tools toward ERP- and workflow-platform-embedded EHS architectures connected by APIs.
Competitive Landscape
The environmental health and safety (EHS) software market remains fragmented, with no vendor exceeding 15% share. Strategic buyers and private-equity investors are accelerating consolidation, convinced that EHS suites now form integral digital infrastructure rather than discretionary IT spend. Thoma Bravo explored a USD 2 billion divestiture of Cority in 2024, and EQT paid USD 3 billion for Avetta, underscoring double-digit valuation multiples tied to recurring revenue.[2]Reuters, “EQT Acquires Avetta for $3 Billion,” reuters.com
Competitive playbooks revolve around vertical depth, horizontal breadth, and technology differentiation. Cority released its Cortex AI engine in 2025 to strengthen predictive capabilities, while Intelex shipped AI data-quality validation the same year. Baker Hughes teamed with C3 AI to embed generative AI into the Cordant platform, enabling conversational analytics that lower the skills barrier for frontline users.[3]Baker Hughes Company, “Baker Hughes and C3 AI Announce Strategic Alliance for Cordant Platform,” bakerhughes.com
IoT hardware makers are emerging disruptors by bundling sensors and dashboards, bypassing traditional software RFPs. Vendors also court insurers that increasingly tie premium discounts to the presence of real-time safety analytics, creating cross-selling channels into risk-management divisions. However, rapid consolidation raises lock-in worries for customers with multi-vendor stacks, pushing demand for open APIs and data-export guarantees.
Environmental Health And Safety (EHS) Software Industry Leaders
Cority Software Inc.
VelocityEHS Holdings Inc.
Intelex Technologies ULC
Sphera Solutions Inc.
Enablon France SA (Wolters Kluwer NV)
- *Disclaimer: Major Players sorted in no particular order
Environmental Health And Safety (EHS) Software Market Companies Covered in this Report
- Enablon France SA (Wolters Kluwer NV)
- Intelex Technologies ULC
- VelocityEHS Holdings Inc.
- Cority Software Inc.
- Sphera Solutions Inc.
- Sai Global Pty Ltd. (Intertek Group PLC)
- Dakota Software Corporation
- Benchmark Digital Partners LLC
- Quentic GmbH
- Metrix Software Solutions (Pty) Ltd. (IsoMetrix)
- SAP SE
- iPoint-Systems GmbH
- Evotix Limited
- DNV Business Assurance Group AS
- EcoOnline Holding AS
- ETQ, LLC (part of Hexagon)
- Origami Risk LLC
- Alcumus Holdings Limited
- Ideagen PLC
- Vector Solutions.com, Inc.
- KPA Services, LLC
- StarTex Software LLC (DBA EHS Insight)
- Quber Technologies, Inc.
- SafetyCulture Pty Ltd.
- Enhesa NV/SA

Market Opportunities and Future Outlook
A near-term whitespace sits between rapid interest in AI-enabled EHS and the operational reality of fragmented data and hybrid paper-digital processes. Survey-based industry evidence highlighted this execution gap in 2026: EHSLeaders reported high AI usage among practitioners but low embedding across workflows. VelocityEHS benchmark findings (June 2026) also pointed to AI and automation as a major force shaping EHS priorities alongside measurable ROI claims. Vendors that package data quality controls, workflow-standardization, and integration accelerators for ERP, ServiceNow, maintenance, and emissions systems are better positioned to convert experimentation into production deployments.
Regulator-facing digital reporting requirements broaden the addressable workflow surface beyond classic incident and audit modules into environmental traceability and structured submissions. Examples include EPA submissions via CDX and the HAWK platform under the AIM Act, and England’s digital waste tracking mandate effective October 1, 2026, which create demand for connectors, validation, and audit trails aligned to government-operated systems. Company moves also show where vendors are investing: Intelex’s 2026 product launches emphasized AI-powered workflows and predictive risk visualization, while 3E launched an AI-focused platform suite in April 2026 for product compliance and chemical management. This supports opportunities in chemicals-heavy supply chains where SDS, substance lists, and exposure limits must remain continuously current.
Recent Industry Developments in Environmental Health And Safety (EHS) Software Market
- July 2026: Intelex announced its Q3 2026 product launch, adding capabilities such as proactive risk visualization and AI-powered workflows, including the COMET AI Assistant. The release reinforces the platform push toward predictive risk management and faster investigations in incident and safety management programs.
- June 2026: Cority announced its EHS solutions became available through Carahsoft on a U.S. GSA Schedule contract, expanding access for federal, state, and local government buyers. The procurement pathway supports standardized purchasing and can shorten sales cycles in public-sector compliance and sustainability programs.
- December 2025: Cority launched Cortex AI, a predictive-safety engine that recommends interventions using real-time sensor feeds and historical incident data. The launch reinforced vendor differentiation around proactive risk identification and tighter linkage between operational telemetry and compliance-grade records.


Environmental Health And Safety (EHS) Software Market Report Scope and Research Methodology
Market Definition and Coverage
This market covers revenue earned from software platforms used by organizations to record, track, analyze, and report environmental metrics, worker health incidents, safety events, and compliance requirements. We count license, subscription, and ongoing support fees tied to these EHS software deployments.
Scope exclusions: Excluded items include hardware sensors, personal protective equipment, stand-alone consulting work, and one-off custom coded tools built for a single client.
Segments Covered in This Report
- By Component
- Software
- Services
- By Deployment Mode
- Cloud
- On-premise
- By Solution Type
- Incident and Safety Management
- Audit and Inspection
- Compliance and Risk Management
- ESG / Carbon Management
- Training and Learning
- By Organization Size
- Large Enterprises
- Small and Mid-Sized Enterprises (SMEs)
- By End-user Industry
- Energy and Utilities
- Oil and Gas
- Chemicals and Petro-chemicals
- Healthcare and Life Sciences
- Construction and Manufacturing
- Mining and Metals
- Food and Beverages
- Other End-user Industries
- By Geography
- North America
- United States
- Canada
- Europe
- Germany
- France
- United Kingdom
- Russia
- Rest of Europe
- Asia Pacific
- China
- India
- Japan
- South Korea
- Rest of Asia Pacific
- South America
- Brazil
- Rest of South America
- Middle East
- Saudi Arabia
- United Arab Emirates
- Turkey
- Rest of Middle East
- Africa
- South Africa
- Nigeria
- Kenya
- Rest of Africa
- North America
Data Sources, Market Sizing, and Validation
Desk Research
Desk work starts by setting the demand and policy context, then collecting signals that can be checked across regions and industries. We use public sources such as the US Bureau of Labor Statistics (workplace injury and illness series), OSHA and the European Agency for Safety and Health at Work (regulatory and compliance themes), the US EPA (environmental reporting and compliance focus areas), and the International Labour Organization (labor and safety indicators). Where helpful, we also refer to Eurostat for enterprise and sector outputs, plus peer reviewed journals on EHS management digitization.
To link context to revenue, we triangulate with company filings, investor presentations, product documentation, reputable press coverage, and public association materials that describe adoption patterns and buying triggers. Select paid datasets are used only for company financials and intelligence, news and financials, and patent databases to support module mapping and vendor positioning without overfitting the model. The desk source list above is illustrative, and we used many other public references for cross-checking and clarification during the analysis.
Primary Interviews and Surveys
Primary work is used to pressure test desk assumptions and to fill gaps that public data does not explain well, such as how buyers bundle modules and how pricing changes with deployment type and user counts. We spoke with software providers, channel partners, and enterprise users across major regions to confirm and adjust assumptions on penetration, renewals, and services attachment before finalization.
Distribution of primary research fieldwork respondents
| Company type | Respondent position | Region |
|---|---|---|
| Top tier: 32% | CXOs: 13% | APAC: 45% |
| Mid tier: 48% | Functional/Unit leaders: 36% | EMEA: 37% |
| Smaller Players: 20% | Managers: 51% | Americas: 18% |
Market-Sizing & Forecasting
Sizing is built using a top-down demand pool reconstructed from enterprise digitization spend patterns and compliance intensity, then narrowed to EHS specific workflows that typically sit in dedicated platforms. We start from regional enterprise software spend and IT priorities, apply adoption and penetration assumptions by industry exposure, and then translate that demand into EHS software revenue using pricing and module mix checks from interviews.
To keep totals grounded, results are corroborated with selective bottom-up approximations, such as rolling up a sampled set of supplier revenues, checking channel feedback on average contract values, and validating subscription versus services splits where disclosures exist. Key inputs used in the model include cloud versus on-premise mix, renewal and churn expectations, services attachment rates, regulated industry share, and average seat or site coverage per customer (all treated as ranges and refined through field feedback). Forecasting relies mainly on scenario analysis, where the base case is guided by expert views on regulation enforcement, sustainability reporting needs, and the pace of cloud migration, and then translated into yearly growth rates consistent with observed adoption signals. When bottom-up inputs are missing for smaller countries or niche verticals, gaps are handled through ratio-based scaling from comparable markets, followed by a reasonableness check against local industry output and enterprise counts.
Data Validation & Update Cycle
Validation is done in layers so the final numbers do not depend on a single assumption. Model outputs are checked against independent signals such as enterprise software spending direction, regional safety incident trends, and publicly visible compliance and reporting requirements, then variances are investigated until the driver is clear.
Before sign-off, the work goes through multi-step analyst reviews, with focused rechecks on outliers such as sudden price jumps, unusual regional growth, or inconsistent services shares. Where the variance cannot be explained from desk inputs, we re-contact relevant interviewees to confirm what changed in buying patterns or deployment. Reports are refreshed annually, and interim updates are made when material events occur, followed by a fresh final review pass close to delivery so clients receive the latest updated view.
Mordor Intelligence's Environmental Health and Safety Software Market Sizing Compared With Other Published Estimates
Published market numbers for EHS software often do not match because the term can be stretched to cover different revenue buckets, different year cutoffs, and different treatments of services. Even when the same regions are covered, the total can shift based on whether the estimate follows software-only revenues or blends in adjacent safety and compliance activity.
Hardware sensors and PPE are kept outside the referenced Mordor Intelligence scope for this market, which is a key reason the 2025 value stays closer to pure software platforms monetized through license, subscription, and support fees. Another common gap comes from how services are counted, since some publishers pull in broader managed services and training revenues tied to EHS programs, which inflates totals beyond what software buyers recognize as platform spend.
Benchmark comparison
| Source | Market Size | Gaps in Research Methodology |
|---|---|---|
| Mordor Intelligence | USD 2.26 B (2025) | |
| Industry Analytics Desk A | USD 0.76 B (2024) | Uses a workplace safety segment lens with a different base year and narrower capture of enterprise EHS platform revenues, which can undercount multi-module suites and larger global contracts. |
| Global Research Desk B | USD 8.21 B (2025) | Bundles software with a wider set of EHS-related services and value-added activities, so the total moves beyond software license, subscription, and support revenue. |
The spread in the table is mostly explained by what each source counts as EHS software revenue, plus the base year and growth framing used. By keeping the model tied to software platform monetization and then cross-checking it with adoption and pricing signals from interviews, our estimate remains easier to trace back to clear inputs and repeatable steps.


Key Questions Answered in the Report
What is the projected value of the EHS software market in 2031?
It is expected to reach USD 3.92 billion, reflecting a 9.64% CAGR from 2026 to 2031.
Which deployment model is growing fastest?
Cloud deployments are expanding at a 12.84% CAGR because they eliminate on-premise hardware and enable rapid regulatory updates.
Why are ESG modules gaining traction?
New SEC and EU disclosure mandates require auditable emissions data, driving ESG and carbon tools to grow at an 11.68% CAGR.
How are AI capabilities influencing adoption?
Predictive-risk engines like Cority’s Cortex AI help lower incident rates and insurance premiums, strengthening ROI cases for buyers.
Which region is set to record the highest growth rate?
Asia Pacific is projected to grow at 10.48% CAGR thanks to stricter safety laws in China, India, and South Korea.
What factors limit adoption among SMEs?
High upfront implementation costs and limited change-management resources remain key hurdles despite falling software subscription prices.
Page last updated on:




