Market Overview
| Study Period | 2020 - 2031 |
|---|---|
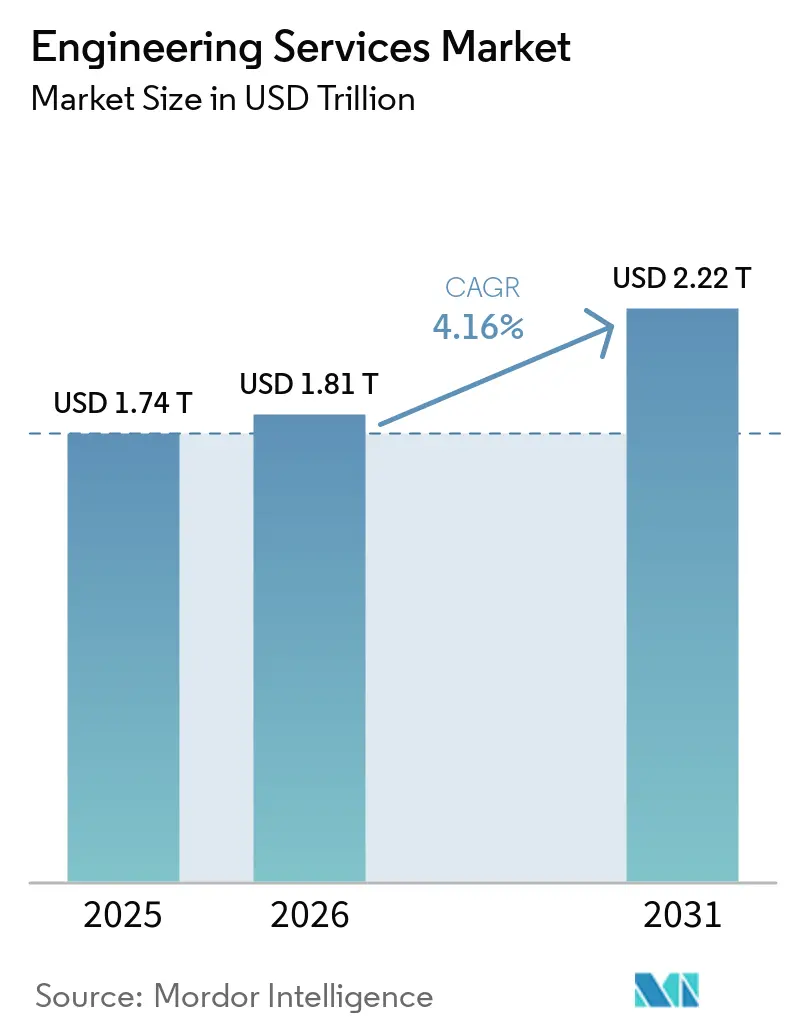
| Market Size (2026) | USD 1.81 Trillion |
| Market Size (2031) | USD 2.22 Trillion |
| Growth Rate (2026 - 2031) | 4.16% CAGR |
| Fastest Growing Market | Asia Pacific |
| Largest Market | Asia Pacific |
| Market Concentration | Low |
Major Players *Disclaimer: Major Players sorted in no particular order Image © Mordor Intelligence. Reuse requires attribution under CC BY 4.0. | |
Engineering Services Market Analysis by Mordor Intelligence
The engineering services market size in 2026 is estimated at USD 1.81 trillion, growing from 2025 value of USD 1.74 trillion with 2031 projections showing USD 2.22 trillion, growing at 4.16% CAGR over 2026-2031. Rising public-sector infrastructure programs, private capital pouring into energy-transition assets, and accelerating digital-twin adoption are the primary vectors supporting that expansion. Civil and electrical disciplines jointly underpin most contracts, while hybrid onsite, offshore delivery helps vendors balance project complexity with cost optimization. Mid-sized firms continue to gain share by specializing in hydrogen, carbon-capture, and small modular reactor (SMR) work, where government incentives strengthen demand visibility. Asia Pacific sustains the largest regional opportunity set, yet North America posts resilient growth as federal clean-energy funds flow into grid-modernization and defense programs.
Key Report Takeaways
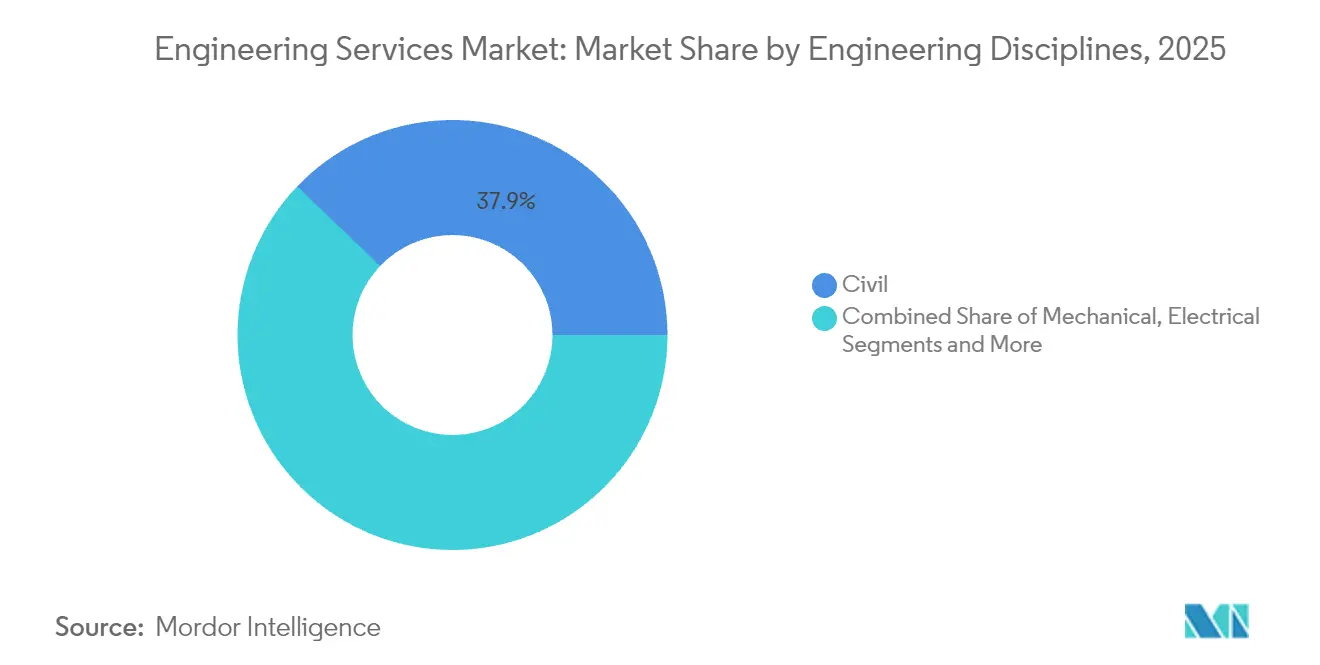
- By engineering discipline, civil captured 37.86% of the engineering services market share in 2025; electrical engineering is projected to expand at a 4.93% CAGR through 2031.
- By delivery model, onsite services held 66.83% of the engineering services market size in 2025; offshore services are forecast to grow at a 5.05% CAGR through 2031.
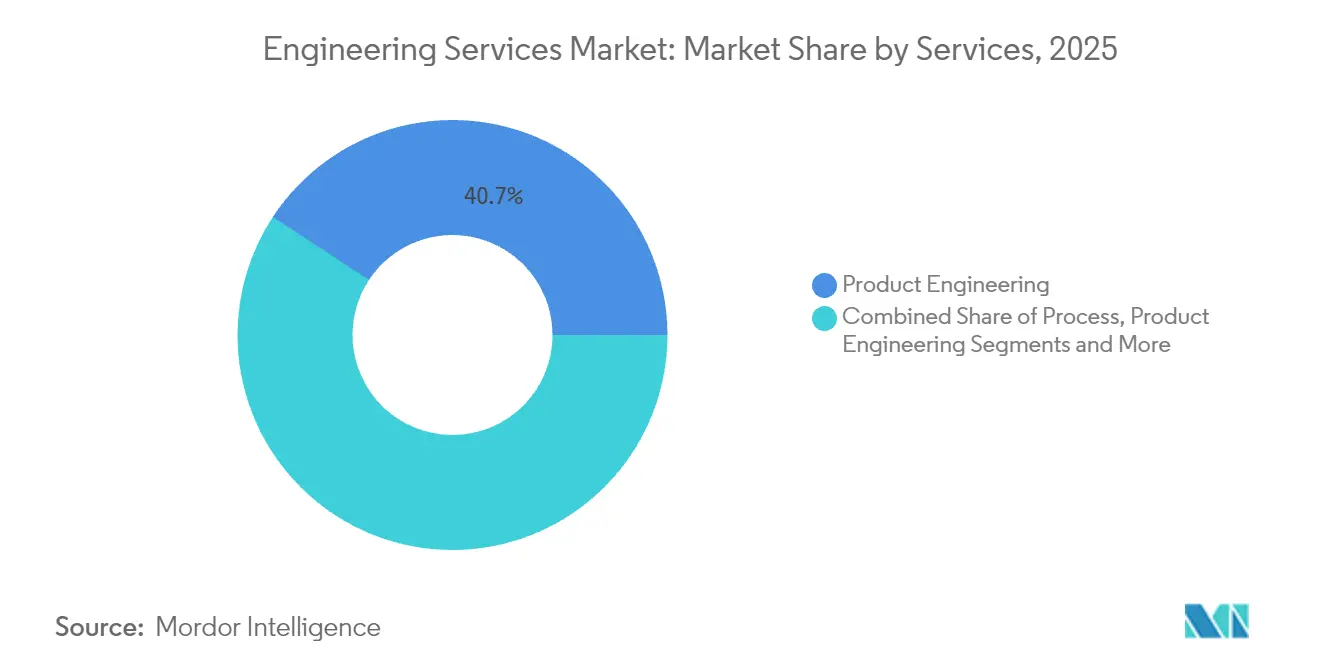
- By service category, product engineering accounted for 40.74% share of the engineering services market size in 2025; automation-related services post the highest 5.11% CAGR to 2031.
- By end-user industry, oil and gas maintained 16.22% share of the engineering services market size in 2025, while electric power generation advances at a 4.89% CAGR through 2031.
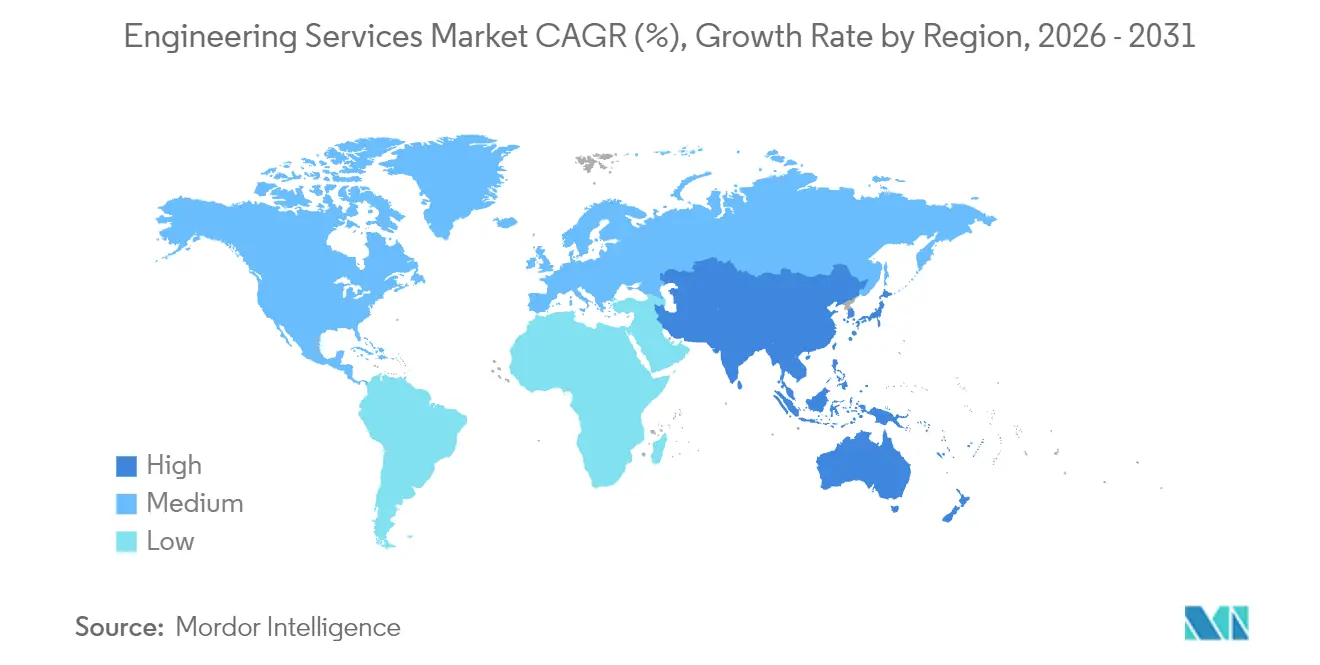
- By geography, Asia Pacific maintained 39.52% share of the engineering services market size in 2025, and is expected to advance at a 5.13% CAGR through 2031.
Note: Market size and forecast figures in this report are generated using Mordor Intelligence’s proprietary estimation framework, updated with the latest available data and insights as of 2026.
Global Engineering Services Market Trends and Insights
Drivers Impact Analysis*
| Driver | (~) % Impact on CAGR Forecast | Geographic Relevance | Impact Timeline |
|---|---|---|---|
| Industrial IoT and digital-twin rollout | +0.8% | Global (Asia-Pacific, North America lead) | Medium term (2-4 years) |
| Urbanization-driven civil infrastructure build | +0.7% | Asia-Pacific core; Middle East and Africa, Latin America follow | Long term (≥ 4 years) |
| Compressed product life-cycle, outsourced research and development | +0.6% | North America, Europe; spreading to Asia-Pacific | Short term (≤ 2 years) |
| Energy-transition mega-projects (hydrogen, CCUS) | +0.5% | OECD economies with net-zero laws | Long term (≥ 4 years) |
| Net-Zero Building Retrofit Mandates in OECD Economies | +0.4% | Primarily OECD economies | Medium term (2-4 years) |
| Defense Drone and Hypersonic Programs Needing Specialized Engineering | +0.3% | North America, Europe, Asia-Pacific | Medium term (2-4 years) |
| Source: Mordor Intelligence | |||


Evolution of Industrial IoT and Digital-Twin Adoption
Manufacturers are scaling digital twins to cut downtime and fine-tune asset utilization, triggering premium demand for multidisciplinary engineering support. Engagements commonly promise 15-25% cost reductions once predictive maintenance stabilizes operations.[1]U.S. Energy Information Administration, “Industrial Sector Energy Efficiency Trends,” U.S. Energy Information Administration, eia.gov Vendors that couple mechanical strength with analytics talent win higher bill rates, yet the scarcity of such hybrid skills keeps margins firm. As operational-technology networks connect to enterprise IT, cyber-hardening design has become a mandatory scope element, further widening project value and complexity. The trend is most visible in semiconductor fabs, battery-cell plants, and offshore production platforms, where tolerance for unplanned outages is minimal. Over the medium term, cross-domain expertise will define competitive advantage, giving specialist firms room to outpace generalists.
Rapid Urbanization Spurring Civil-Infrastructure Demand
Global cities require USD 9 trillion annually through 2025 to relieve congestion and climate stress. Asia’s 2.3% yearly urban-population increment forces record spending on mass-transit corridors, flood-control systems, and smart-utility grids. Engineering consultancies help municipalities structure bankable public-private partnership (PPP) deals, a capability that attracts institutional capital. In the United States, federal water infrastructure grants alone create a USD 6 billion annual engineering opportunity. Environmental-compliance mandates, particularly for wastewater and storm-resilience projects, lengthen scoping phases and raise demand for experienced civil firms. Long-term growth, therefore, remains anchored in the intersection of urban build-out needs and stricter sustainability codes.
Accelerated Product Life-Cycle Driving Outsourced Research and Development
Product refresh horizons in automotive, aerospace, and telecom sectors continue to shrink from multi-year to multi-quarter cadences. OEMs increasingly offload design and validation sprints to engineering service partners, locking in multi-year master-service agreements that buffer vendors’ revenue visibility. Defense exemplifies the phenomenon; hypersonic-weapon trials require specialized aerothermal modeling that only a small cadre of consultancies can deliver. These engagements command superior margin profiles and foster sticky client relationships. Because regulators often require third-party validation, outsourced research and development partners further cement their role across the product development chain. Short-cycle innovation will therefore keep the engineering services market on a steady upward trajectory.
Energy-Transition Mega-Projects Requiring EPCM Expertise
Hydrogen hubs, CCUS arrays, and SMRs are moving from concept to execution backed by legislation such as the U.S. Inflation Reduction Act, which allocates USD 369 billion to clean-energy infrastructure. This trend is creating significant opportunities in the US Power EPC market, as project owners favor firms with turnkey engineering, procurement, and construction management (EPCM) credentials capable of navigating novel tech-risk profiles and tough permitting. Premium valuations reward consultancies that demonstrate credible decarbonization portfolios, prompting an acquisition wave as incumbents buy niche specialists. OECD economies dominate early deployments, but emerging markets are lining up feasibility studies to claim climate-finance incentives. Over the long term, proprietary know-how in hydrogen compression, cryogenic storage, and modular-reactor siting will crystallize into durable competitive moats.
Restraints Impact Analysis*
| Restraint | (~) % Impact on CAGR Forecast | Geographic Relevance | Impact Timeline |
|---|---|---|---|
| Political instability and acute skilled-labor shortage | −0.4% | Global; acute in Asia-Pacific, Middle East and Africa | Short term (≤ 2 years) |
| Input Cost and Supply-Chain Volatility | −0.4% | Global; acute in Asia-Pacific, Middle East and Africa | Short term (≤ 2 years) |
| IP-security hurdles limiting defense outsourcing | −0.3% | North America, EU; allied spillover | Medium term (2-4 years) |
| Slow Permitting for Utility-Scale Renewables | −0.2% | North America, EU, Asia-Pacific | Medium term (2-4 years) |
| Source: Mordor Intelligence | |||
Political Instability and Acute Skilled-Labor Shortage
Cross-border project risk premiums widen in politically volatile regions, inflating insurance costs and elongating approval cycles. Concurrently, retirements reduce the available experienced-engineer pool just as demand peaks. Firms report up to 40% vacancy rates for critical cyber-physical roles, forcing salary premiums of 25-35%.[2]Tetra Tech Investor Relations, “Tetra Tech Reports Record Fiscal 2024 and Fourth-Quarter Results,” Tetra Tech, tetratech.com Over-reliance on subcontractors erodes margin and invites quality scrutiny, while visa and certification bottlenecks limit rapid redeployment of personnel. Companies now invest in internal academies and international rotation programs to stabilize workforce pipelines, but near-term capacity constraints remain a drag on market velocity.
IP-Security Concerns Limiting Defense Outsourcing
Export-control laws and heightened scrutiny by bodies such as the Committee on Foreign Investment in the United States (CFIUS) raise compliance costs on engineering firms. Secure sites, cleared staff, and segregated IT networks can consume 5-10% of project budgets, disqualifying cash-strapped challengers. Prime contractors, therefore, consolidate work among a small cadre of security-vetted partners, throttling overall outsourcing volume growth. Mid-tier consultancies face a make-or-break decision: invest heavily in secure infrastructure or pivot to commercial segments. Over the medium term, security mandates are expected to temper expansion in the defense sub-segment while reinforcing incumbent dominance.
*Our forecasts treat driver/restraint impacts as directional, not additive. The impact forecasts reflect baseline growth, mix effects, and variable interactions.
Segment Analysis
By Engineering Disciplines: Electrical Surges on Grid Modernization
Civil engineering retained 37.86% of 2025 revenue as governments continued to prioritize transportation corridors and resilient water systems. Electrical work, however, is forecast to grow at a 4.93% CAGR, the fastest among disciplines, propelled by USD 369 billion in U.S. clean-energy incentives and parallel EU Green Deal funding. Mechanical services gain traction through factory automation and robotics retrofits, while structural and piping segments trace the broader construction cycle. Electrical practitioners increasingly bundle software coding, cybersecurity, and IEC-61850 grid-protocol expertise with traditional design scopes, a convergence that maintains high average selling prices. As distributed energy resources proliferate, utilities award multi-year frameworks covering substation digitalization and storage-integration studies. These developments keep the engineering services market on an electrification-tilted growth arc.
The blurring of disciplinary boundaries also reshapes talent strategies; firms now recruit data scientists alongside PE-licensed engineers to satisfy digital-twin deliverables. Certification regimes such as IEEE and ISO-55000 factor heavily into bid evaluations, elevating firms with proven compliance track records. Consequently, premium billing rates remain sticky even in price-sensitive emerging markets. By 2031, electrical contracts are expected to approach civil’s revenue scale, tightening competition and prompting niche specialization, such as vehicle-to-grid systems and high-voltage direct-current interconnects, to preserve differentiation.


By Delivery Model: Offshore Momentum Within Hybrid Engagements
On-site work held a 66.83% share in 2025 due to the need for face-to-face coordination on regulated projects, yet offshore execution is expanding at a 5.05% CAGR. Cloud-native CAD/CAM platforms enable 24-hour design cycles by handing deliverables to centers in India, the Philippines, and Eastern Europe. Cost arbitrage of 40-60% versus local teams remains compelling for routine drafting, freeing onsite staff for stakeholder management and field supervision. The engineering services market increasingly coalesces around hybrid statements of work that specify deliverables, not headcount, thereby defusing earlier client concerns about remote quality control.
Vendor selection now pivots on cybersecurity posture and data-segmentation capabilities rather than solely on hourly rates. ISO-27001 and SOC-2 attestations have become table stakes. For government-sensitive scopes, clients sometimes carve out clean-room offshore pods staffed exclusively by citizens of allied nations to comply with export-control regulations. With automation in documentation and model-checking advancing, firms expect incremental margin lift from productivity gains, even as daily rates for senior architects remain flat. The trend confirms offshore’s evolution from tactical cost lever to strategic resource multiplier.
By Services: Automation Outpaces Traditional Product Engineering
Product engineering remained the largest service bucket with 40.74% of 2025 revenue, reflecting compressed design cycles in tech-heavy manufacturing. Automation-related engagements, however, lead growth at a 5.11% CAGR as clients deploy predictive-maintenance and computer-vision controls into existing plants. This sub-segment integrates sensor selection, control-loop tuning, and AI-driven analytics, a bundle that commands premium fees. The engineering services market benefits as vendors migrate billing structures from time-and-material toward performance-based compensation tied to uptime, energy savings, or scrap reduction.
Process engineering, closely linked to chemical and life-science capex, records steady mid single-digit growth aided by ESG-driven retrofits that reduce emissions and water intensity. Asset-management support, including digital-twin lifecycle models for aging infrastructure, supplements revenue with recurring data-service layers. As vendors package OT-cybersecurity, data analytics, and domain engineering into single statements of work, client reliance deepens, elevating switching costs. By 2031, automation is expected to close the gap with product-engineering revenue, emphasizing the sector’s pivot toward data-enriched value propositions.
By End-User Industry: Power Generation Accelerates Past Hydrocarbons
Oil and gas still contributed 16.22% of 2025 revenue as legacy fields required upkeep, yet electric-power projects now post the fastest 4.89% CAGR on the back of renewable-portfolio standards. Grid interconnection studies, battery-storage siting, and SMR feasibility drive new contract volume. Data-center electricity demand, projected to grow significantly, further stretches grid capacity and underpins substation and transmission-line design mandates. Mining automation, aerospace hypersonics, and telecom 5G densification each add niche demand swells that favor specialized firms.
The engineering services market also sees rising nuclear-new-build momentum, with Canada’s Darlington SMR project and Romania’s Doicesti FEED phase signaling global appetite for modular reactors. Defense budgets channel funds into space-launch facilities and advanced-propulsion test stands, adding high-margin geotechnical and structural scopes. Pharmaceuticals sustain steady research and development-lab expansions, requiring cGMP-compliant HVAC and clean-utility design expertise. Diversified exposure across end-users therefore mitigates volatility tied to any single sector.
Geography Analysis
Asia Pacific retained 39.52% of 2025 revenue, anchored by USD 1.7 trillion in annual infrastructure spending. China’s Belt and Road initiatives and India’s mass rapid-transit build-outs secure a robust civil-work backlog, while Asia-Pacific manufacturing-reshoring funnels orders into factory-automation and utility-grid upgrades. Regional governments allocate climate-adaptation grants toward coastal-protection engineering, propelling coastal-civil sub-disciplines. As a result, the engineering services market registers its fastest 5.13% regional CAGR here, sustained by sovereign wealth deployment into mega-projects.
North America holds the second-largest share, buoyed by USD 369 billion in U.S. clean-energy incentives and USD 1.2 trillion for broader infrastructure modernization. Defense spending and SMR pilots further sharpen demand for high-clearance engineering talent. Canada’s LNG and nuclear programs, along with Mexico’s near-shoring-induced factory builds, enlarge the continental project funnel. Vendor opportunities span grid-interconnect studies, hydrogen-hub FEED contracts, and critical-mineral processing plants.
Europe pivots on net-zero retrofits and offshore-wind expansion financed by the EU Green Deal.Germany’s EUR 500 billion (USD 550 billion) infrastructure fund and the U.K.’s Sizewell C nuclear project typify large pipeline items. Strict taxonomy rules steer capital toward certified sustainable projects, rewarding firms adept at ESG reporting. Meanwhile, the Middle East and Africa focus on energy diversification, such as green-ammonia export hubs in the Gulf and utility-scale solar in North Africa. Political stability issues and labor shortages, however, temper growth velocity in selected Middle East and Africa markets.

Competitive Landscape
The engineering services market remains moderately fragmented. Acquisition remains the fastest route to scale and capability depth: WSP Global’s USD 1.78 billion purchase of Power Engineers widens its energy-transition bench and extends reach across U.S. transmission-grid programs. Similar consolidation waves see AtkinsRealis buying David Evans Enterprises to bolster U.S. West Coast infrastructure presence.[5]AtkinsRealis Communications, “AtkinsRealis Completes Agreement to Acquire David Evans Enterprises,” AtkinsRealis, atkinsrelais.com
Digital innovation acts as a second competitive axis. Market leaders embed cloud-based BIM, AI-assisted clash detection, and blockchain-verified materials traceability into project workflows, reducing rework and strengthening value propositions. Smaller disruptors differentiate by offering turnkey digital-twin platforms at subscription pricing, pressuring incumbents to bundle managed-service layers atop traditional design scopes. Regulatory expertise, especially in nuclear licensing and export-controlled defense domains, creates high entry barriers that shield incumbents from pure-play IT firms attempting to cross over.
Finally, partnerships with technology vendors expand solution breadth. Bechtel’s alliance with GE-Hitachi and Sargent and Lundy on TVA’s Clinch River SMR project illustrates the integrated-delivery model clients now favor. Successful players exhibit financial muscle, cross-disciplinary teams, and digital-delivery maturity, positioning them to capture above-market growth in the decade ahead.
Engineering Services Industry Leaders
AECOM Engineering company
Bechtel Corporation
Kiewit Corporation
WSP Global Inc
STRABAG SE
- *Disclaimer: Major Players sorted in no particular order

Recent Industry Developments
- August 2025: Inpex awarded early engineering. contracts for its Indonesian LNG project, signaling continued Southeast-Asian LNG build-out despite energy-transition narratives. The move secures front-end optionality ahead of an expected 2026 final-investment decision.
- August 2025: Commonwealth LNG selected Technip Energies as owner’s engineer for its U.S. Gulf Coast plant, leveraging Technip’s LNG process pedigree to accelerate permitting and modularization studies.
- August 2025: A Fluor–JGC joint venture landed the FEED scope for a Canadian LNG expansion, underlining EPCs’ preference to form risk-sharing alliances on capital-intensive export terminals
- May 2025: The Aecon-Kiewit-led consortium won a USD 934 million build contract for Ontario’s Darlington SMR, spotlighting Canada’s commitment to low-carbon baseload generation and providing a marquee reference for SMR engineering
- February 2025: AtkinsRealis acquired 70% of David Evans Enterprises for USD 300 million, expanding U.S. transportation-design capacity as state DOT budgets swell under federal infrastructure grants


Global Engineering Services Market Report Scope
Engineering services are defined as any service that requires applying specific knowledge from the physical, mathematical, and engineering disciplines to services or works, including investigation, consultation, or evaluation. Mechanical, electrical, civil, piping, and structural engineering fields comprise engineering services.
The engineering services market is segmented by engineering disciplines (civil, mechanical, electrical, piping & structural), delivery mode (offshore, onsite), services (product engineering, process engineering, automation-related services, asset management-related services), industries (aerospace and defense, automotive, chemical and petrochemical, electric power generation, municipal utility projects, mining, oil and gas, pharmaceuticals, transportation, telecommunications, nuclear projects), by geography (North America (United States, Canada), Europe (Germany, United Kingdom, France, Spain, and Rest of Europe), Asia-Pacific (China, Japan, India, Rest of Asia-Pacific), Latin America (Brazil, Argentina, Rest of Latin America), Middle East and Africa (United Arab Emirates, Saudi Arabia, South Africa, and Rest of Middle East and Africa). The market sizes and forecasts are provided in terms of value in USD for all the segments.
By Engineering Disciplines
| Civil |
| Mechanical |
| Electrical |
| Piping and Structural |
By Delivery Model
| Offshore |
| Onsite |
By Services
| Product Engineering |
| Process Engineering |
| Automation Related Services |
| Asset Management Related Services |
By End-user Industry
| Aerospace and Defense |
| Automotive |
| Chemical and Petrochemical |
| Electric Power Generation |
| Municipal Utility Projects |
| Mining |
| Oil and Gas |
| Pharmaceuticals |
| Transportation |
| Telecommunications |
| Nuclear Projects |
| Other End-user Industries |
By Geography
| North America | United States | |
| Canada | ||
| Mexico | ||
| South America | Brazil | |
| Argentina | ||
| Rest of South America | ||
| Europe | Germany | |
| United Kingdom | ||
| France | ||
| Italy | ||
| Spain | ||
| Rest of Europe | ||
| Asia-Pacific | China | |
| Japan | ||
| India | ||
| Singapore | ||
| Australia | ||
| Malaysia | ||
| Rest of Asia-Pacific | ||
| Middle East and Africa | Middle East | Saudi Arabia |
| United Arab Emirates | ||
| Rest of Middle East | ||
| Africa | South Africa | |
| Egypt | ||
| Rest of Africa | ||
| By Engineering Disciplines | Civil | ||
| Mechanical | |||
| Electrical | |||
| Piping and Structural | |||
| By Delivery Model | Offshore | ||
| Onsite | |||
| By Services | Product Engineering | ||
| Process Engineering | |||
| Automation Related Services | |||
| Asset Management Related Services | |||
| By End-user Industry | Aerospace and Defense | ||
| Automotive | |||
| Chemical and Petrochemical | |||
| Electric Power Generation | |||
| Municipal Utility Projects | |||
| Mining | |||
| Oil and Gas | |||
| Pharmaceuticals | |||
| Transportation | |||
| Telecommunications | |||
| Nuclear Projects | |||
| Other End-user Industries | |||
| By Geography | North America | United States | |
| Canada | |||
| Mexico | |||
| South America | Brazil | ||
| Argentina | |||
| Rest of South America | |||
| Europe | Germany | ||
| United Kingdom | |||
| France | |||
| Italy | |||
| Spain | |||
| Rest of Europe | |||
| Asia-Pacific | China | ||
| Japan | |||
| India | |||
| Singapore | |||
| Australia | |||
| Malaysia | |||
| Rest of Asia-Pacific | |||
| Middle East and Africa | Middle East | Saudi Arabia | |
| United Arab Emirates | |||
| Rest of Middle East | |||
| Africa | South Africa | ||
| Egypt | |||
| Rest of Africa | |||


Key Questions Answered in the Report
How large is the engineering services market in 2026?
The engineering services market size is USD 1.81 trillion in 2026 and is on track for a 4.16% CAGR, implying roughly USD 2.22 trillion for 2031 based on the current growth curve.
Which engineering discipline is growing the fastest?
Electrical engineering leads growth at a projected 4.93% CAGR through 2031, fueled by grid modernization and renewable-integration projects.
Why are hybrid onsite-offshore delivery models gaining traction?
Clients seek cost efficiency without sacrificing complex stakeholder management, prompting vendors to split design tasks offshore while retaining local project leadership for regulatory and quality oversight.
What end-user vertical offers the strongest outlook?
Electric power generation shows the fastest growth at 4.89% CAGR as utilities invest in renewable capacity, storage, and grid upgrades.
How are energy-transition projects shaping service demand?
Hydrogen hubs, CCUS installations, and SMRs demand EPCM expertise, creating high-margin opportunities for firms with specialty talent and regulatory know-how.
What is the market's competitive intensity?
Fragmentation is high. The companies are following merger and acquisition aims to secure niche capabilities and regional presence.
Page last updated on:


