Market Overview
| Study Period | 2021 - 2031 |
|---|---|
| Forecast Data Period | 2026 - 2031 |
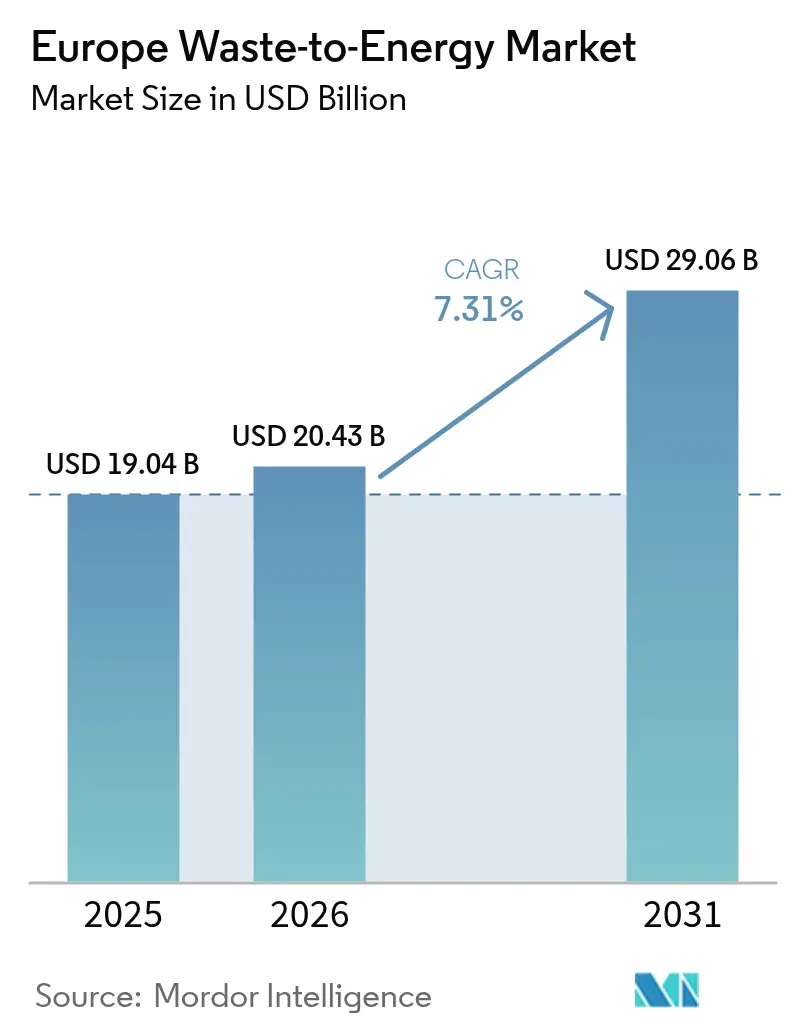
| Base Year Market Size (2025) | USD 19.04 Billion |
| Market Size (2026) | USD 20.43 Billion |
| Market Size (2031) | USD 29.06 Billion |
| Growth Rate (2026 - 2031) | 7.31% CAGR |
| Market Concentration | Medium |
Major Players *Disclaimer: Major Players sorted in no particular order Image © Mordor Intelligence. Reuse requires attribution under CC BY 4.0. | |
Europe Waste-to-Energy Market Analysis by Mordor Intelligence
The Europe Waste-to-Energy Market size was valued at USD 19.04 billion in 2025 and estimated to grow from USD 20.43 billion in 2026 to reach USD 29.06 billion by 2031, at a CAGR of 7.31% during the forecast period (2026-2031).
Policy alignment across EU waste and climate directives, shrinking coal capacity, and rising landfill gate fees lift facility utilization rates. Carbon-linked incentives such as the EU Carbon Border Adjustment Mechanism (CBAM) create new revenue streams while district-heating build-outs in Nordic and Central-Eastern Europe improve project bankability. Large-scale plants above 750 tpd gain momentum because scale lowers capture-ready retrofit costs and eases EU Innovation Fund capital access. Public sensitivity toward urban emissions and wholesale power-price softness temper growth have not derailed newbuild pipelines in Germany, Italy, Poland, the Nordics, and the United Kingdom. As a result, the European waste-to-energy market is consolidating its role as a firm capacity provider that drives landfill diversion.
Key Report Takeaways
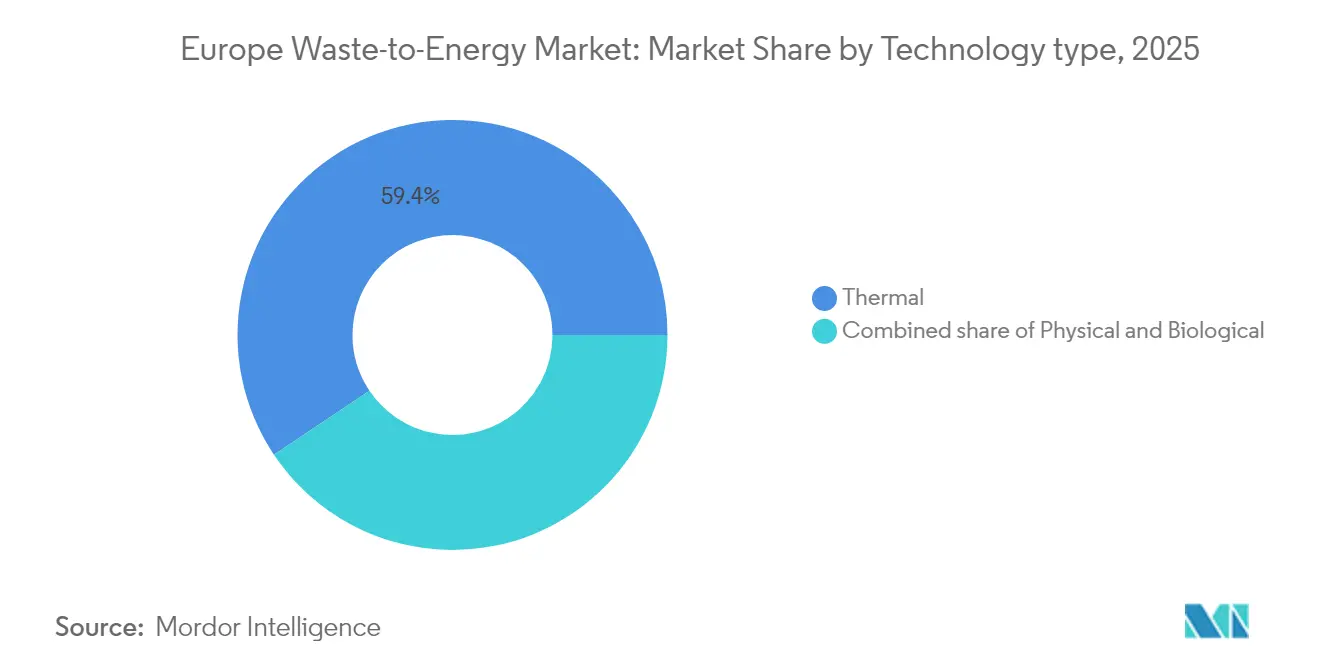
- By technology, Thermal processes led with a 59.40% revenue share in 2025, while Biological processes are projected to expand at a 11.96% CAGR to 2031.
- By waste type, Municipal solid waste held 61.30% of the European waste-to-energy market share in 2025, whereas agricultural and agro-industrial residues are advancing at an 11.12% CAGR through 2031.
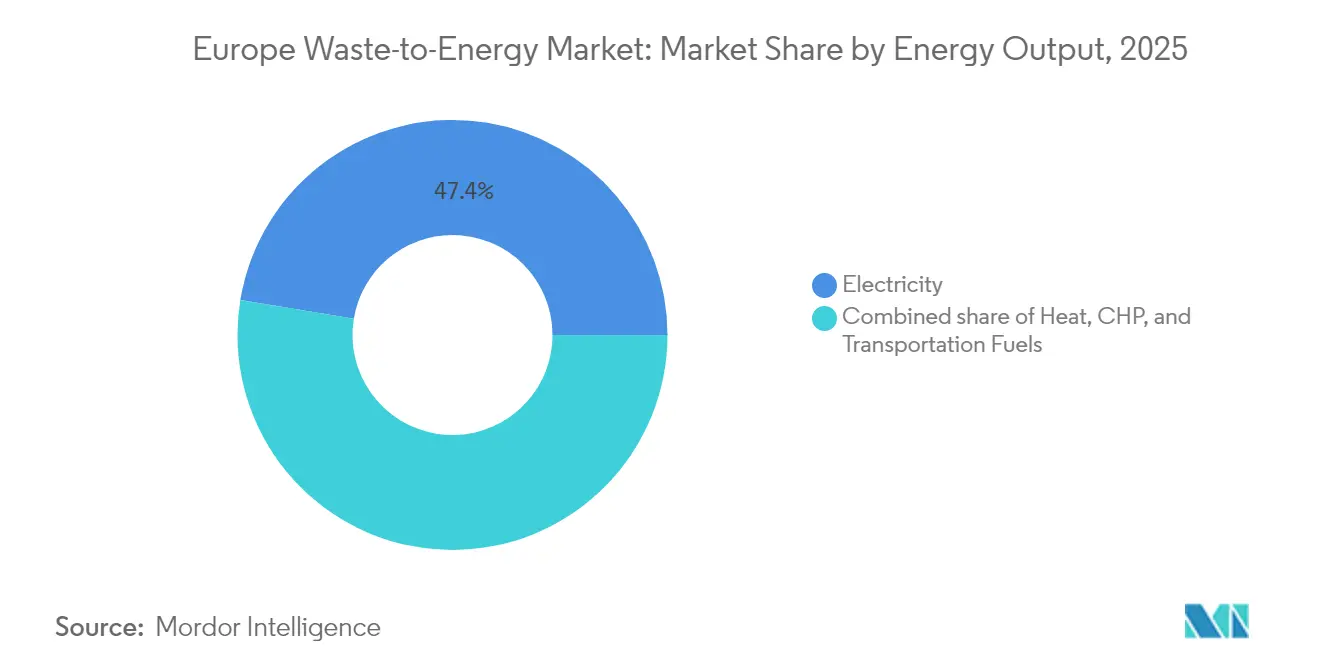
- By energy output, Electricity generation commanded 47.40% of the European waste-to-energy market size in 2025, while combined heat and power (CHP) is set to grow at a 9.78% CAGR between 2026 and 2031.
- By end-user, utilities and independent power producers (IPPs) captured a 56.30% share of the European waste-to-energy market size in 2025, whereas district heating operators posted the fastest 13.02% CAGR to 2031.
- By country, Germany accounted for 22.70% of the European waste-to-energy market in 2025; Spain recorded the highest 12.18% CAGR over the forecast period.
Note: Market size and forecast figures in this report are generated using Mordor Intelligence’s proprietary estimation framework, updated with the latest available data and insights as of 2026.
Europe Waste-to-Energy Market Trends and Insights
Drivers Impact Analysis*
| Driver | (~) % Impact on CAGR Forecast | Geographic Relevance | Impact Timeline |
|---|---|---|---|
| EU Waste Framework Directive 2018/851 | +1.20% | EU-wide, strongest in Eastern Europe | Medium term (2-4 years) |
| EU Carbon Border Adjustment Mechanism (CBAM) | +0.80% | EU borders with non-EU countries | Short term (≤ 2 years) |
| German coal phase-out | +0.90% | Germany, spillover to Central Europe | Short term (≤ 2 years) |
| Nordic & CEE district-heating expansion | +0.70% | Nordic countries, Central & Eastern Europe | Long term (≥ 4 years) |
| Rising Gate Fees for Landfill Operations in the UK & France Enhancing WtE Economics | +0.6% | UK & France, gradual EU adoption | Medium term (2-4 years) |
| EU Innovation-Fund Grants for Carbon-Capture-Ready WtE Facilities | +0.5% | EU-wide, concentrated in industrial regions | Long term (≥ 4 years) |
| Source: Mordor Intelligence | |||


EU Waste Framework Directive 2018/851 Targets Driving Diversion from Landfill
The Directive caps municipal landfills at 10% by 2035, pushing member states to add thermal capacity for residual waste streams. Landfilled volumes fell 27.5% between 2010-2020, yet 14 nations risk infringement, accelerating procurement for new incineration and anaerobic digestion plants (1)Source: European Environment Agency, “Municipal Waste Management Across European Countries,” eea.europa.eu. Poland and Romania prioritize EU cohesion funds to finance turnkey facilities, compressing approval windows to meet the deadline. Because energy recovery sits above disposal in the hierarchy, municipalities justify higher gate fees that improve project returns. Eastern European authorities see waste-to-energy as a twin answer to landfill diversion and winter-peak electricity deficits, underpinning demand across the European waste-to-energy market.
Upcoming EU Carbon Border Adjustment Mechanism Boosting Demand for Waste-Derived Energy Credits
CBAM’s full launch in 2026 monetizes avoided emissions when waste-to-energy electricity displaces fossil generation.(2)Source: European Commission, “Carbon Border Adjustment Mechanism Regulation,” publications.europa.eu Facilities demonstrating lower carbon intensity earn premium certificates that industrial buyers must surrender, effectively subsidizing plant revenues. With EU ETS prices trending above EUR 80/tCO₂, certificates enhance internal rates of return for new builds. Developers have started embedding advanced flue-gas treatment to verify carbon factors. The mechanism indirectly shields domestic operators because importers of carbon-heavy electricity face equivalent levies, further strengthening the European waste-to-energy market.
Rapid Decommissioning of Coal Power Plants in Germany Creating Baseload Demand
Germany closed 4.4 GW of coal capacity in 2024 and targets full coal exit by 2038.(3)Source: Julian Wettengel, “Germany Shuts 4.4 GW of Coal Capacity in 2024,” cleanenergywire.orgRenewables alone cannot bridge shoulder-hour gaps, making dispatchable waste-to-energy plants attractive. Grid operators in North Rhine-Westphalia already contract 24/7 output from CHP incinerators to stabilize winter demand. Federal tenders that compensate retired coal assets redirect capital toward baseload alternatives, including carbon-capture-ready waste-to-energy units. This dynamic ripples into neighboring Central European systems, lifting cross-border electricity flows from German facilities and strengthening the European waste-to-energy market.
District-Heating Expansion in Nordics & CEE Favouring CHP Plants
Denmark aims for 95% renewable district heat by 2030, and Sweden is scaling fourth-generation low-temperature networks, enabling waste-heat utilization efficiencies above 85%. EU cohesion funds replicate this model in Poland, the Czech Republic, and the Baltic states. Lower distribution temperatures reduce losses, letting plants transmit heat further and hence widen catchment areas. Municipalities secure dual revenue—power and heat—bolstering debt service capacity. Long-term heat-offtake contracts mitigate wholesale power risk, supporting the European waste-to-energy market across northern and central regions.
Restraints Impact Analysis*
| Restraint | (~) % Impact on CAGR Forecast | Geographic Relevance | Impact Timeline |
|---|---|---|---|
| Public opposition & litigation | -0.40% | Urban centers, particularly Amsterdam, Madrid | Short term (≤ 2 years) |
| Declining wholesale power prices | -0.60% | EU-wide, strongest in high renewable penetration areas | Medium term (2-4 years) |
| Permitting Delays Under the EU Industrial Emissions Directive Increasing Project Lead-Times | -0.3% | EU-wide, concentrated in densely populated regions | Medium term (2-4 years) |
| Competition from Advanced Chemical Recycling Stealing Plastic Feedstock Streams | -0.5% | Western Europe, industrial clusters | Long term (≥ 4 years) |
| Source: Mordor Intelligence | |||
Escalating Public Opposition and Litigation in Urban Hubs
Environmental groups leverage the 2024 European Court of Human Rights ruling on climate action to contest permits, lengthening approval processes. Amsterdam halted a planned plant after resident petitions, while Madrid faces similar pushback. Legal uncertainties raise lender risk premiums and oblige developers to prove exhaustive recycling efforts before incineration. Although public-sector owners such as Copenhagen record higher social acceptance, private concessions increasingly include citizen oversight boards. These dynamics slow project roll-outs in dense cities and curb near-term capacity additions within the European waste-to-energy market.
Declining Wholesale Power Prices from Wind & Solar Surge
The merit-order effect of cheap renewables persists, as 81% of 2023 additions produced electricity below fossil-fuel benchmarks. Waste-to-energy facilities without heat recovery see margin compression when day-ahead prices collapse during high solar generation. United Kingdom authorities estimate ETS extension to incineration could add GBP 1.1 billion in compliance costs by 2036. Operators pivot toward contractual heat sales, grid-service remuneration, and gate-fee optimization to safeguard cash flows. The revenue squeeze remains a chief restraint on new merchant projects in the European waste-to-energy market.
*Our forecasts treat driver/restraint impacts as directional, not additive. The impact forecasts reflect baseline growth, mix effects, and variable interactions.
Segment Analysis
By Technology: Thermal Leadership and Rising Biological Momentum
Thermal routes generated 59.40% of segment revenue in 2025, driven by established grate combustion fleets spread across 19 EU members. Gasification and pyrolysis pilots now secure EU Innovation Fund support, indicating policy preference for capture-ready designs. The biological cluster grows at a 11.96% CAGR as anaerobic digestion aligns with the REPowerEU biomethane goal of 35 bcm by 2030. Integrated sites that marry front-end sorting with digestion for organics and combustion for refuse-derived fuel cut residual landfill volumes, boosting circularity metrics. The Europe waste-to-energy market size linked to biological solutions is projected to climb from USD 6.05 billion in 2026 to USD 10.66 billion in 2031, underscoring investor appetite for low-carbon gases.
Thermal suppliers such as Hitachi Zosen Inova, Martin GmbH, and Babcock & Wilcox respond by modularising grate lines and embedding oxy-fuel capture ports. Project sponsors now design flue-gas treatment to exceed Industrial Emissions Directive ceilings, shortening later capture integration lead times. Biological technology providers focus on containerized digesters suitable for small municipalities, broadening addressable volumes. Digital controls that adjust air flow, slag handling, and digester retention times raise availability by close to 92%, enhancing revenue resilience across the European waste-to-energy market.


By Waste Type: Municipal Core Faces Agricultural Upswing
Municipal solid waste (MSW) represented 61.30% throughput in 2025, thanks to mature collection logistics and minimum disposal mandates. However, agricultural and agro-industrial residues grow 11.12% annually as farmers monetise manure and crop residues to meet the nitrates directives. The European waste-to-energy market size attributable to agricultural feedstock could reach USD 7.44 billion by 2031, supported by gas-grid injection premiums in Italy and Denmark.
Meat-processing offal and cheese whey supply high-yield biogas streams that cut payback to under 12 months, attracting co-operative-owned digesters. Sewage sludge volumes climb with urban population growth and tighter wastewater rules, prompting water utilities to install sludge incinerators for energy self-sufficiency. Commercial and industrial recyclables such as packaging and textiles offer higher calorific value but demand pre-sort robotics to remove PVC and metals. Blended-feed strategies even out calorific swings and secure year-round supply chains, enhancing plant utilization across the European waste-to-energy market.
By Energy Output: Electricity Dominant, CHP Ascendant
Electricity sales supplied 47.40% of segment value in 2025 as legacy plants were built for grid injection. Yet CHP output logs a 9.78% CAGR because fourth-generation district-heating networks optimize low-temperature distribution. In Copenhagen, waste-to-energy covers 20% of winter heat, proving scalability. CHP raises system efficiency above 85%, cutting specific emissions and earning contracts for difference under national heat laws.
Data-centre clusters in Frankfurt, Dublin, and Stockholm increasingly tap waste-generated steam for heat-reuse loops, anchoring long-term offtake. Electricity-only facilities retrofit steam-extraction modules to capture lost heat and hedge against power-price volatility. Absorption chillers powered by waste heat unlock district cooling markets in Southern Europe, extending seasonality benefits. These trends embed flexible revenue profiles, strengthening bankability across the European waste-to-energy market.
By Plant Capacity: Scale Economies and Modular Innovation
In 2025, Utilities and Independent Power Producers (IPPs) played the leading role in Europe’s waste-to-energy landscape, making up around 56.30% of the market. Their dominance is no surprise—these large operators have the resources, infrastructure, and grid access needed to run waste-to-energy plants at scale. They’ve been at the forefront of turning non-recyclable waste into power, supporting energy security and waste reduction goals across the region.
However, the next wave of growth is expected to come from a different market corner. District Heating Operators are emerging as a fast-growing force, with a projected CAGR of 13.02% between 2026 and 2031. Their momentum is driven by Europe’s push for cleaner cities and smarter energy use. In countries like Sweden, Denmark, and Germany, WTE plants are increasingly linked to urban heating networks, helping heat homes, businesses, and public buildings using energy recovered from waste. This shift reflects a broader move toward local, low-carbon heating solutions, especially as policymakers continue to promote energy efficiency and circular economy models. District heating operators are tapping into this trend, investing in technologies that maximize waste heat while cutting emissions.
Geography Analysis
Germany anchors regional revenue with a 22.70% share, leveraging mature policy, reliable waste flows, and grid-support payments that stabilise project cash flow. Federal innovation tenders channel EUR 4.2 billion into capture-ready retrofits, keeping German plants technologically current. Italian momentum is evident as A2A earmarks EUR 22 billion for ecological transition by 2035, with 70% of that pipeline initiated before 2030, ensuring a steady flow of EPC contracts and feedstock offtake agreements.
Nordic nations deliver best-in-class thermal efficiency. Denmark targets 95% renewable district heat by 2030, with waste-to-energy providing indispensable shoulder-season supply. Sweden pilots low-temperature loops in Helsingborg to reuse flue-gas condensate, a template for Central-Eastern Europe where cohesion funds co-finance network upgrades. France and the UK move in opposite directions: France benefits from rising landfill levies that underpin long-term plant economics, whereas the UK faces uncertainty from ETS extension to incineration from 2028, which could add GBP 1.1 billion in compliance outlays.
Eastern Europe emerges as an investment frontier. Poland operates 400 biogas units and will deploy EUR 322 million of EU grants toward renewables by 2030, while Czechia’s Prague facility will process 320,000 tpa of MSW and feed city-wide heating. Turkey’s Istanbul plant handles 1.1 million tpa, proving the scalability of PPP models in fast-growing urban zones. Divergent regulatory regimes and feedstock compositions, therefore, create a mosaic of risks and returns yet collectively underpin the long-run growth of the European waste-to-energy market.
Competitive Landscape
The landscape is moderately concentrated. Veolia, SUEZ, A2A, EEW, and Viridor anchor municipal concession portfolios, but technology specialists such as Hitachi Zosen Inova and Martin GmbH dominate the EPC order book. Veolia secured a EUR 240 million Aube concession, while SUEZ clinched a EUR 1.4 billion Toulouse contract that bundles 220 GWh/year of power and 360 GWh/year of heat.(4)SUEZ Group, “Toulouse Concession Announcement,” suez.com These long-dated public-service agreements ensure predictable gate-fee income and reinforce incumbents’ balance sheet strength.
Strategic alliances fast-track innovation. Siemens partners with Boson Energy to build 300 waste-to-hydrogen units capable of 1 million t/year of H₂ by 2030, aiming to tap cross-sector demand from steel and ammonia producers. Plagazi’s EUR 29.5 million Innovation Fund grant for Sweden’s Gävle Circular Park highlights the momentum behind plasma gasification that produces hydrogen and captures liquid CO₂. Carbon capture is a common denominator: Hera and Saipem will strip 90% of CO₂ at Ferrara under a EUR 24 million EU grant, while Enfinium pilots post-combustion capture at Ferrybridge in the UK.
Competitive tension also comes from chemical-recycling entrants vying for high-calorific plastics. LyondellBasell’s EUR 40 million advanced recycling hub in Germany could divert feedstock from incineration. Waste-to-energy operators respond by upgrading sorting lines to minimize recyclable leakage and safeguard gate-fee exclusivity. Success now hinges on integrating capture, securing stable heat buyers, and demonstrating low lifecycle emissions, a playbook that reshapes the European waste-to-energy market.
Europe Waste-to-Energy Industry Leaders
Mitsubishi Heavy Industries Ltd
Martin GmbH
A2A SpA
Veolia Environnement SA
Hitachi Zosen Corp.
- *Disclaimer: Major Players sorted in no particular order

Recent Industry Developments
- May 2025: Plagazi won EUR 29.5 million from the EU Innovation Fund for its Gävle Circular Park hydrogen-from-waste project.
- May 2025: The European Commission allocated EUR 4.2 billion to 77 decarbonisation projects, several of which are waste-to-energy plants with integrated CO₂ capture.
- February 2025: The UK Environment Agency issued an environmental permit for the Portland Energy Recovery Facility, clearing a >3 tph waste-to-energy unit for construction.
- December 2024: SUEZ and Banque des Territoires secured a EUR 1.4 billion 20-year concession to run two Toulouse plants producing 580 GWh/year of energy.


Europe Waste-to-Energy Market Report Scope
Waste is any substance or unwanted material that results from any human activity or process. Municipal solid waste generation rates are influenced by economic development, the degree of industrialization, public habits, and local climate. As a general trend, the higher the economic development, the higher the amount of municipal solid waste generated. Waste-to-energy is the process of generating energy in the form of electricity and/or heat through the primary treatment of waste or processing of the same into a fuel source. The technology used for this process includes physical, thermal, and biological technologies.
The European waste-to-energy market is segmented by technology and geography. By technology, the market is segmented into physical, thermal, and biological. The report also covers the market size and forecasts for the waste-to-energy market across major countries, such as Germany, the United Kingdom, Italy, France, and the rest of Europe.
For each segment, the market sizing and forecasts have been done based on revenue (USD).
By Technology
| Physical (Refuse-Derived Fuel, Mechanical Biological Treatment) |
| Thermal (Incineration/Combustion, Gasification, Pyrolysis and Plasma-Arc) |
| Biological (Anaerobic Digestion, Fermentation) |
By Waste Type
| Municipal Solid Waste (MSW) |
| Industrial Waste |
| Agricultural and Agro-industrial Residues |
| Sewage Sludge |
| Others (Commercial, Construction, Hazardous) |
By Energy Output
| Electricity |
| Heat |
| Combined Heat and Power (CHP) |
| Transportation Fuels (Bio-SNG, Bio-LNG, Ethanol) |
By End-user
| Utilities and Independent Power Producers (IPPs) |
| Industrial Captive Plants |
| District Heating Operators |
| Transport Fuel Distributors |
By Country
| Germany |
| United Kingdom |
| France |
| Italy |
| Spain |
| Nordic Countries (Denmark, Sweden, Finland, Norway) |
| Poland |
| Turkey |
| Russia |
| Rest of Europe |
| By Technology | Physical (Refuse-Derived Fuel, Mechanical Biological Treatment) |
| Thermal (Incineration/Combustion, Gasification, Pyrolysis and Plasma-Arc) | |
| Biological (Anaerobic Digestion, Fermentation) | |
| By Waste Type | Municipal Solid Waste (MSW) |
| Industrial Waste | |
| Agricultural and Agro-industrial Residues | |
| Sewage Sludge | |
| Others (Commercial, Construction, Hazardous) | |
| By Energy Output | Electricity |
| Heat | |
| Combined Heat and Power (CHP) | |
| Transportation Fuels (Bio-SNG, Bio-LNG, Ethanol) | |
| By End-user | Utilities and Independent Power Producers (IPPs) |
| Industrial Captive Plants | |
| District Heating Operators | |
| Transport Fuel Distributors | |
| By Country | Germany |
| United Kingdom | |
| France | |
| Italy | |
| Spain | |
| Nordic Countries (Denmark, Sweden, Finland, Norway) | |
| Poland | |
| Turkey | |
| Russia | |
| Rest of Europe |


Key Questions Answered in the Report
What is the current size and growth outlook of the Europe waste-to-energy market?
The Europe waste-to-energy market is valued at USD 20.43 billion in 2026 and is forecast to reach USD 29.06 billion by 2031, reflecting a 7.31% CAGR.
Which technology segment is expanding the fastest in the Europe waste-to-energy market?
Biological processes, led by anaerobic digestion that supports EU biomethane goals, are growing at an 11.96% CAGR, outpacing traditional thermal routes.
Which country holds the largest share, and which market is growing the quickest?
Germany commands the largest national share at 22.70%, while Spain records the fastest expansion with a 12.18% CAGR through 2031.
How are EU policies influencing investment in the Europe waste-to-energy market?
The EU Waste Framework Directive, the Carbon Border Adjustment Mechanism, and innovation-fund grants link landfill-diversion goals with carbon pricing, steering capital toward large, capture-ready waste-to-energy projects across the region.
Page last updated on:


