Market Overview
| Study Period | 2021 - 2031 |
|---|---|
| Forecast Data Period | 2026 - 2031 |
| Historical Data Period | 2021 - 2024 |
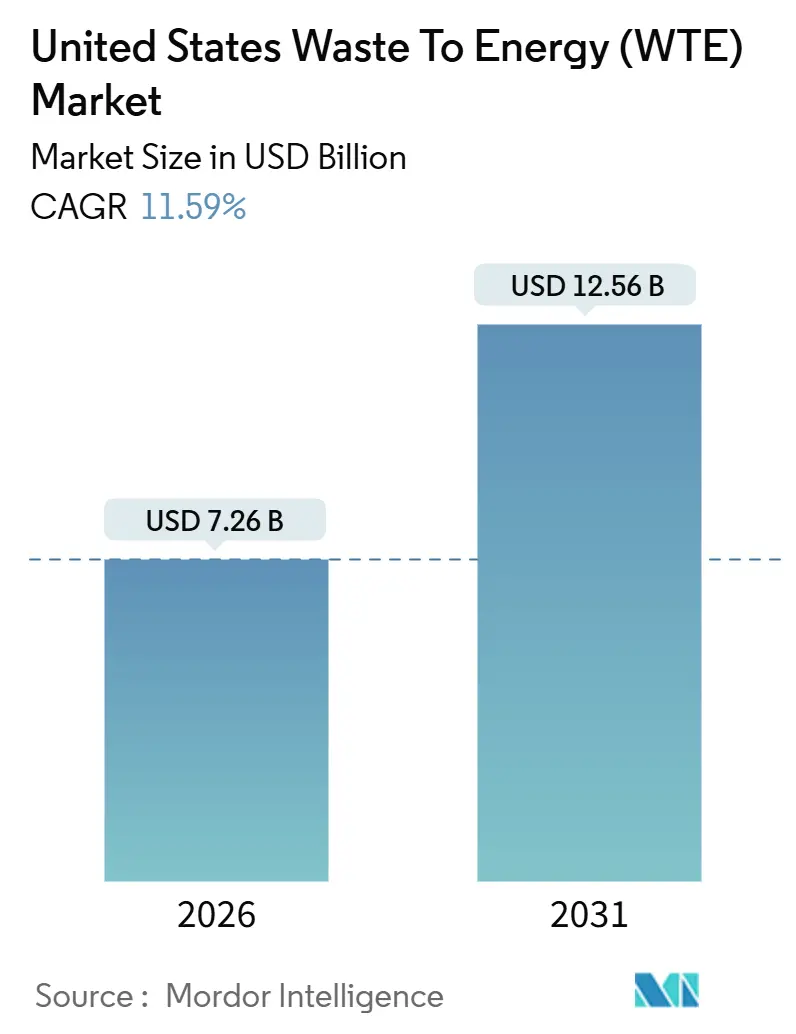
| Market Size (2026) | USD 7.26 Billion |
| Market Size (2031) | USD 12.56 Billion |
| Growth Rate (2026 - 2031) | 11.59% CAGR |
| Market Concentration | High |
Major Players *Disclaimer: Major Players sorted in no particular order Image © Mordor Intelligence. Reuse requires attribution under CC BY 4.0. | |
United States Waste To Energy (WTE) Market Analysis by Mordor Intelligence
The United States Waste To Energy Market size is estimated at USD 7.26 billion in 2026, and is expected to reach USD 12.56 billion by 2031, at a CAGR of 11.59% during the forecast period (2026-2031).
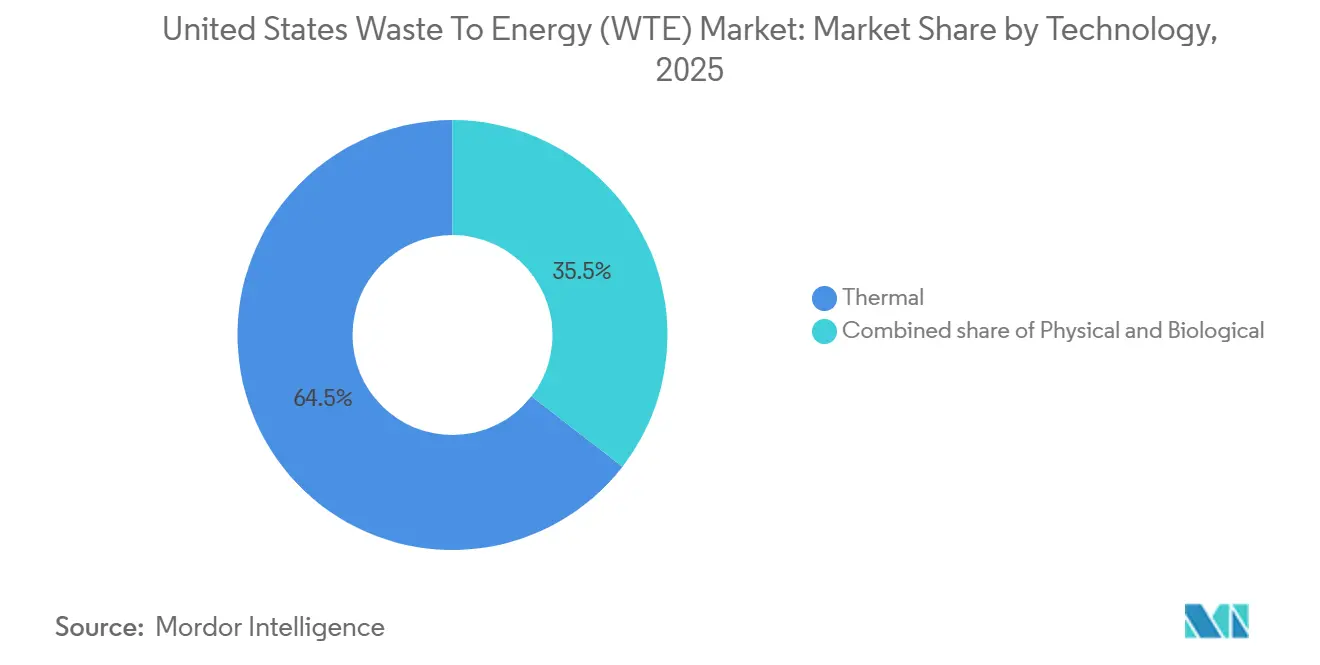
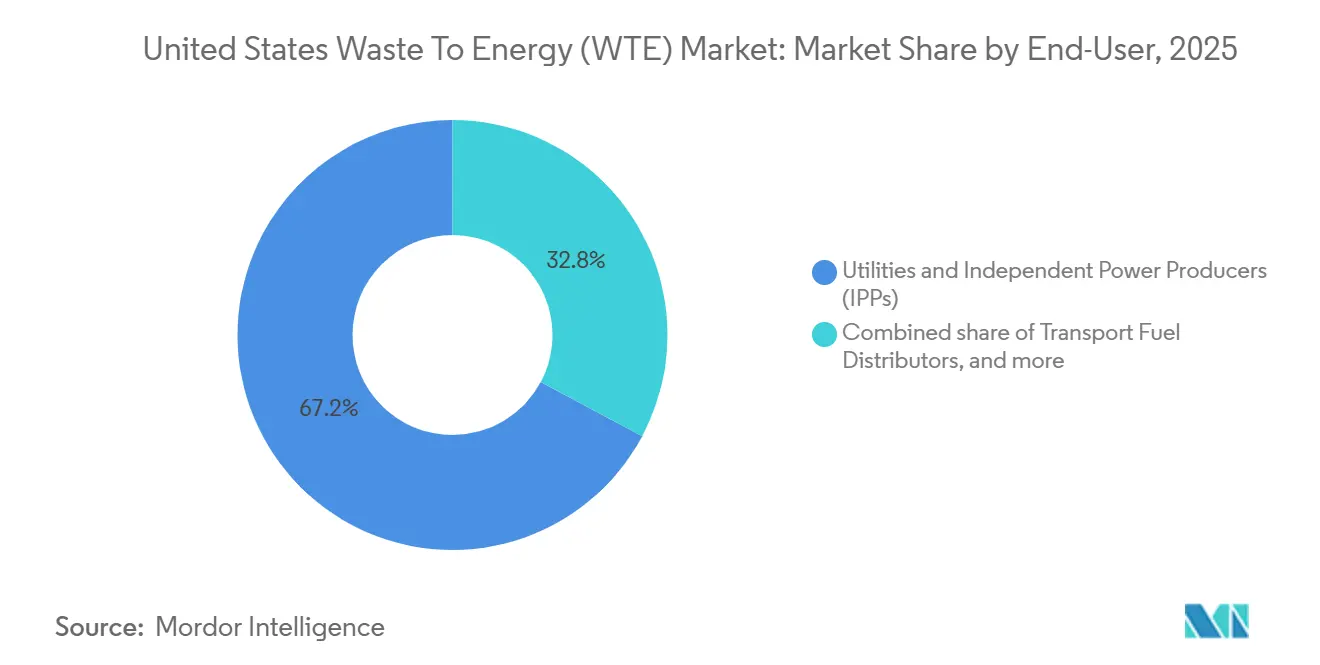
This growth arises from tighter state renewable-portfolio standards, federal tax incentives that lower retrofit costs, and escalating landfill-tipping fees. Thermal technologies continued to dominate revenue at 64.5% in 2025, yet biological pathways are gaining momentum as utilities pursue renewable natural gas that qualifies for low-carbon fuel credits. Municipal solid waste remained the leading feedstock, but agricultural residues are rising quickly as dairy and poultry operators monetize manure under state carbon-credit programs. On the energy-output side, electricity retained a 63.3% share, although transport fuels are expanding on the back of generous California Low Carbon Fuel Standard pricing. Competitive rivalry stays moderate; the top five operators control roughly half of installed capacity, but smaller entrants are thriving in on-farm digestion niches that command premium credit stacks.
Key Report Takeaways
- By technology, thermal systems captured 64.5% revenue share in 2025, while biological conversion is forecast to advance at a 15.9% CAGR through 2031.
- By waste type, municipal solid waste led with 52.9% of the waste-to-energy (WTE) market share in 2025; agricultural residues are set to expand at a 14.6% CAGR between 2026 and 2031.
- By energy output, electricity accounted for 63.3% of the waste-to-energy (WTE) market size in 2025, whereas transport fuels are projected to grow at a 15.3% CAGR to 2031.
- By end-user, utilities and independent power producers held 67.2% of demand in 2025; fuel distributors represent the fastest-growing segment at a 15.2% CAGR through 2031.
Note: Market size and forecast figures in this report are generated using Mordor Intelligence’s proprietary estimation framework, updated with the latest available data and insights as of January 2026.
United States Waste To Energy (WTE) Market Trends and Insights
Drivers Impact Analysis*
| Driver | (~) % Impact on CAGR Forecast | Geographic Relevance | Impact Timeline |
|---|---|---|---|
| Rising landfill-capacity constraints | +2.8% | Northeast corridor (NY, NJ, MA, CT), California | Medium term (2–4 years) |
| Stricter state Renewable Portfolio Standards (RPS) | +2.3% | California, New York, Massachusetts, Connecticut | Short term (≤ 2 years) |
| Inflation Reduction Act tax credits for WtE retrofits | +3.1% | National, with early uptake in FL, PA, MN | Medium term (2–4 years) |
| Corporate zero-waste commitments (Fortune 500) | +1.6% | National, concentrated in metro areas with corporate HQs | Long term (≥ 4 years) |
| High natural-gas price volatility post-2022 | +1.4% | Northeast and Mid-Atlantic states with high heating demand; California industrial corridors | Short term (≤ 2 years) |
| Novel carbon-negative RDF co-firing pilots | +0.9% | Midwest and Southeast states with cement and coal-fired power infrastructure | Long term (≥ 4 years) |
| Source: Mordor Intelligence | |||
Rising Landfill-Capacity Constraints
Landfill tipping fees in the Northeast topped USD 100 per ton in 2025, twice the national average, because remaining airspace in New York, New Jersey, Massachusetts, and Connecticut fell below a decade of capacity. Municipalities are therefore weighing the avoided cost of long-haul disposal against local waste-to-energy contracts that generate renewable-energy certificates. New York regulators warned that 14 of 27 landfills could close by 2033, accelerating procurement of conversion facilities. California’s organic-diversion mandate under SB 1383 redirected 6.8 million tons of food and yard waste in 2025, providing steady feedstock for anaerobic digestion. The combined economics of avoided transport, energy recovery, and credit revenue tilt decision-making toward conversion infrastructure.
Stricter State Renewable Portfolio Standards
Connecticut, Massachusetts, and New York amended renewable-portfolio rules in 2024-2025 to include qualifying waste-to-energy plants that comply with tighter emissions caps. Connecticut now allows Class I renewable-energy certificates for facilities achieving nitrogen-oxide levels below 45 ppm, creating a new USD 35-42 per MWh revenue stream. Massachusetts issued parallel guidance in late 2025 that reclassifies compliant plants as “alternative energy,” encouraging operators to invest in catalytic controls. These adjustments improve project cash flow and favor incumbents with existing grid interconnections.
Inflation Reduction Act Tax Credits for WtE Retrofits
Section 48 investment tax credits deliver 30% cost recovery to conversion facilities that install carbon-capture or shift from mass burn to gasification. Covanta is evaluating retrofits at four plants in Florida and Pennsylvania that could secure USD 85 per ton 45Q credits while claiming Section 48 benefits.[1]Covanta Holding Corporation, “Investor Presentation Q1 2025,” covanta.com Wheelabrator closed USD 120 million of tax-equity financing in 2025 for similar upgrades at Baltimore and Saugus, trimming payback periods to under seven years.[2]Wheelabrator Technologies, “Press Release June 2025,” wtienergy.com Early adopters gain an advantage as engineering slots tighten.
Corporate Zero-Waste Commitments
Amazon, Walmart, and PepsiCo committed to diverting at least 90% of operational waste by 2030, creating demand for reliable conversion outlets.[3]Amazon.com Inc., “Sustainability Report 2025,” amazon.com Amazon routed packaging film and mixed plastics to Brightmark’s Indiana facility in 2025, while Walmart signed a decade-long supply contract with Anaergia to process organic waste from 230 California stores.[4]Walmart Inc., “Corporate News March 2025,” corporate.walmart.com Premium tipping fees, often USD 20-30 per ton higher than municipal rates, compensate waste-to-energy developers for third-party carbon-intensity verification.
Restraints Impact Analysis*
| Restraint | (~) % Impact on CAGR Forecast | Geographic Relevance | Impact Timeline |
|---|---|---|---|
| Heightened PFAS & dioxin emission scrutiny | -1.9% | Northeast (NY, MA, VT), Pacific Northwest (WA, OR) | Short term (≤ 2 years) |
| Declining MSW calorific value due to recycling gains | -1.4% | National, most acute in states with mandatory organics diversion | Medium term (2–4 years) |
| Local opposition to new incinerators ("not-in-my-backyard") | -1.2% | Urban and suburban environmental-justice communities nationwide, particularly in Northeast and California | Medium term (2–4 years) |
| Rising competition from advanced mechanical recycling | -1.0% | States with chemical recycling incentives (TX, OH, PA); regions with venture capital concentration | Long term (≥ 4 years) |
| Source: Mordor Intelligence | |||
Heightened PFAS & Dioxin Emission Scrutiny
Draft EPA guidance released in September 2025 introduced proposed PFAS stack-emission limits, compelling operators to consider activated-carbon injection systems that add up to USD 12 million per site. New York paused permit renewals for two plants pending PFAS controls. Massachusetts and Vermont now require quarterly PFAS sampling with public disclosure, lengthening permits by six to nine months. Tighter dioxin standards referencing the European Union benchmark of 0.05 ng/m³ are influencing U.S. regulators. Compliance costs and reputational risk combine to hamper near-term project starts.
Declining MSW Calorific Value Due to Recycling Gains
The average calorific value of U.S. municipal waste slipped to 9.8 MJ/kg in 2025 because higher recycling captured paper, cardboard, and rigid plastics. Covanta reported a 7% year-over-year drop in steam output per ton at Northeast facilities, compressing electricity margins. Operators are blending supplemental fuels or installing preprocessing lines to homogenize feedstock, yet those investments erode returns. The trend reinforces a move from mass-burn incineration toward gasification and pyrolysis systems that tolerate wider moisture and composition windows.
*Our forecasts treat driver/restraint impacts as directional, not additive. The impact forecasts reflect baseline growth, mix effects, and variable interactions.
Segment Analysis
By Technology: Biological Pathways Gain Momentum
Thermal systems commanded 64.5% of 2025 revenue, yet biological processes are forecast to grow at a 15.9% CAGR through 2031, the highest among technology classes in the waste-to-energy market. Anaergia brought three farm-based digesters online in Wisconsin and Iowa during 2025, each treating up to 60,000 tons of livestock waste and injecting renewable natural gas with carbon intensities below −200 g CO₂e/MJ. Biological platforms also attract capital from utilities eager to diversify gas portfolios with carbon-negative molecules that carry premium credits.
Gasification and pyrolysis projects are gaining share as developers seek chemical feedstock rather than direct combustion, following Enerkem’s demonstrated methanol yields of 300 L per ton at Varennes. Plasma-arc gasification remains niche owing to capital intensity above USD 800 per annual ton. Fermentation routes for cellulosic ethanol advanced when EPA finalized renewable-fuel-standard volumes that prize pathways reducing greenhouse-gas emissions by at least 60%. Fulcrum BioEnergy’s Sierra plant produced 11 million gallons in 2025 and secured a 10-year jet-fuel offtake with United Airlines in January 2026.


By Waste Type: Agricultural Residues Unlock Rural Capacity
Municipal solid waste accounted for 52.9% of feedstock in 2025, yet agricultural residues are expected to expand at a 14.6% CAGR from 2026 to 2031, the fastest of any category in the waste-to-energy market. On-farm digestion qualifies for state low-carbon-fuel credits and federal biogas tax breaks, supporting projects below 20,000 tons per year. Wisconsin, Iowa, and Minnesota collectively added 11 farm digesters in 2025, each injecting renewable gas into interstate pipelines and claiming 45Z production credits.
Industrial waste streams are increasingly intercepted by chemical-recycling firms that depolymerize plastics, diverting high-calorific materials from combustors. Sewage-sludge co-digestion with food waste is rising at municipal wastewater plants in the Mid-Atlantic, guided by Water Environment Federation best-practice manuals. Construction and demolition wood that fails recycling screening is pelletized for cement-kiln co-firing, aligning with U.S. Forest Service wildfire-fuel reduction grants.
By Energy Output: Transport Fuels Command Premium Returns
Electricity retained 63.3% of 2025 output value; however, transportation fuels are projected to rise at a 15.3% CAGR through 2031 as developers chase lucrative California Low Carbon Fuel Standard credit prices that reached USD 180 per t CO₂e in early 2026. Waste Management reported 18 facilities injecting 1.2 billion ft³ of renewable gas into pipelines in 2025, displacing fossil gas across Oregon and Washington.
Combined heat and power (CHP) remains concentrated in industrial clusters such as food processing and pulp and paper, where overall energy efficiency exceeds 75%. District-heating applications are limited but under evaluation in the Northeast as natural-gas-price volatility persists. Membrane and PSA upgrading systems, costing USD 3-5 million apiece, enable pipeline-quality gas production that earns both federal renewable identification numbers and state credits.
By End-User: Fuel Distributors Emerge as Growth Vector
Utilities and IPPs consumed 67.2% of output in 2025, anchored by legacy power-purchase contracts. Fuel distributors, however, are the fastest-growing end-user segment at a 15.2% CAGR to 2031 within the waste-to-energy market. Clean Energy Fuels signed seven-year deals in 2025 for 25 million diesel-gallon equivalents of low-carbon gas, transferring technology risk to project developers.
Industrial facilities are piloting on-site conversion of cafeteria waste into CHP energy, evidenced by Amazon’s 150-kW Aurora digester that offsets 8% of electricity demand. Municipal procurement remains steady yet faces elongated timelines as communities demand environmental-justice assurances. Developers able to tailor technology and contracts to decarbonization targets capture rising industrial and transport-related demand.
Geography Analysis
The Northeast corridor accounted for an estimated 42% of installed thermal capacity in 2025 because landfill scarcity forces waste-disposal alternatives. Florida recorded the highest capacity additions during 2024-2026, commissioning three new plants and expanding two others on the back of coastal landfill constraints and favorable renewable-certificate pricing. California’s SB 1383 mandate shifted feedstock toward digestion, lowering mass-burn throughput by 9% in 2025 while boosting renewable-gas output by 34%.
The Midwest is emerging as a renewable-gas hub as agriculture monetizes manure; 11 farm digesters were added in Wisconsin, Iowa, and Minnesota in 2025. The Pacific Northwest advanced two gasification projects targeting forestry residues, aligned with state clean-fuel policies that award negative carbon-intensity scores. In contrast, the Southeast, excluding Florida, remains underpenetrated owing to abundant landfill capacity and weak renewable mandates.
Clean Air Act non-attainment zones complicate new permits; the South Coast Air Quality Management District effectively blocks new combustion projects by setting stringent nitrogen-oxide and particulate caps. Rural Northeast counties with aging landfills prioritize waste-to-energy despite modest certificate prices because avoided transport costs justify investment. These regional dynamics explain why the 11.59% national CAGR will materialize unevenly across states.
Regulatory Landscape
The United States waste-to-energy (WTE) sector follows a federal-state compliance framework grounded in the Clean Air Act (CAA) and the Resource Conservation and Recovery Act (RCRA). Under CAA Section 129, the US Environmental Protection Agency (EPA) sets numeric emissions limits for waste incineration categories, which states translate into implementation plans, permits, and retrofit or permitting schedules for municipal solid waste combustion and other solid waste incineration assets.
In March 2026, the EPA finalized revised New Source Performance Standards (NSPS) and Emission Guidelines (EG) for Large Municipal Waste Combustors (MWC), updating limits for particulate matter, mercury, and nitrogen oxides. This builds on prior rulemaking for Other Solid Waste Incineration (OSWI) units, with updated standards and monitoring requirements taking effect on August 29, 2025. Alongside environmental compliance, the US Department of Energy (DOE) supports conversion and end-use pathways through program funding and statutory authorities such as the Waste Energy Recovery Incentive Grant Program (42 U.S.C. 6343), shaping project development, demonstrations, and technology upgrades across the national WTE market.
Competitive Landscape
The top five operators, Covanta, Wheelabrator, WIN Waste Innovations, Veolia, and Waste Management, controlled 52% of U.S. capacity in 2025, signaling a moderately concentrated waste-to-energy market. Strategic focus in 2025-2026 skewed toward partnerships that integrate waste conversion into hard-to-abate value chains. Enerkem and Shell are co-developing three gasification-to-methanol plants, the first in Oregon, targeting 150,000 t per year of municipal waste. Fulcrum BioEnergy signed a 50-million-gallon sustainable-aviation-fuel offtake with United Airlines, supporting expansion beyond Nevada.
Smaller players such as Brightmark, Bioenergy DevCo, and Anaergia are installing modular digesters at dairy farms, bypassing municipal procurement cycles and capturing simultaneous 45Z production credits, Low Carbon Fuel Standard premiums, and renewable identification numbers. Patent activity shows intensified research into catalytic pyrolysis and hydrothermal liquefaction that convert wet organics into bio-crude at lower energy input, a potential differentiator for food-waste and sludge projects.
Regulatory compliance is an emerging moat; facilities with continuous emissions monitoring and third-party stack testing, like Covanta’s portfolio, secure permits faster in PFAS-sensitive states. Operators unable to finance selective catalytic reduction or activated-carbon systems may divest or mothball assets. The market is bifurcating: capital-rich incumbents dominate utility-scale electricity and CHP, while agile entrants capture higher-margin transport and industrial opportunities.
United States Waste To Energy (WTE) Industry Leaders
Wheelabrator Technologies Inc
Suez SA
Waste Management, Inc
Covanta Holding Corp
WIN Waste Innovations
- *Disclaimer: Major Players sorted in no particular order

Market Opportunities and Future Outlook
Near-term whitespace is concentrated in renewable natural gas (RNG) pathways that monetize organics diversion and landfill methane capture while operating within tighter air-emissions scrutiny for combustion. California SB 1383 has already redirected sizable organics volumes toward digestion, and early 2026 California Low Carbon Fuel Standard pricing has strengthened the economics for transport fuels versus merchant electricity, pushing developers and municipalities toward pipeline-injection gas and fuel distribution offtakes.
A buildout pipeline is taking shape around landfill gas (LFG)-to-RNG and anaerobic digestion projects structured as long-tenor public-private arrangements. In July 2026, Yolo County and Redtail Renewables executed an agreement for an LFG-to-RNG project at the Yolo County Central Landfill, and Randolph County signed a 20-year agreement with Waga Energy to construct and operate an RNG facility at the Great Oak Landfill. On organics processing, Vanguard Renewables broke ground in June 2026 on an anaerobic digestion and organics recycling facility in Litchfield, Minnesota (300 tons per day), and reported completion of three RNG facilities in March 2026 (in River Falls, WI, Eden, WI, and Amelia Court House, VA) through its joint venture with TotalEnergies. Together, these deals and starts point to where developers are capturing value through long-term feedstock control, grid and pipeline interconnections, and stacked federal-state incentive eligibility for low-carbon fuels and biogas upgrades.
Recent Industry Developments
- July 2026: Randolph County signed a 20-year agreement with Waga Energy to build and operate a renewable natural gas production facility at the Great Oak Landfill. The long-duration contract model strengthens feedstock and offtake visibility for landfill-gas-to-RNG projects, supporting capital deployment into pipeline-quality upgrading and interconnection.
- July 2025: FCC Environmental Services completed the acquisition of WIN Waste Innovations' South Broward Waste-to-Energy Facility in Fort Lauderdale, Florida. The transaction marked FCC's first WTE facility in the United States and shifted asset ownership dynamics in a high-activity state for WTE operations.
- April 2025: WIN Waste Innovations entered an agreement to sell its South Broward Waste-to-Energy Facility to FCC Environmental Services. Portfolio rotation by a major operator showed how owners are reallocating capital toward core geographies and compliance-ready assets as new entrants pursue established operating platforms.


Research Methodology Framework and Report Scope
Market Definition and Coverage
This market covers the value of converting non-recyclable waste streams into usable energy in the United States, captured through waste-to-energy plants and systems that generate electricity, heat, combined heat and power, or transport fuels.
Scope exclusions: This sizing excludes conventional recycling, landfill-only disposal, and waste collection services that do not result in energy output.
Segmentation Overview
- By Technology
- Physical (Refuse-Derived Fuel, Mechanical Biological Treatment)
- Thermal (Incineration/Combustion, Gasification, Pyrolysis and Plasma-Arc)
- Biological (Anaerobic Digestion, Fermentation)
- By Waste Type
- Municipal Solid Waste
- Industrial Waste
- Agricultural and Agro-industrial Residues
- Sewage Sludge
- Others (Commercial, Construction, Hazardous)
- By Energy Output
- Electricity
- Heat
- Combined Heat and Power (CHP)
- Transportation Fuels (Bio-SNG, Bio-LNG, Ethanol)
- By End-user
- Utilities and IPPs
- Industrial Captive Plants
- District Heating Operators
- Transport Fuel Distributors
Data Sources, Market Sizing, and Validation
Desk Research
Desk work started with public series that show the size of the waste feedstock and the energy output. Sources such as US EPA materials and waste data, US EIA electricity generation and plant fuel use tables, and state environmental agency permitting pages were used to separate what is operating from what is still being planned.
To keep assumptions grounded, we also reviewed sources such as the US Census Bureau for population and housing indicators that influence municipal solid waste generation, trade association publications on landfill diversion and tipping fees, and peer-reviewed journals that track conversion efficiency and emissions compliance. In addition, public company filings and investor presentations were used to sanity-check capacity additions and operating economics, and a paid subscription for company financials, patent activity, and shipment level trade signals was referenced to confirm directional moves. These examples are not exhaustive, and many other public sources were reviewed to collect data, validate assumptions, and clarify gaps.
Primary Interviews and Surveys
Primary calls and surveys were run with plant operators, technology and EPC teams, waste haulers, and power offtake or utility stakeholders across the United States, so that secondary inputs could be verified and adjusted where needed. We used these discussions to test operating rates, typical gate fee structures, energy yield assumptions, and the delays projects can face when permitting or interconnection issues arise.
Distribution of primary research fieldwork respondents
| Company type | Respondent position | Region |
|---|---|---|
| Top tier: 39% | CXOs: 20% | |
| Mid tier: 40% | Functional/Unit leaders: 35% | |
| Smaller Players: 21% | Managers: 45% |
Market-Sizing & Forecasting
Sizing was built using a top-down demand reconstruction, where the portion of the country waste stream that is realistically available for energy recovery was translated into energy output and revenue using observed plant utilization patterns and typical pricing logic. That view was then cross-checked with selective bottom-up approximations, mainly through sampled plant capacity rollups, channel checks on new build timelines, and ASP-by-output assumptions applied to verified volumes.
Key inputs that shaped the model included municipal solid waste and industrial waste availability, operating waste-to-energy capacity and utilization rates, net electricity and heat output per ton (and how it changes with technology), average gate fees and offtake pricing, and permitting and interconnection timelines that shift commissioning dates. Forecasts were developed using scenario analysis, so the base case and alternate cases reflect how quickly projects move from planned to operational and how sensitive revenues are to gate fees and energy pricing.
Data Validation & Update Cycle
Estimates were checked through triangulation across waste generation signals, operating capacity, and energy output statistics, then variances were investigated before final sign-off. Where inputs conflicted, we rechecked definitions, adjusted for timing differences, and re-contacted industry participants when a change could shift the totals.
A second analyst review was completed to confirm arithmetic integrity, scope consistency, and year alignment. Reports are refreshed annually, with interim updates when material events occur such as new capacity announcements, major shutdowns, or meaningful policy changes, and a final pre-delivery review is done so clients receive the most current view.
Mordor Intelligence's United States Waste to Energy Market Market Size Measured Against Other Published Estimates
Published sizes for US waste-to-energy often do not match, mainly because the counted revenue pool is not always the same and the timing of the base year can shift what is treated as operational versus still planned. Differences also come from how each source treats energy output types, plant utilization, and whether gate fees are included alongside power and heat revenues.
By checking operating capacity, utilization, and realized output pricing each refresh, Mordor Intelligence keeps the market value tied to facilities that are actually producing energy in the stated year, rather than blending in early stage pipeline in the same total.
Benchmark comparison
| Source | Market Size | Gaps in Research Methodology |
|---|---|---|
| Mordor Intelligence | USD 7.26 B (2026) | |
| Global Consultancy A | USD 7.32 B (2026) | Uses a different base year (2025) and may bring planned state-level additions into the early forecast year, which can slightly lift the 2026 value even when utilization is not yet proven. |
| Industry Research House B | USD 3.10 B (2024) | Anchors the series on an earlier year and appears to use a narrower revenue capture, which can exclude parts of the value chain such as certain energy outputs or gate-fee treatment, resulting in a lower headline number. |
The spread is mostly explained by year alignment and what gets counted as monetized activity, especially when pipeline projects are mixed with operating plants and when revenue streams are treated differently. Using clearly defined waste availability, plant utilization, and pricing checks keeps the estimate repeatable and easier to reconcile when new plants start up or when energy and gate fee conditions change.


Key Questions Answered in the Report
How large is the U.S. waste-to-energy market in 2026?
The waste-to-energy market size reached USD 7.26 billion in 2026 and is forecast to grow rapidly through 2031.
What is the expected growth rate for waste-to-energy through 2031?
National revenue is projected to rise at an 11.59% CAGR, driven mainly by federal tax credits and stricter state renewable-energy mandates.
Which technology is expanding fastest in waste-based conversion?
Biological pathways, primarily anaerobic digestion and fermentation, are forecast to advance at a 15.9% CAGR between 2026 and 2031.
Which feedstock segment shows the highest growth potential?
Agricultural and agro-industrial residues are set to expand at a 14.6% CAGR as farms monetize manure under low-carbon fuel programs.
Why are transport fuels gaining popularity versus electricity?
California’s Low Carbon Fuel Standard credits, now near USD 180 per t CO₂e, yield higher and more stable revenues than wholesale power markets.
Page last updated on:


