Renewable Energy Transformer Market Size and Share
Market Overview
| Study Period | 2020 - 2030 |
|---|---|
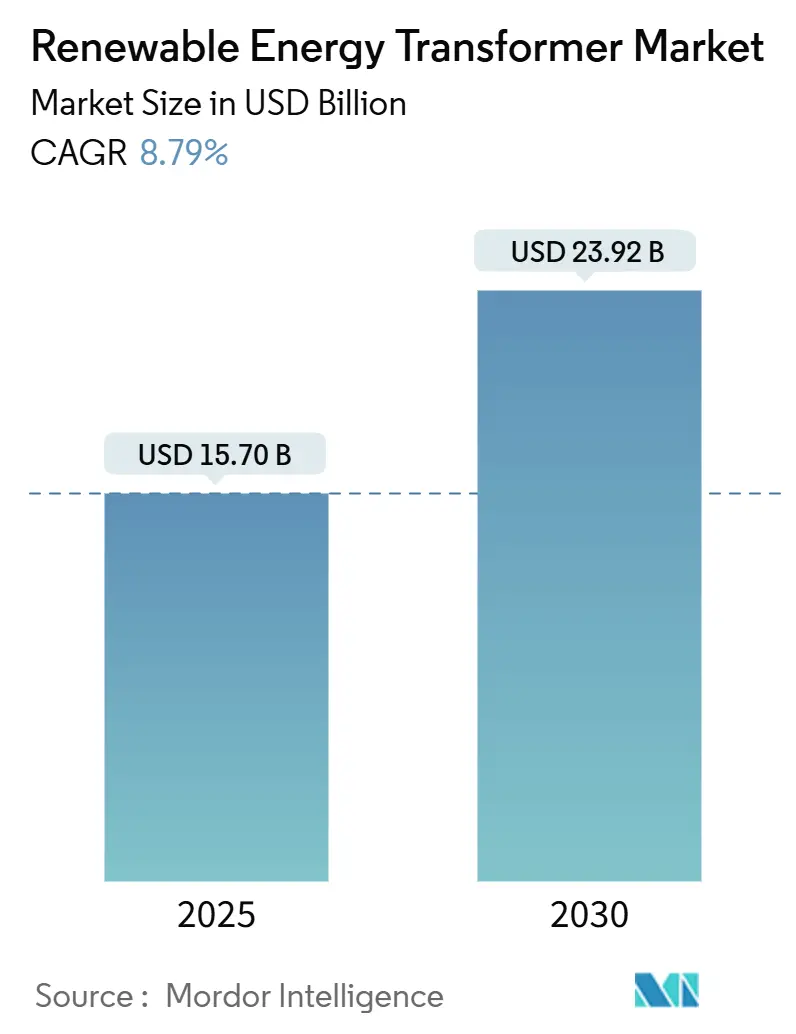
| Market Size (2025) | USD 15.70 Billion |
| Market Size (2030) | USD 23.92 Billion |
| Growth Rate (2025 - 2030) | 8.79% CAGR |
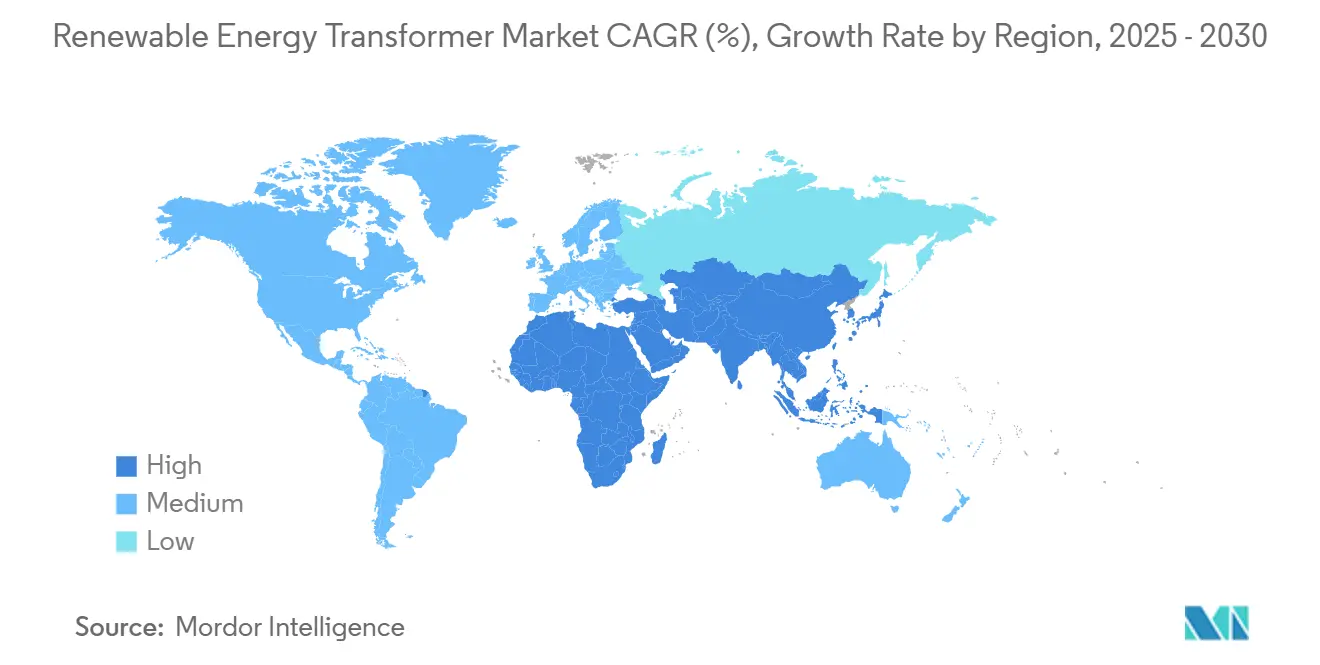
| Fastest Growing Market | Asia Pacific |
| Largest Market | Asia Pacific |
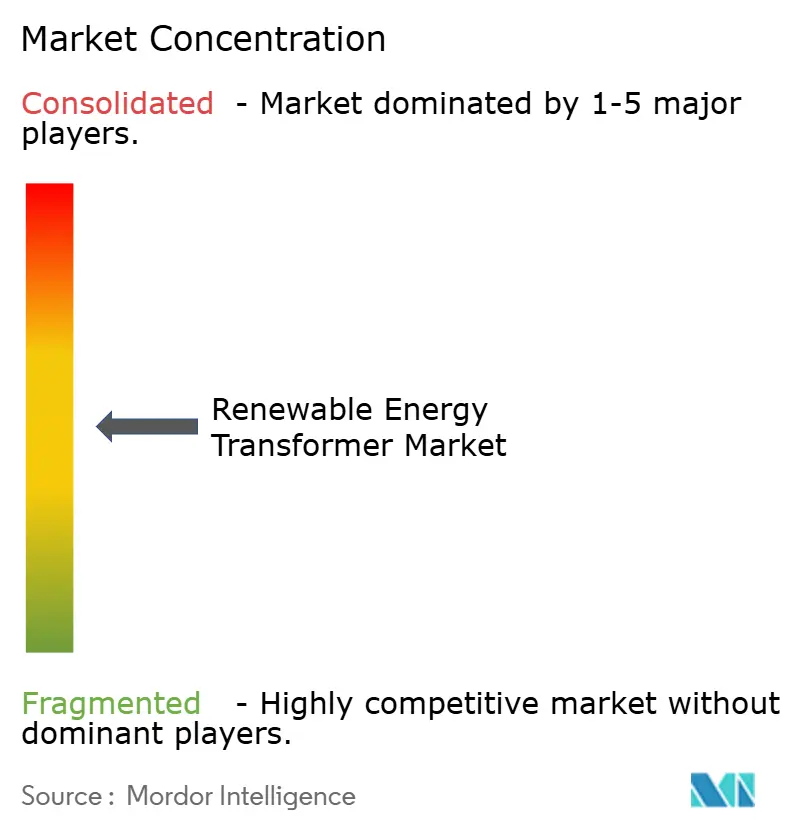
| Market Concentration | Medium |
Major Players *Disclaimer: Major Players sorted in no particular order Image © Mordor Intelligence. Reuse requires attribution under CC BY 4.0. | |
Renewable Energy Transformer Market Analysis by Mordor Intelligence
The Renewable Energy Transformer Market size is estimated at USD 15.70 billion in 2025, and is expected to reach USD 23.92 billion by 2030, at a CAGR of 8.79% during the forecast period (2025-2030).
This growth trajectory outstrips that of conventional transformer segments because solar and wind projects require units that manage bidirectional power flow, provide fast voltage regulation, and enable real-time monitoring. Rising utility-scale solar additions, accelerating offshore wind build-outs, and stricter policy mandates are driving the sustained procurement of high-capacity step-up transformers that stabilize renewable-heavy grids. Manufacturers are responding with ester-fluid insulation, digital twin modeling, and condition-based maintenance platforms that extend asset life while meeting evolving safety and environmental standards. Supply chain bottlenecks, however, continue to stretch lead times and inflate prices, pushing utilities to lock in long-term supply contracts and co-invest in new manufacturing capacity.
Key Report Takeaways
- By type, power transformers led with a 53.6% share of the renewable energy transformer market in 2024, while distribution transformers are forecast to expand at a 9.8% CAGR through 2030.
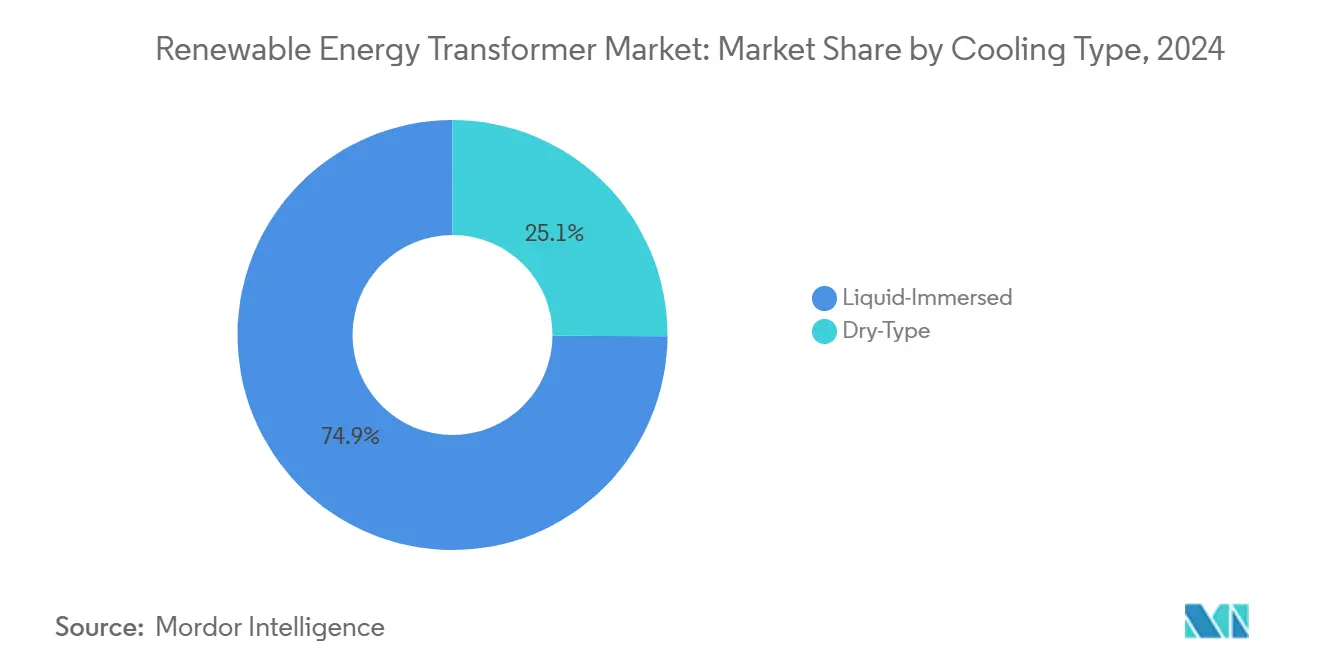
- By cooling method, liquid-immersed units commanded a 74.9% share of the renewable energy transformer market size in 2024, whereas dry-type transformers are set to grow at a 10.1% CAGR through 2030.
- By core technology, conventional designs held a 69.7% share in 2024; however, solid-state transformers are projected to record the highest CAGR of 14.5% from 2024 to 2030.
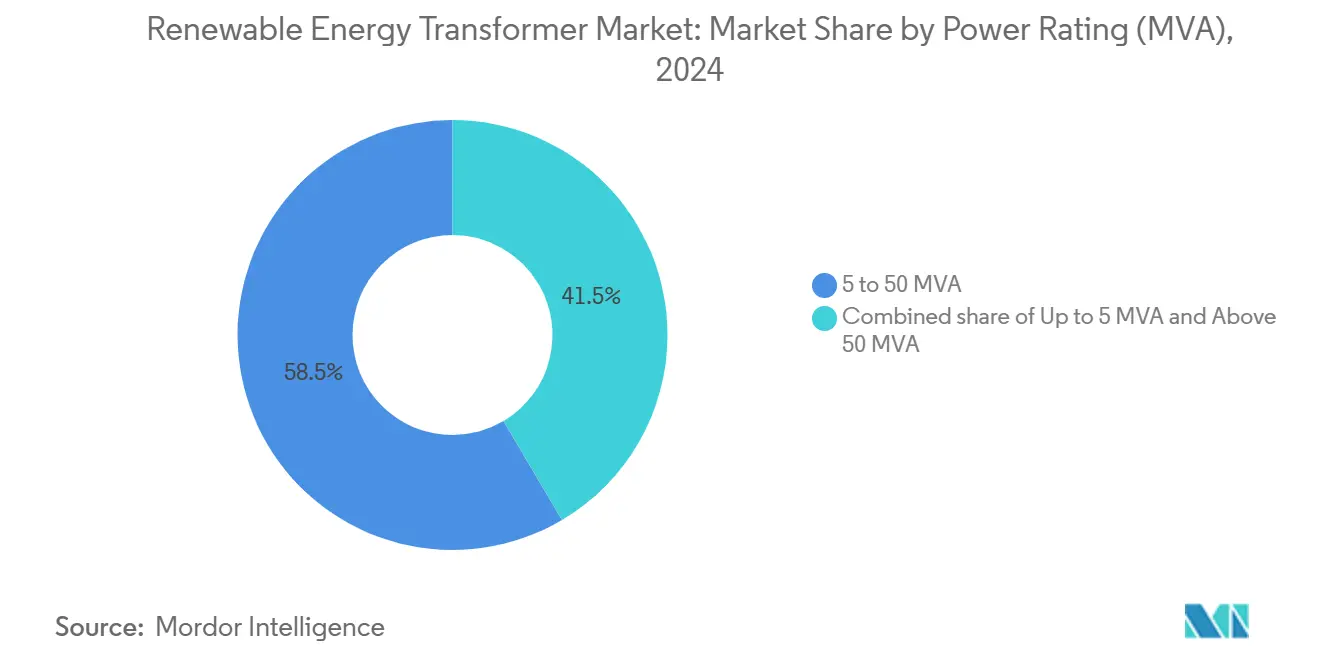
- By power rating, the 5–50 MVA range accounted for 58.5% of the renewable energy transformer market size in 2024 and is projected to advance at a 9.3% CAGR through 2030.
- By application, solar PV plants contributed 48.2% of 2024 revenue, while wind farm installations are slated to rise at a 9.0% CAGR to 2030.
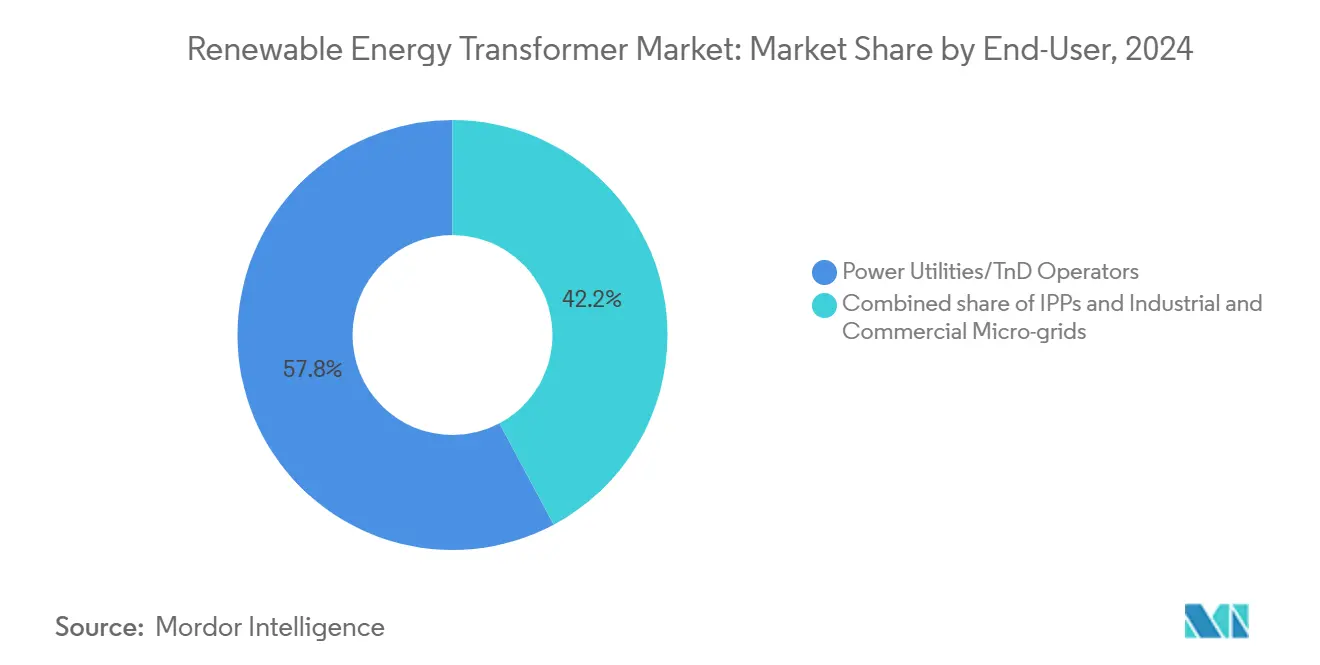
- By end-user, utilities held a 57.8% share in 2024; industrial and commercial microgrids posted the fastest growth at a 10.4% CAGR through 2030.
- By geography, the Asia-Pacific region led with a 43.5% share in 2024 and is projected to expand at a 9.5% CAGR through 2030.
- Three vendors—Hitachi Energy, ABB, and Siemens Energy—collectively controlled 38% of global 2024 shipments, underscoring a moderately concentrated landscape.
Global Renewable Energy Transformer Market Trends and Insights
Drivers Impact Analysis*
| Driver | (~) % Impact on CAGR Forecast | Geographic Relevance | Impact Timeline |
|---|---|---|---|
| Utility-scale solar & wind build-out | +2.8% | Global, concentrated in APAC and North America | Medium term (2-4 years) |
| Grid-modernization & smart-grid roll-outs | +2.1% | North America & EU, expanding to APAC | Long term (≥ 4 years) |
| Renewable portfolio standards & subsidies | +1.9% | Global, led by EU, California, and China | Short term (≤ 2 years) |
| Replacement of ageing T&D assets | +1.5% | North America & EU core, spill-over to emerging markets | Long term (≥ 4 years) |
| Adoption of eco-friendly ester-fluid units | +0.8% | EU and North America leading, global adoption following | Medium term (2-4 years) |
| Offshore-wind HVDC inter-connector demand | +1.2% | EU North Sea, expanding to APAC and North America | Medium term (2-4 years) |
| Source: Mordor Intelligence | |||
Utility-Scale Solar and Wind Build-Out Accelerates Transformer Demand
Global utility-scale renewable additions surpassed all previous records in 2025, increasing the need for robust step-up transformers that manage intermittent output and enable fault-ride-through capability. Solar PV installations require fast-responding voltage regulation across wide irradiance swings, while onshore and offshore wind farms demand harmonic mitigation and corrosion-resistant enclosures. To meet these requirements, suppliers have upgraded cooling circuits, introduced high-temperature solid insulation, and integrated fiber-optic sensing that feeds analytics platforms for predictive maintenance. Offshore projects push ratings above 66 kV, and Hitachi Energy’s WindSTAR line crossed the 1,000-unit milestone in 2024, illustrating the scale of specialized demand.[1]Hitachi Energy, “Power Transformer Market Perspectives,” hitachienergy.com The sustained rollout of gigawatt-scale clusters in China, India, the United States, and the North Sea continues to propel the renewable energy transformer market on a steep growth path.
Grid Modernization and Smart Grid Rollouts Drive Technology Evolution
Utilities across North America and Europe are layering advanced monitoring and control onto legacy networks, embedding digital twins into substations and distribution nodes. Intelligent transformers equipped with edge computing and IEC 61850 protocols now offer dynamic tap-changing, ride-through services, and synthetic inertia that mimic the behavior of synchronous generators.[2]ABB Ltd., “Digital Substations for Grid Modernization,” abb.com European network codes require grid-forming inverters by 2026, indirectly pressuring transformer suppliers to embed power electronics for fast frequency response. Solid-state transformers shrink footprint by up to 70%, enable seamless AC–DC conversion, and interact with distributed energy resources, positioning them as cornerstone assets in emerging smart grids. These capabilities elevate capital cost but deliver lifecycle savings through lower losses and deferred network upgrades, reinforcing long-run adoption.
Renewable Portfolio Standards and Policy Incentives Accelerate Market Growth
Mandates such as the EU's Fit for 55 package, California’s 60% renewable energy target for 2030, and China’s 1,200 GW wind-plus-solar goal translate into predictable procurement pipelines for high-specification transformers. The European Commission estimates that EUR 584 billion in grid investment will be required by 2030, with a significant share allocated to substations and transformer upgrades.[3]European Commission, “Investment Needs for Fit for 55,” ec.europa.eu In Latin America, renewables already accounted for 60% of electricity in 2024, spurring procurement of ester-fluid units for environmentally sensitive zones. The U.S. Department of Energy’s FITT program allocated USD 20 million to accelerate solid-state transformer commercialization, validating public-sector commitment to next-generation designs. These incentives underpin multi-year order backlogs and send strong demand signals across the renewable energy transformer market.
Replacement of Aging T&D Assets Creates Sustained Opportunity
Large power transformers now average 38 years in service, surpassing optimal lifespan thresholds and increasing the risk of failure amid rising renewable energy penetration. The United States alone may need a 160–260% stock increase by 2035 to accommodate electrification and the retirement of existing capacity. Utilities are thus aligning replacement cycles with renewable integration targets, opting for ester-fluid, digitally monitored units that simultaneously enhance safety, efficiency, and grid visibility. Europe mirrors this trend as operators switch from vintage mineral-oil transformers to eco-design-compliant models, bundling procurement with substation automation to justify capital expenditures. The resulting base-replacement demand adds a stable layer to renewable-driven expansion, fortifying the renewable energy transformer industry against cyclical swings.
Restraints Impact Analysis*
| Restraint | (~) % Impact on CAGR Forecast | Geographic Relevance | Impact Timeline |
|---|---|---|---|
| High upfront capex of medium & high-voltage units | -1.8% | Global, particularly challenging in emerging markets | Short term (≤ 2 years) |
| Volatile copper & electrical-steel prices | -1.2% | Global supply-chain impact | Short term (≤ 2 years) |
| Grid-integration & curtailment challenges | -0.9% | Regions with high renewable penetration | Medium term (2-4 years) |
| Cyber-security concerns in digitally monitored units | -0.6% | Developed markets with advanced grid infrastructure | Long term (≥ 4 years) |
| Source: Mordor Intelligence | |||
High Capital Expenditure Requirements Constrain Market Expansion
Transformer prices have escalated 40% since 2019, and lead times on large units now exceed 210 weeks, straining project budgets and schedules. Financing hurdles are most acute in emerging economies where concessional capital is scarce and currency risk raises borrowing costs. Offshore-wind developers must fund multiple 400 kV or 525 kV units per platform, committing tens of millions of USD long before revenue flows. To mitigate cost shocks, purchasers are negotiating framework agreements, co-investing in supplier expansions, and exploring leasing models that spread capital expenditures over the asset's life. Despite these tactics, high upfront spending continues to be a drag on near-term adoption, especially for mid-sized IPPs.
Raw Material Price Volatility Threatens Supply Chain Stability
Copper demand is forecast to reach 50 million t by 2035, yet mine output trails consumption growth, driving price spikes that can raise transformer material costs by up to 20%.[4]International Energy Forum, “Copper Demand Outlook,” ief.org Non-oriented electrical steel faces similar constraints, exacerbated by tariffs and geopolitical uncertainty. OEMs are diversifying suppliers, substituting aluminum windings where technically feasible, and investing in scrap recycling to buffer volatility. Nevertheless, spot-price shocks ripple quickly across order books, prompting surcharge clauses that complicate budgeting for renewable asset owners.
*Our forecasts treat driver/restraint impacts as directional, not additive. The impact forecasts reflect baseline growth, mix effects, and variable interactions.
Segment Analysis
By Type: Power Transformers Lead While Distribution Segment Accelerates
Power transformers generated 53.6% of revenue in 2024, reflecting their critical role in utility-scale interconnections that elevate voltage from 35 kV collector arrays to 220–400 kV transmission grids. This slice of the renewable energy transformer market is expected to maintain mid-single-digit expansion as offshore wind platforms require ever-larger 500–800 MVA ratings. Distribution transformers, however, are advancing at a 9.8% CAGR as rooftop solar, community wind, and battery-equipped microgrids proliferate in suburban and industrial districts. Increased bidirectional power flow and harmonic distortion in low-voltage feeders compel utilities to replace aging units with high-efficiency, amorphous-core models equipped with online monitoring.
In rural electrification and emerging market contexts, compact pole-mounted units enable the rapid connection of mini-grids that blend solar PV and diesel backup. Manufacturers such as Central Moloney and Cam Tran now co-develop modular platforms optimized for containerized assembly, cutting field installation time by one-third. The distribution segment’s higher growth rate, therefore, offsets its smaller base, reinforcing a diversified demand structure inside the renewable energy transformer market.
By Cooling Type: Liquid-Immersed Dominance Faces Dry-Type Challenge
Liquid-immersed designs captured 74.9% of 2024 sales, thanks to their superior thermal conductivity, which accommodates high load factors typical of multi-GW solar parks. Natural-ester fluids push temperature limits higher than mineral oil, allowing for either a 20% loading boost or a footprint reduction. Consequently, liquid units remain indispensable for offshore HVDC converter stations. Dry-type alternatives, however, are growing at a 10.1% CAGR in response to fire-safety regulations in dense urban zones and data-center campuses, where oil containment is impractical.
Recent innovations, including nano-enhanced epoxy resins and forced-air channels, now enable dry-type transformers to reach up to 30 MVA, encroaching on the territory once exclusive to oil-filled equipment. Utilities in California and South Korea specify dry-type units for areas prone to wildfires, while commercial developers appreciate their minimal maintenance requirements. These shifts gradually rebalance segment demand, yet liquid designs still anchor the renewable energy transformer market size for large-scale renewable nodes.


By Core Technology: Conventional Leadership Challenged by Solid-State Innovation
Conventional laminated-core transformers retained a 69.7% share in 2024, leveraging a century of field data, standardized testing, and a broad supplier base that enables pricing stability. The smart-transformer subset enhances these legacy platforms with embedded sensors, partial-discharge detectors, and SCADA gateways, providing incremental value without requiring radical architectural changes. Solid-state transformers, built on high-frequency silicon-carbide switches and planar magnetics, grew 14.5% annually and now supply pilot DC microgrids in campuses and light-rail systems.
Solid-state units cut no-load losses by up to 70%, support sub-cycle voltage ride-through, and seamlessly interface with batteries. Nevertheless, high semiconductor costs and limited high-voltage testing standards temper mass adoption. The U.S. FITT program funds prototype scaling to 20 MVA by 2027, which, if proven reliable, could erode conventional share and redefine performance baselines within the renewable energy transformer market.
By Power Rating: Mid-Range Dominance Reflects Renewable Project Scale
Transformers rated 5–50 MVA accounted for 58.5% of global revenue in 2024, aligning perfectly with the block-modular architecture of modern wind and solar plants. This rating balances shipping constraints, pad space, and redundancy goals; two 40 MVA units often outperform a single 80 MVA unit in terms of total lifecycle cost. The class is also less bottlenecked than extra-high-voltage categories, keeping average lead times under 80 weeks.
Segments above 50 MVA power new ±525 kV HVDC corridors and utility interties, but with tight core-steel supply constraints. Units below 5 MVA energize commercial rooftops and rural community projects; their volumes are high, but margins are thin. Mid-range dominance, therefore, stabilizes revenue and supports economies of scale, anchoring profitability across the renewable energy transformer market.
By Application: Solar Leadership Meets Wind Growth Momentum
Solar PV plants accounted for 48.2% of the 2024 turnover, reflecting rapid declines in module costs and aggressive installation targets across China, India, and the United States. Transformers in these plants manage variable output and high DC-to-AC conversion ratios, often operating with a 1.3-1.5 DC/AC oversizing ratio. Wind farm deployments, especially offshore arrays, showed 9.0% CAGR as turbine ratings climbed to 15 MW and array voltages moved from 33 kV to 66 kV, necessitating bespoke designs with low weight-to-performance ratios.
Hydro, biomass, and geothermal plants maintain smaller shares but offer stable baseload profiles that complement intermittent sources. Geothermal sites in Kenya and Indonesia utilize hermetically sealed ester units to mitigate gas ingress, demonstrating niche applications. This blend of volume and specialization cements application diversity inside the renewable energy transformer industry.
By End-User: Utility Dominance Faces Microgrid Disruption
Utilities and transmission operators absorbed 57.8% of 2024 shipments, driven by mandated interconnection upgrades and aging-fleet replacements. Their bulk purchasing power shapes technical specifications and underpins long-term framework contracts, providing demand visibility for OEMs. Independent power producers follow with multi-gigawatt (GW) pipelines that mirror utility standards but offer flexible pricing through competitive auctions.
Industrial and commercial microgrids, expanding at a 10.4% CAGR, now require medium-voltage transformers with seamless islanding and black-start capabilities. Projects such as Timet’s 106 MW solar-plus-storage facility prove that heavy industry can electrify primary processes and hedge energy costs via onsite renewables. Military bases and university campuses adopt similar architectures to bolster resilience, eroding the utility monopoly and injecting a customer-centric dynamic into the renewable energy transformer market.
Geography Analysis
Asia-Pacific captured 43.5% of 2024 revenue and is set to grow at 9.5% CAGR through 2030, propelled by China’s record wind-and-solar rollouts and India’s 500 GW target that stretches HVDC corridors across the subcontinent. Domestic manufacturing incentives and faster permitting cycles compress project timelines, compelling local OEMs to amplify capacity and partner with global specialists for design know-how.
Europe remains a technology leader despite slower headline growth, channeling EUR 584 billion into grid reinforcement that favors ester-fluid units and offshore wind interconnectors. The region’s high renewable penetration demands grid-forming features, stimulating early adoption of solid-state prototypes. Meanwhile, the renewable energy transformer market size in North America benefits from tax credits, aging-fleet replacement, and onshore wind repowering, though permitting delays temper the speed of execution.
Latin America and the Middle East & Africa account for smaller but fast-rising slices as abundant solar resources and green-hydrogen ambitions unlock multibillion-dollar corridors. Brazil, Chile, Saudi Arabia, and South Africa each tendered more than 2 GW of renewable blocks in 2024, specifying corrosion-protected or dry-type transformers for desert and coastal sites. These fronts will collectively raise the renewable energy transformer market to new geographic highs by 2030.

Competitive Landscape
Global supply is moderately concentrated, with the top five manufacturers accounting for roughly 55% of deliveries, yet no single firm exceeds a 20% share. Hitachi Energy leads the large-power segments, leveraging its WindSTAR and HVDC portfolios; ABB follows in smart distribution and power electronics, having acquired Gamesa Electric’s assets in 2024. Siemens Energy rounds out the leading trio with broad EPC integration.
Capacity shortages have pushed incumbents to announce USD 1.5 billion-plus expansions across the United States, Europe, and India. These outlays target core-steel lamination lines, ester-fluid filling stations, and digital factory upgrades. Regional challengers respond via private-equity roll-ups; Central Moloney’s merger with Cam Tran created a continental distribution transformer specialist positioned to fill the North American demand gap.
Technology differentiation is sharpening. While incumbents scale solid-state prototypes, niche firms focus on sub-500 kVA DC microgrid transformers, sensor retrofits, and AI-driven health indices. Long-term supply contracts, sometimes spanning 8–10 years, lock in copper at hedged prices and guarantee delivery slots, underscoring how supply tension shapes competitive tactics in the renewable energy transformer market.
Renewable Energy Transformer Industry Leaders
ABB Ltd.
Siemens Energy AG
Hitachi Energy
Schneider Electric SE
General Electric Co.
- *Disclaimer: Major Players sorted in no particular order

Recent Industry Developments
- July 2025: Hitachi Energy, a global leader in electrification, has inked a deal valued at up to USD 700 million with EON. This collaboration aims to supply transformers to the German energy grid, enhancing the nation's energy security, resilience, and affordability.
- March 2025: Hitachi Energy pledged an additional USD 250 million to expand transformer plants in Virginia, Missouri, and Mississippi, hiring more than 100 staff to alleviate global shortages.
- January 2024: Hitachi Energy and Ørsted agreed on enhanced STATCOM technology for the 2.4 GW Hornsea 4 offshore wind project, marking Europe’s first application of the solution.
- September 2024: TECO Electric & Machinery acquired Shenchang Electric for New Taiwan dollars (NT$) 550 million to accelerate its entry into high-efficiency transformer markets.


Global Renewable Energy Transformer Market Report Scope
| Power Transformers |
| Distribution Transformers |
| Liquid-Immersed |
| Dry-Type |
| Conventional |
| Smart/Intelligent |
| Solid-State |
| Up to 5 MVA |
| 5 to 50 MVA |
| Above 50 MVA |
| Solar PV Plants |
| Wind Farms |
| Hydro Power Stations |
| Biomass and Geothermal |
| Power Utilities/T&D Operators |
| Independent Power Producers (IPPs) |
| Industrial and Commercial Micro-grids |
| North America | United States |
| Canada | |
| Mexico | |
| Europe | Germany |
| United Kingdom | |
| France | |
| Italy | |
| NORDIC Countries | |
| Russia | |
| Rest of Europe | |
| Asia-Pacific | China |
| India | |
| Japan | |
| South Korea | |
| ASEAN Countries | |
| Rest of Asia-Pacific | |
| South America | Brazil |
| Argentina | |
| Rest of South America | |
| Middle East and Africa | Saudi Arabia |
| United Arab Emirates | |
| South Africa | |
| Egypt | |
| Rest of Middle East and Africa |
| By Type | Power Transformers | |
| Distribution Transformers | ||
| By Cooling Type | Liquid-Immersed | |
| Dry-Type | ||
| By Core Technology | Conventional | |
| Smart/Intelligent | ||
| Solid-State | ||
| By Power Rating (MVA) | Up to 5 MVA | |
| 5 to 50 MVA | ||
| Above 50 MVA | ||
| By Application | Solar PV Plants | |
| Wind Farms | ||
| Hydro Power Stations | ||
| Biomass and Geothermal | ||
| By End-User | Power Utilities/T&D Operators | |
| Independent Power Producers (IPPs) | ||
| Industrial and Commercial Micro-grids | ||
| By Geography | North America | United States |
| Canada | ||
| Mexico | ||
| Europe | Germany | |
| United Kingdom | ||
| France | ||
| Italy | ||
| NORDIC Countries | ||
| Russia | ||
| Rest of Europe | ||
| Asia-Pacific | China | |
| India | ||
| Japan | ||
| South Korea | ||
| ASEAN Countries | ||
| Rest of Asia-Pacific | ||
| South America | Brazil | |
| Argentina | ||
| Rest of South America | ||
| Middle East and Africa | Saudi Arabia | |
| United Arab Emirates | ||
| South Africa | ||
| Egypt | ||
| Rest of Middle East and Africa | ||


Key Questions Answered in the Report
How large is the renewable energy transformer market today?
The renewable energy transformer market size reached USD 15.70 billion in 2025 and is projected to hit USD 23.92 billion by 2030 at an 8.79% CAGR.
Which transformer type is most widely used in renewable projects?
Power transformers dominate with a 53.6% revenue share because utility-scale solar and wind farms require high-voltage step-up units for grid connection.
What technology trend is shaping next-generation transformer design?
Solid-state transformers, growing at 14.5% CAGR, integrate power electronics for superior efficiency, bidirectional flow, and grid-forming support.
Why are ester-fluid transformers gaining popularity?
Ester fluids are biodegradable and have higher flash points than mineral oil, meeting stricter fire-safety and environmental regulations in urban and offshore settings.
Which region offers the fastest market growth through 2030?
Asia-Pacific is expanding at 9.5% CAGR owing to China's record renewable build-out and India's 500 GW ambition.
What is driving transformer supply shortages?
Surging renewable installations, 40% price inflation since 2019, and limited core-steel capacity have stretched lead times on large units beyond 200 weeks.
Page last updated on:


