
Residential Solar Energy Market Size and Share
Market Overview
| Study Period | 2021 - 2031 |
|---|---|
| Market Volume (2026) | 0.53 Thousand gigawatt |
| Market Volume (2031) | 1.45 Thousand gigawatt |
| Growth Rate (2026 - 2031) | 22.47 % |
| Fastest Growing Market | Asia Pacific |
| Largest Market | Asia Pacific |
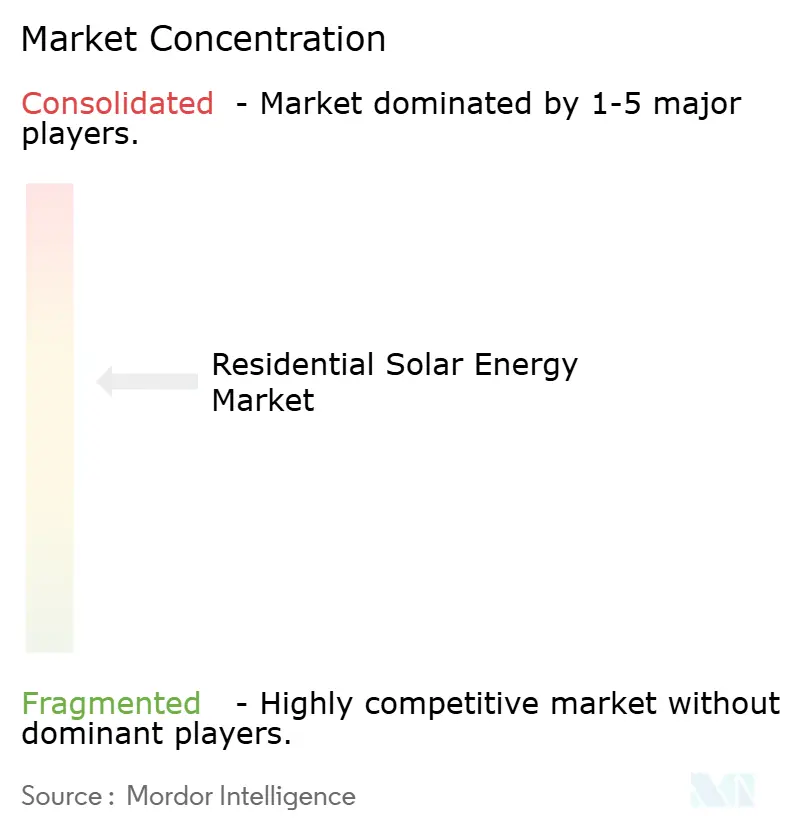
| Market Concentration | Medium |
Major Players *Disclaimer: Major Players sorted in no particular order Image © Mordor Intelligence. Reuse requires attribution under CC BY 4.0. | |
Residential Solar Energy Market Analysis by Mordor Intelligence
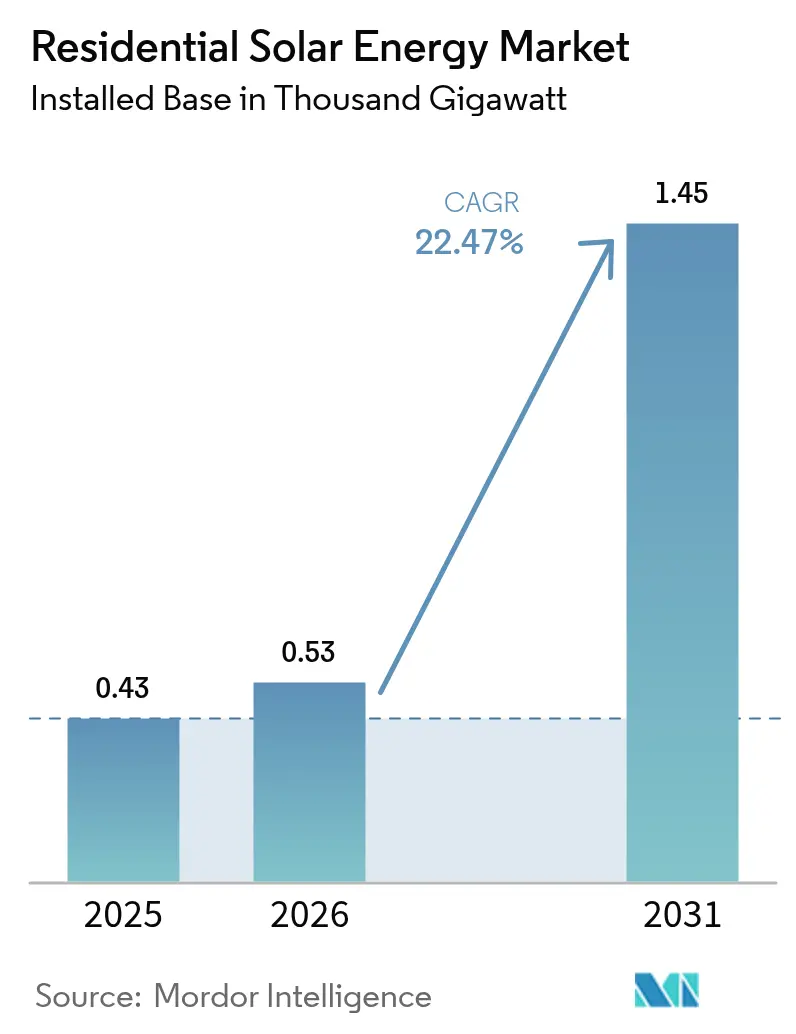
The Residential Solar Energy Market size was valued at 0.43 Thousand gigawatt in 2025 and estimated to grow from 0.53 Thousand gigawatt in 2026 to reach 1.45 Thousand gigawatt by 2031, at a CAGR of 22.47% during the forecast period (2026-2031).
Growth momentum is driven by declining technology costs, supportive policy incentives, and households seeking energy security. N-type TOPCon cells have reached laboratory efficiencies of 33.24%, making residential systems cost-competitive with retail electricity across many regions. Financing innovation, especially securitized solar loans, continues to lower capital costs, while smart-home ecosystems that bundle rooftop solar with storage and electric-vehicle (EV) charging broaden the addressable customer base. Although interest-rate spikes and policy uncertainty around tax credits create near-term headwinds, the fundamental economics of residential self-generation remain favorable, underpinning steady adoption of rooftop solar across all major markets.
Key Report Takeaways
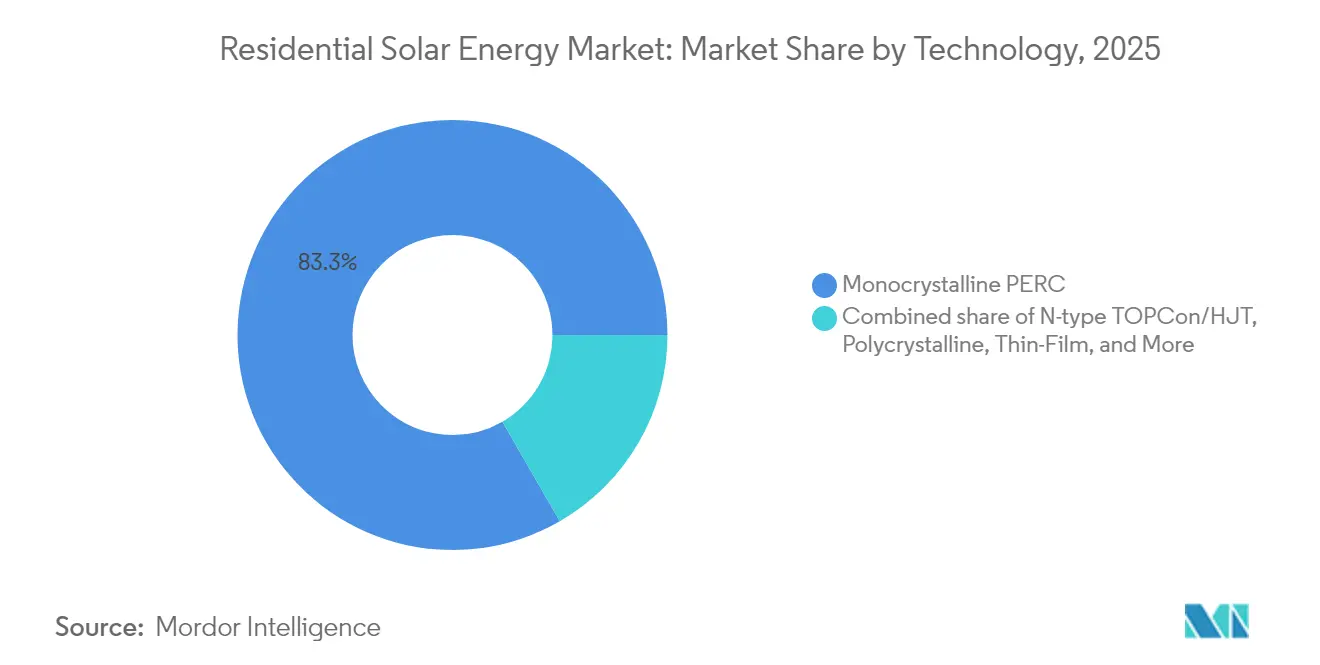
- By technology, monocrystalline PERC retained 83.32% of the residential solar energy market share in 2025; N-type TOPCon is poised for the fastest expansion at a 23.86% CAGR to 2031.
- By installation type, conventional rooftop arrays held 94.35% of the residential solar energy market size in 2025, while building-integrated solar roof tiles will advance at a 24.95% CAGR through 2031.
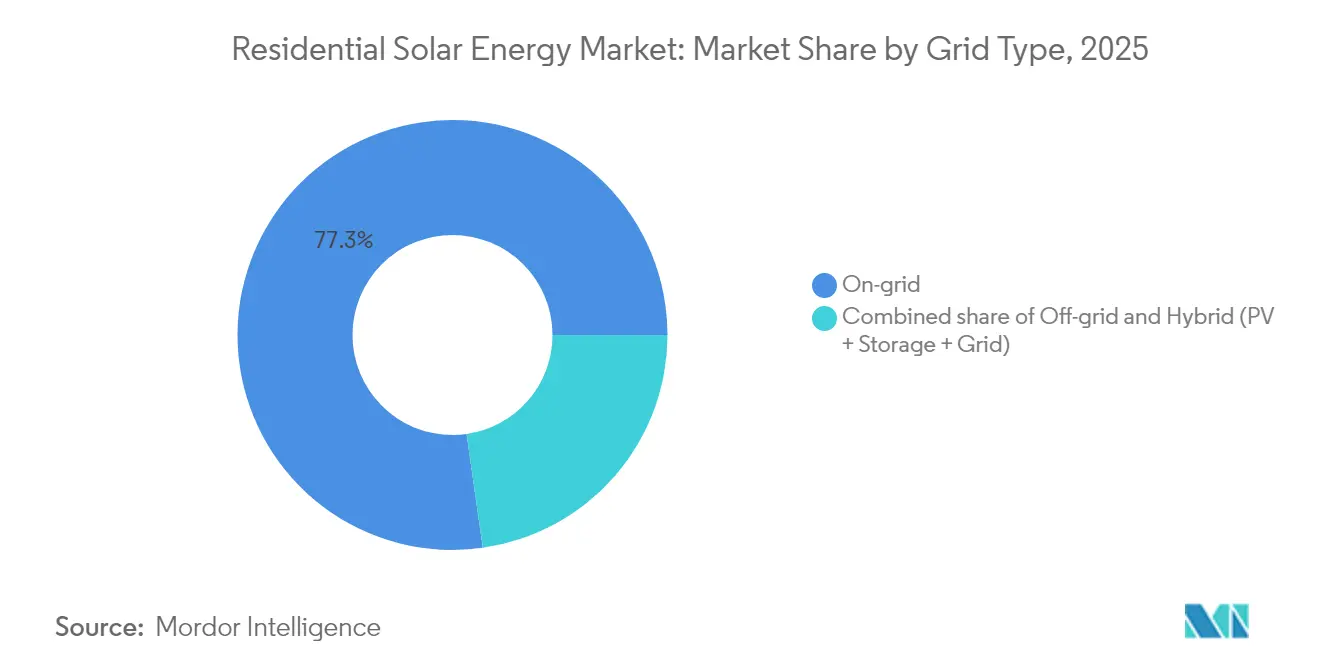
- By grid type, on-grid systems commanded 77.25% of the residential solar energy market share in 2025, whereas hybrid PV-plus-storage systems are forecast to climb at a 25.84% CAGR to 2031.
- By geography, North America led with 34.62% revenue share in 2025; Asia-Pacific is projected to log the fastest 28.65% CAGR through 2031.
- Sunrun, Tesla Energy, and three other top installers together accounted for 41.62% of the residential solar energy market size in 2025, reflecting a moderate level of consolidation.
Note: Market size and forecast figures in this report are generated using Mordor Intelligence’s proprietary estimation framework, updated with the latest available data and insights as of 2026.
Global Residential Solar Energy Market Trends and Insights
Drivers Impact Analysis*
| Driver | (~) % Impact on CAGR Forecast | Geographic Relevance | Impact Timeline |
|---|---|---|---|
| Declining module & BOS costs | 4.2% | Global | Long term (≥ 4 years) |
| Inflation Reduction Act-style incentive waves spreading beyond the US | 3.8% | North America & EU, spill-over to APAC | Medium term (2-4 years) |
| Spike in retail power prices & grid-outage anxiety | 3.1% | Global, with early gains in California, Texas, Germany | Short term (≤ 2 years) |
| EV-charger-ready home energy ecosystems | 2.9% | APAC core, spill-over to North America | Long term (≥ 4 years) |
| Maturing residential solar loan securitization platforms | 2.4% | North America core, expanding to Australia, UK | Medium term (2-4 years) |
| Peer-to-peer blockchain energy trading pilots | 1.1% | National, with early gains in Arizona, Austria, Japan | Long term (≥ 4 years) |
| Source: Mordor Intelligence | |||
Declining Module & BOS Costs
Module prices slid below USD 0.20 per W in 2024 and are tracking toward USD 0.15 per W by 2027, anchored by China’s ongoing factory expansions that unlock economies of scale. Coupled with 26.5% production efficiencies now possible in N-type TOPCon lines, higher-power modules shrink array footprints and reduce mounting hardware and labor needs. Inverter unit costs fell another 15% last year, while standardized wiring kits trimmed soft costs. The aggregate impact lowers the levelized cost of electricity beneath residential tariffs that apply to more than 60% of global households, turning rooftop solar from a premium add-on into a mainstream household appliance. Elevated efficiency also prolongs roof-space relevance, a critical advantage for urban homes with limited surface area. JinkoSolar’s 56 GW Shanxi facility underscores how large-scale manufacturing continues to compress prices.[1]PV Magazine, “JinkoSolar Breaks Ground on 56 GW Module Factory in Shanxi,” pv-magazine.com
IRA-Style Incentive Waves Spreading Beyond the US
The United States’ 30% federal investment tax credit catalyzed parallel programs worldwide. Europe’s REPowerEU earmarked EUR 210 billion for renewables, while Germany re-introduced feed-in tariffs and scrapped VAT on solar hardware to jump-start rooftop adoption. Japan now offers JPY 70,000 per kW for storage-paired arrays, and Australia’s Victoria Solar Homes rebate provides AUD 1,400 per household. Policymakers structure these incentives to phase down in tandem with falling equipment costs, borrowing the US blueprint of gradually converting subsidies into market-based economics. The synchronized policy wave accelerates installation volumes today and creates future headroom for unsubsidized growth once parity is achieved. As incentives spread, installers enter new regions with proven finance and supply-chain models, reinforcing scale benefits that feed back into cost decline.
Spike in Retail Power Prices & Grid-Outage Anxiety
Residential power tariffs have climbed 25% since 2022, exceeding USD 0.50 kWh in certain Californian time-of-use windows. High volatility, amplified by gas price swings and grid-upgrade surcharges, bolsters homeowner demand for cost control. Concurrently, weather-related outages—Texas’ 4.2 million customer black-out in 2024 and rolling brownouts in Germany—elevate the perceived value of self-generation with backup storage. Surveys show 73% of solar buyers rank energy security above payback period, marking a behavioral shift from purely economic drivers toward resilience planning. Net-metering reforms that reduce export credits further incentivize onsite consumption, nudging households to add batteries that smooth demand peaks. Collectively, pricing pain and outage fatigue prime the residential solar energy market for hybrid systems emphasizing self-sufficiency.
EV-Charger-Ready Home Energy Ecosystems
Residential solar arrays increasingly anchor integrated energy hubs that bundle bidirectional EV chargers, smart inverters, and batteries. Enphase’s acquisition of ClipperCreek fast-tracked its entry into bidirectional charging, while Tesla and Eaton collaborate on unified power management suites. Vehicle-to-home functionality lets EVs like Ford’s F-150 Lightning feed 131 kWh back to a house for multi-day backup, turning car batteries into grid-edge assets. Regulatory pilots in California reward such flexibility with frequency-regulation payments, adding a revenue layer atop bill savings. This convergence of transport and electricity widens the target market beyond traditional solar adopters to EV owners seeking holistic energy solutions, supporting longer-term demand for high-capacity rooftop systems and premium inverters.
Restraints Impact Analysis*
| Restraint | (~) % Impact on CAGR Forecast | Geographic Relevance | Impact Timeline |
|---|---|---|---|
| Volatile interest-rate environment inflating customer acquisition costs | -2.8% | Global, with acute impact in North America & EU | Short term (≤ 2 years) |
| Sudden net-metering policy roll-backs (e.g., CA NEM 3.0) | -2.1% | North America core, emerging in Australia, Germany | Medium term (2-4 years) |
| Installer labour & permitting bottlenecks in key metros | -1.9% | North America & EU, with acute shortages in California, Texas, Germany | Long term (≥ 4 years) |
| Polysilicon-supply ESG scrutiny limiting premium-segment demand | -1.4% | Global, with supply chain concentrated in China | Medium term (2-4 years) |
| Source: Mordor Intelligence | |||
Volatile Interest-Rate Environment Inflating Customer Acquisition Costs
Rapid monetary tightening lifted 30-year solar-loan coupons from 4.5% in 2022 to 7.8% in 2024, eroding the consumer value proposition for financed systems. Lenders responded by raising down-payment thresholds, tightening credit filters, lengthening sales cycles, and pushing customer acquisition costs up 35%. Market segments reliant on long-tenor loans, including many first-time buyers, deferred purchases, especially in regions where electricity tariffs are moderate. Larger installers secure lower rates via securitizations, but smaller contractors lack similar funding breadth, narrowing competitive diversity. Until rate volatility subsides, cash sales and leases regain temporary attractiveness, altering product mixes and stressing dealer working capital.
Sudden Net-Metering Policy Roll-Backs
California’s NEM 3.0 reduced export credits by 75%, extending payback periods from 7 years to beyond 12 years for export-heavy systems. Illinois adopted a similar stance in January 2025, and several Australian states signaled parallel reviews. Such abrupt revisions create planning uncertainty for installers, financiers, and component suppliers. Consumers react by coupling batteries to maximize self-consumption—California’s storage attachment rate jumped from 15% to 65% within 12 months. Yet higher upfront costs slow overall volume growth, undercutting economies of scale that keep equipment prices falling. Thus, Policy reversals drag the otherwise robust residential solar energy market trajectory.
*Our forecasts treat driver/restraint impacts as directional, not additive. The impact forecasts reflect baseline growth, mix effects, and variable interactions.
Segment Analysis
By Technology: N-Type Transition Accelerates Premium Adoption
Monocrystalline PERC modules dominated the residential solar energy market share with 83.32% in 2025, but N-type TOPCon shipments are forecast to post a 23.86% CAGR through 2031 as efficiency gains translate into higher roof-level energy density. This shift broadens the residential solar energy market size for premium-priced products that add generation without expanding the array footprint.
Manufacturers pivot to TOPCon to defend margins in an increasingly commoditized PERC landscape. Unit-cost convergence—helped by higher throughput and better wafer yields—allows TOPCon to approach PERC pricing while adding 1-2 percentage points of efficiency to shorten payback periods materially in space-constrained urban dwellings. JinkoSolar’s record 33.24% perovskite-tandem result underscores the pathway to future gains and solidifies TOPCon as the mainstream platform for next-generation cell architectures. While thin-film and polycrystalline alternatives persist in niche roles, TOPCon now anchors the premium tier and guides long-run R&D roadmaps for module makers.



By Installation Type: BIPV Emerges as Architectural Integration Driver
Rooftop-mounted arrays controlled 94.35% of the residential solar energy market size in 2025, yet building-integrated photovoltaics (BIPV) will expand at a 24.95% CAGR to 2031 as aesthetics and green-building mandates propel demand. New-home builders increasingly pre-install solar tiles that double as weatherproof roofing, sidestepping post-construction permitting and visual objections common in heritage districts.
Third-generation BIPV shingles now achieve cost parity with premium roofing plus panels, shifting the value conversation from payback to curb appeal and resale price. Municipalities that link occupancy permits to net-zero standards further accelerate BIPV uptake, especially where rooftop geometry limits conventional rack-mount angles. The architectural integration trend, therefore, enlarges the residential solar energy market by appealing to design-conscious homeowners previously reluctant to add visible panels.
By Grid Type: Hybrid Systems Capture Storage Value Premium
On-grid arrays still lead with 77.25% of the residential solar energy market share in 2025, but hybrid PV-plus-storage configurations are advancing at 25.84% CAGR as time-of-use tariffs reward load shifting. California’s NEM 3.0 slashed export rates, prompting a surge in battery attachments that re-aligned system economics around self-consumption.
Microinverter-battery packages delivered by Enphase and Tesla simplify installation, letting contractors commission a complete hybrid stack within a single site visit. Virtual power-plant enrollments add monetization channels by aggregating household batteries into grid-service fleets, generating revenue that trims payback by 1-2 years. The dual benefit of bill savings and resilience cements hybrid status as the preferred choice in policy environments where export compensation is under review, enlarging the residential solar energy market size for storage vendors and inverters.
Geography Analysis
North America retained 34.62% of the global residential solar energy market revenue in 2025, buoyed by sophisticated financing and mature installer networks. Last year, securing loan vehicles totaling over USD 3 billion signaled institutional faith in rooftop cash-flows. Even so, the pending elimination of the federal tax credit and spreading net-metering reforms create strategic urgency for households to install before incentives lapse, sustaining near-term volume despite policy uncertainty.
Asia-Pacific is projected to deliver the fastest 28.65% CAGR, expanding the regional residential solar energy market size through rapid urbanization, rising electricity tariffs, and proactive decarbonization goals. China capitalizes on domestic manufacturing dominance to deploy high-density arrays in tier-one cities, while India’s streamlined interconnection rules open residential segments previously hindered by bureaucracy. Japan emphasizes storage-paired rooftops to bolster earthquake resilience, subsidizing hybrid systems that promise backup power during grid interruptions.
Europe’s outlook remains resilient as REPowerEU funds cascade into member-state programs that remove VAT and fine-tune feed-in tariffs. Germany’s policy reset revived household demand, and Spain’s abundant irradiation pairs with regulatory stability to sustain installations. Nordic countries, facing winter irradiance dips, are early adopters of seasonal storage solutions. Across the bloc, traceability mandates elevate suppliers able to verify non-Xinjiang polysilicon sourcing, shaping procurement decisions and nudging the residential solar energy industry toward diversified supply chains.


Regulatory Landscape
Policy frameworks for residential solar are shifting from net-metering toward self-consumption and grid-flexibility requirements, which in turn affects system design and economics across major markets. In the European Union, the Energy Performance of Buildings Directive introduces a solar-in-buildings mandate for new buildings where the permit application is made after 29 May 2026, raising the relevance of solar-ready design and building-integrated configurations for new housing.
Permitting and interconnection are also being targeted to reduce soft costs and speed up deployment for smaller systems. The European Commission issued Recommendation (EU) 2026/1007 on 30 April 2026, calling on local authorities to remove permit-granting procedures for small-scale PV (up to 800 W) and plug-in batteries, signaling a regulatory push to simplify microgeneration uptake. At the same time, several markets are moving away from full retail export compensation, including Italy closing Scambio sul Posto in 2025 and the Netherlands planning to end full retail-rate saldering in 2027, which increases the need for smart inverters, storage pairing, and updated grid-code compliance as distributed penetration rises.
Competitive Landscape
Market share is consolidating around a handful of scale players integrating installation, finance, and after-sales service. Sunrun, Tesla Energy, Enphase-backed installers, and two regional specialists captured 42% of 2024 installations. Vertical integration affords them bulk purchasing, lower borrowing costs, and strong brand recognition, enabling sub-USD3 W turnkey pricing in core markets. Sunrun’s USD 1.6 billion dual securitizations exemplify the capital leverage available at scale, while SunPower’s bankruptcy and takeover by Complete Solar underline the margin pressure faced by mid-tier players.[3]Solar Power World, “First Solar Sues JinkoSolar Over TOPCon Patents,” solarpowerworldonline.com
Technology leadership is an emerging battleground. Patent litigation—such as First Solar’s infringement claims against JinkoSolar over TOPCon—highlights the strategic weight of intellectual property in an arena where module commoditization squeezes margins. Installers differentiate with integrated software that optimizes generation, storage, and EV charging, tilting competition toward holistic energy-as-a-service propositions rather than stand-alone panel sales.
Regional challengers harness local knowledge and nimble operations to win in secondary markets, often focusing on rural customers or community microgrids overlooked by national brands. Digital-first newcomers apply predictive analytics to shorten site assessments and automate permitting, trimming soft costs. While no single company dominates outright, the barriers to entry are rising as scale, technology, and financing become intertwined in capturing the growing residential solar energy market.
Residential Solar Energy Industry Leaders
Sunrun Inc.
Tesla Energy
Enphase Energy
SunPower Corporation
SolarEdge Technologies
- *Disclaimer: Major Players sorted in no particular order

Market Opportunities and Future Outlook
Residential solar value is expanding beyond bill savings into resilience and grid-services participation, which creates whitespace for bundled PV-plus-storage offerings, smart inverters, and software-led energy management. In the United States, solar-plus-storage attachment reached 45% in Q1 2026, supporting product stacks that optimize self-consumption as export compensation changes and that can connect into virtual power plants (VPPs). The June 2026 Sunrun, Tesla, and Renew Home announcement for a 16.8 GW VPP program, aggregating flexible capacity across up to 9 million homes, also shows how installer and device ecosystems are being used to monetize dispatchable capacity in parallel with onsite consumption.
Channel and go-to-market opportunities are widening as manufacturers move closer to the homebuilder and installer workflow to reduce soft costs and installation complexity. In March 2026, Qcells launched its Qcells New Homes division to supply solar and storage directly to homebuilders, aligning with demand for pre-integrated packages in new construction and renovation cycles. Where labor and permitting bottlenecks persist, hardware modularity and faster commissioning are becoming differentiators, and SolarEdge opened nationwide US orders in July 2026 for its Nexis residential solar and storage platform built around modular components to support shorter installation times and more standardized residential deployments.
Recent Industry Developments
- July 2026: Sunrun expanded its California distributed power plant to 425 megawatts of peak dispatchable capacity, covering more than 80,000 households. The expanded fleet operates under contracts with Pacific Gas and Electric Company and Southern California Edison, strengthening the role of residential solar-plus-storage as a contracted grid reliability resource.
- June 2026: Sunrun, Renew Home, and Tesla announced an agreement to aggregate distributed energy resources to deliver more than 16 gigawatts of fast, flexible power for large loads and utilities. The collaboration scales virtual power plant procurement to a multi-gigawatt level, reinforcing storage attachment and software orchestration as central levers in residential solar monetization.
- July 2025: Sunrun and Tesla launched an integrated home energy plan in Texas that links Sunrun Flex customers with Tesla Electric rates and Powerwall virtual power plant functionality. The offering ties retail electricity pricing to behind-the-meter assets, supporting differentiated customer propositions as financing conditions and net-metering terms change.


Research Methodology Framework and Report Scope
Market Definition and Coverage
For this study, the residential solar energy market covers solar electricity systems installed at households, counted as installed capacity additions and the resulting installed base, tracked in gigawatts.
Scope exclusions: Utility scale solar plants and commercial or industrial rooftop systems are excluded from this market sizing.
Segmentation Overview
- By Technology
- Monocrystalline PERC
- N-type TOPCon/HJT
- Polycrystalline
- Thin-film (CdTe, CIGS)
- Emerging Perovskite Tandems
- By Installation Type
- Rooftop-mounted PV
- Building-integrated solar roof tiles
- By Grid Type
- On-grid
- Off-grid
- Hybrid (PV + Storage + Grid)
- By Geography
- North America
- United States
- Canada
- Mexico
- Europe
- United Kingdom
- Germany
- France
- Spain
- Nordic Countries
- Russia
- Rest of Europe
- Asia-Pacific
- China
- India
- Japan
- South Korea
- Malaysia
- Thailand
- Indonesia
- Vietnam
- Australia
- Rest of Asia-Pacific
- South America
- Brazil
- Argentina
- Colombia
- Rest of South America
- Middle East and Africa
- United Arab Emirates
- Saudi Arabia
- South Africa
- Egypt
- Rest of Middle East and Africa
- North America
Data Sources, Market Sizing, and Validation
Desk Research
Desk research was used to set the fact base on installation pace, where residential solar is expanding, and what is driving adoption. We typically lean on public energy and power statistics such as IEA PVPS releases, IRENA capacity datasets, the US EIA, Eurostat, and national energy regulators that publish grid connection updates and distributed generation reporting.
To cross-check the demand side, we also use utility net metering and interconnection summaries, customs or trade statistics for solar modules and inverters, and peer-reviewed journals that track technology shifts like TOPCon and HJT. Company filings, investor presentations, and reputable press help us understand pricing direction and policy timelines, and then a paid subscription for company financials and news is used to validate revenue ranges and event timing. The sources named above are illustrative only and not exhaustive, and additional public references were used to collect data, validate assumptions, and clarify open questions.
Primary Interviews and Surveys
Primary interviews and surveys were run to pressure-test the desk findings against what is occurring in the residential installation pipeline, with particular attention to permitting lead times, interconnection friction, and consumer payback expectations. We spoke with participants across the residential value chain, including equipment suppliers, installers and EPCs, financiers, and policy and grid stakeholders, with coverage across major solar-adopting regions so regional differences in policy and pricing were reflected in the model.
Distribution of primary research fieldwork respondents
| Company type | Respondent position | Region |
|---|---|---|
| Top tier: 31% | CXOs: 13% | APAC: 41% |
| Mid tier: 47% | Functional/Unit leaders: 39% | EMEA: 32% |
| Smaller Players: 22% | Managers: 48% | Americas: 27% |
Market-Sizing & Forecasting
Sizing starts with a top-down build where national and regional residential solar installed capacity series are reconstructed using published capacity additions, grid connection signals, and distributed generation reporting, then normalized into a consistent GW basis. Once the total is shaped, we run selective bottom-up checks to keep the totals realistic. This includes sampling installer volumes in key countries, applying typical system sizes, and validating implied equipment availability trends.
A few practical inputs help the model stay tied to real adoption patterns, including residential electricity prices, policy support (net metering rules, tax credits, and rebates), rooftop suitability and household counts, typical residential system size ranges, and interconnection and permitting lead times. Where public data is missing or lagged, gaps are handled by short bridging estimates based on nearby periods, policy timing, and interview-backed adoption ramps, then corrected when updated statistics become available.
For the forecast, we rely mainly on scenario analysis supported by expert consensus on policy continuity, rate trends, and supply availability, and then we sanity-check the trajectory against historical adoption curves. The final output is a repeatable model that can be updated when new national capacity releases or policy changes are announced.
Data Validation & Update Cycle
Validation is done through triangulation across independent signals, followed by focused variance checks at the country and regional level so unusual spikes are explained before totals are finalized. If the implied adoption rate, typical system size, or policy timing produces an outlier trend, we re-check the underlying source series and, when needed, re-contact primary respondents for clarification.
Each report goes through multi-step internal review, where assumptions, conversions, and time series joins are checked and then reconciled to the narrative drivers. Reports are refreshed annually, with interim updates when material events occur, including major policy reversals, sharp component price changes, or large demand shocks, and a final pre-delivery sweep is completed so clients receive the latest view.
Mordor Intelligence's Residential Solar Energy Market Estimate Compared With Other Published Estimates
It is common to see different market sizes for residential solar because authors do not always measure the same thing, even when the title looks similar. The biggest differences usually come from the chosen unit of measure, what is counted as residential, and whether the estimate tracks installations, revenue, or a wider equipment and services spend.
By tracking installed residential capacity time series and refreshing region-level average system size assumptions, Mordor Intelligence keeps the output anchored to deployment volume in GW. This will not line up with USD totals that bundle hardware, installation services, and financing-related spend.
Benchmark comparison
| Source | Market Size | Gaps in Research Methodology |
|---|---|---|
| Mordor Intelligence | USD 0.43 T (2025) | |
| Global Consultancy A | USD 104.05 B (2025) | Uses a revenue-based definition for residential solar PV that can bundle modules, inverters, installation services, and sometimes retrofit activity, so the output is not directly comparable to a capacity-based measure. |
| Trade Journal B | USD 94.20 B (2024) | Reports a value estimate anchored to a 2024 pricing snapshot and broader system spend, which can swing with module ASP changes and financing mix, even if installed GW grows steadily. |
The spread in the table is mainly explained by unit choice and what gets counted inside the market definition, rather than a disagreement that residential solar is expanding. When the scope is kept tied to household installations and then cross-checked with adoption signals, the resulting number is easier to reconcile year to year and to update when new installation data is released.


Key Questions Answered in the Report
What is the expected growth rate of the residential solar energy market to 2031?
The residential solar energy market is forecast to expand from 526.62 GW in 2026 to 1,450.68 GW in 2031, reflecting a 22.47% CAGR.
Which region leads the residential solar energy market?
North America held the largest 34.62% share in 2025, driven by mature financing structures and state-level incentives.
Why is N-type TOPCon technology gaining traction?
TOPCon offers 1-2 percentage-points higher efficiency than PERC at near-parity manufacturing cost, shortening payback times for space-constrained rooftops.
How will eliminating the US federal tax credit affect adoption?
Short-term demand is expected to spike as homeowners rush to complete projects before the credit sunsets, followed by a moderate slowdown as incentives phase out.
What role do batteries play in future rooftop systems?
Hybrid PV-plus-storage configurations are forecast to grow at 25.84% CAGR because they maximize self-consumption amid declining net-metering rates and enhance energy security during outages.
Are building-integrated solar tiles cost-competitive with traditional panels?
In premium housing segments, third-generation BIPV tiles now price on par with high-end roofing plus separate solar arrays, making aesthetics-driven adoption viable.
Page last updated on:





