Commercial Distributed Energy Generation Market Size and Share
Market Overview
| Study Period | 2021 - 2031 |
|---|---|
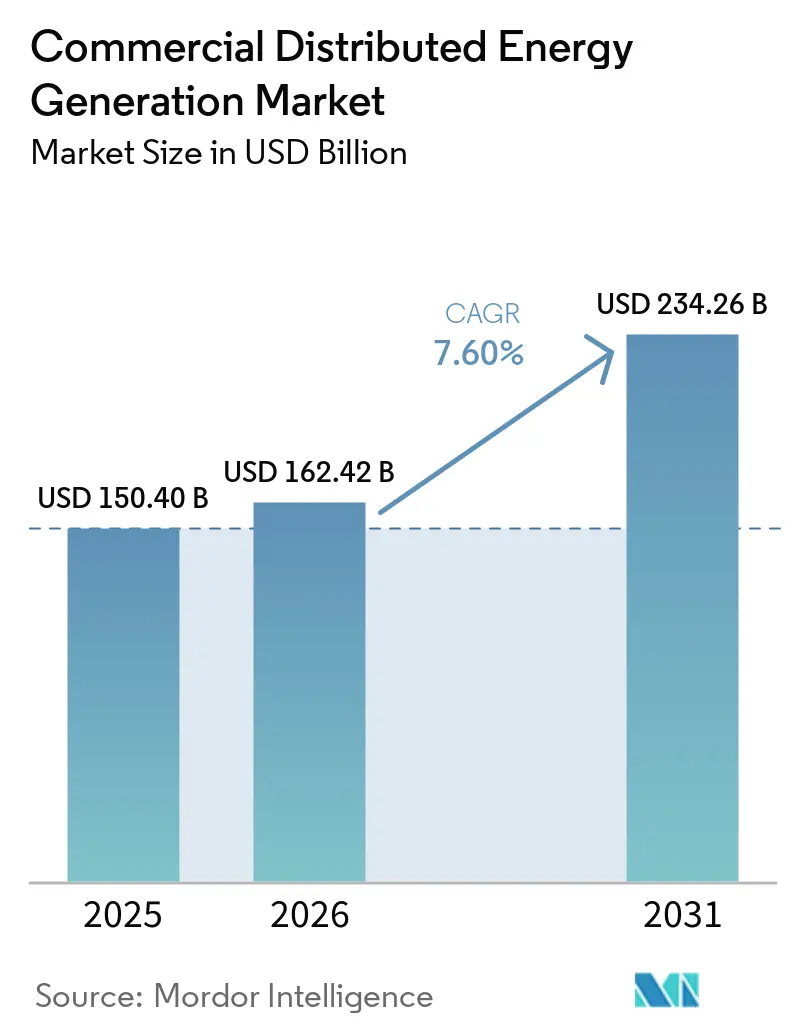
| Market Size (2026) | USD 162.42 Billion |
| Market Size (2031) | USD 234.26 Billion |
| Growth Rate (2026 - 2031) | 7.60% CAGR |
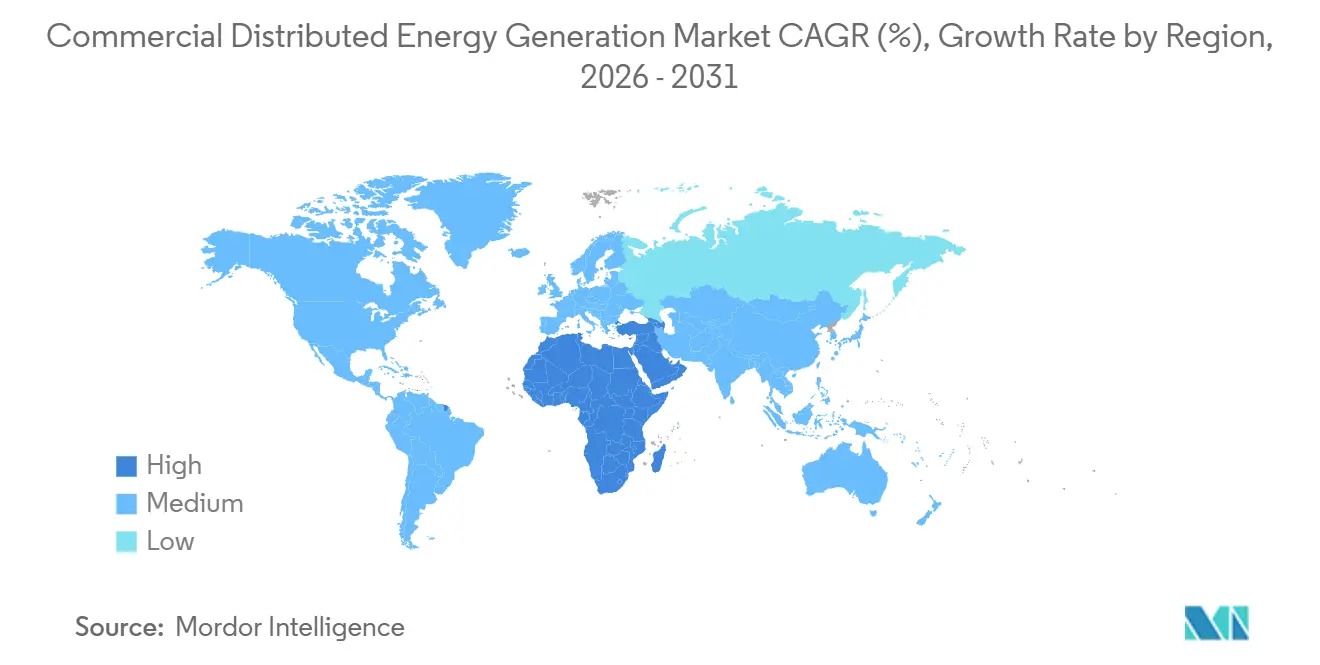
| Fastest Growing Market | Middle East and Africa |
| Largest Market | Asia Pacific |
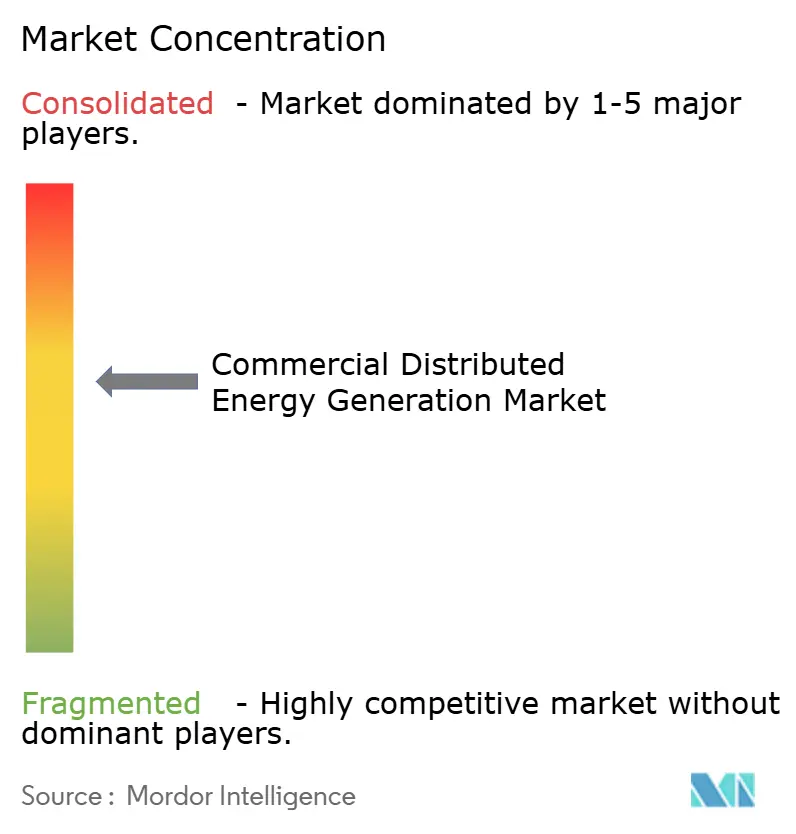
| Market Concentration | Medium |
Major Players *Disclaimer: Major Players sorted in no particular order Image © Mordor Intelligence. Reuse requires attribution under CC BY 4.0. | |
Commercial Distributed Energy Generation Market Analysis by Mordor Intelligence
The Commercial Distributed Energy Generation Market size was valued at USD 150.40 billion in 2025 and is estimated to grow from USD 162.42 billion in 2026 to reach USD 234.26 billion by 2031, at a CAGR of 7.60% during the forecast period (2026-2031). Soaring electricity demand from data-heavy operations, grid-capacity bottlenecks in mature economies, and favorable open-access reforms across developing regions are reshaping how commercial facilities procure power. Declining solar module and lithium-ion battery prices continue to pull levelized costs below retail tariffs in more than twenty U.S. states, while hydrogen-ready fuel cells keep a foothold where continuous heat and power are valued. Adoption is no longer purely a sustainability statement; it is becoming a hedge against wholesale price volatility and outage-related revenue losses. Digital controls that monetize batteries through real-time market participation further tighten payback periods, attracting institutional capital into the commercial distributed energy generation market.[1] U.S. Department of Energy, “Hydrogen Program Plan 2025,” energy.gov
Key Report Takeaways
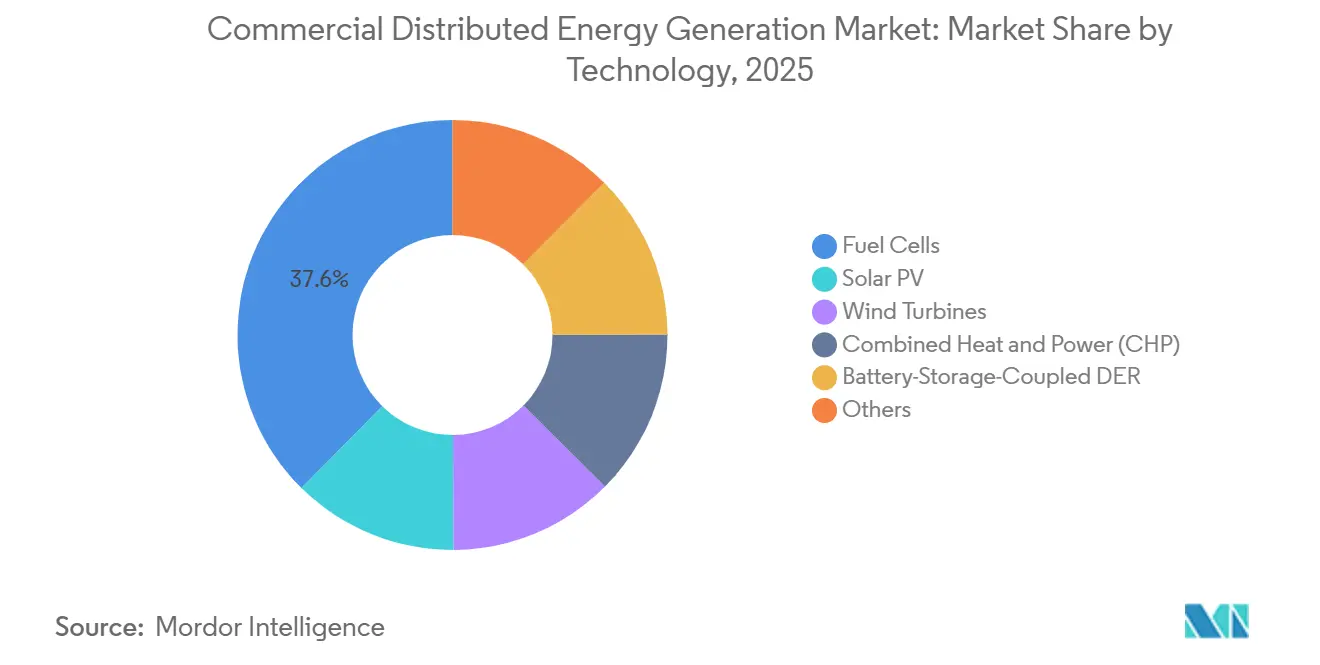
- By technology, fuel cells led with 37.6% of the commercial distributed energy generation market share in 2025, while solar PV is forecast to expand at a 14.4% CAGR through 2031.
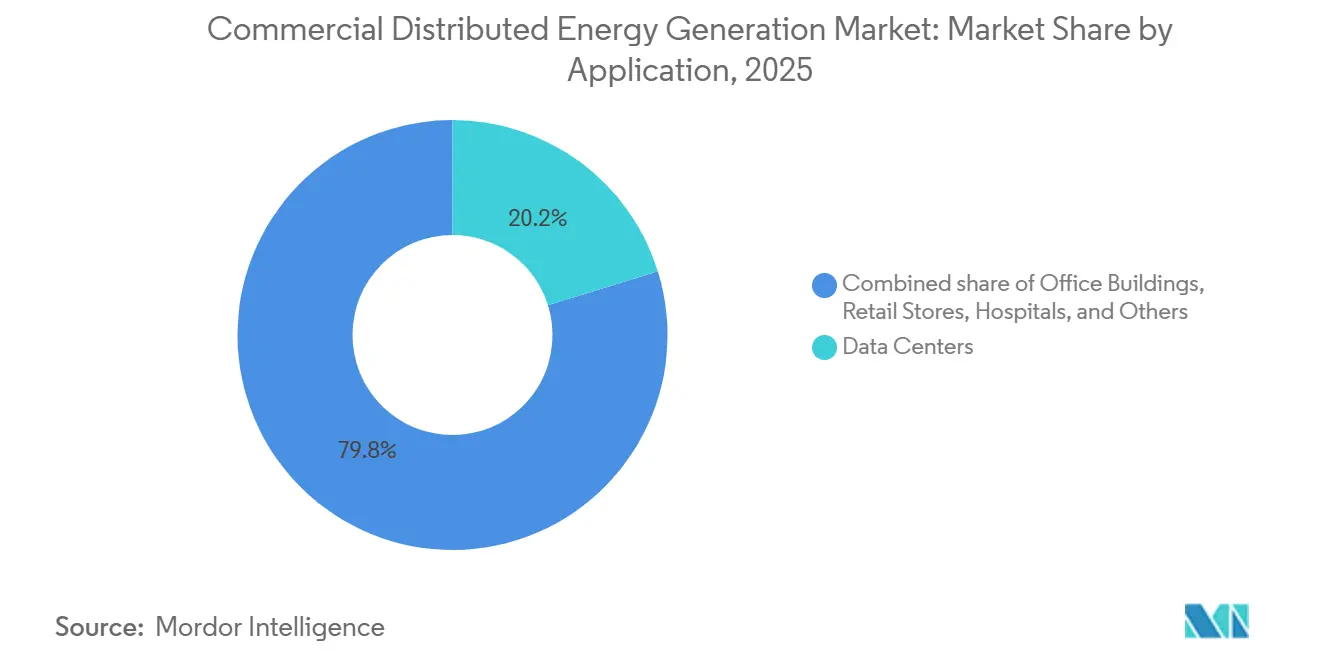
- By application, data centers captured 20.2% share of the commercial distributed energy generation market size in 2025 and warehouses and logistics centers are advancing at a 15.6% CAGR through 2031.
- By geography, Asia-Pacific held 45.3% of 2025 revenue, whereas the Middle East and Africa are poised for a 13.1% CAGR to 2031.
Note: Market size and forecast figures in this report are generated using Mordor Intelligence’s proprietary estimation framework, updated with the latest available data and insights as of January 2026.
Global Commercial Distributed Energy Generation Market Trends and Insights
Drivers Impact Analysis*
| Driver | (~) % Impact on CAGR Forecast | Geographic Relevance | Impact Timeline |
|---|---|---|---|
| Declining LCOE of Solar PV & Wind | +2.1% | Global, with strongest impact in APAC and Middle East | Medium term (2-4 years) |
| Corporate renewable PPAs & net-zero targets | +1.8% | North America & EU core, expanding to APAC | Long term (≥ 4 years) |
| Extension of net-metering & ITC-type incentives | +1.3% | North America (US state-level), EU (feed-in remnants), select ASEAN | Short term (≤ 2 years) |
| Resilience demand amid rising grid outage risks | +1.2% | North America (wildfire/storm zones), APAC (typhoon corridors), Sub-Saharan Africa | Medium term (2-4 years) |
| AI-enabled DER orchestration platforms | +0.7% | North America, EU, Australia (ISO/market operator regions) | Long term (≥ 4 years) |
| Hydrogen-ready micro-cogeneration with fuel cells | +0.5% | EU (hydrogen hubs), Japan, South Korea, select US industrial corridors | Long term (≥ 4 years) |
| Source: Mordor Intelligence | |||
Declining LCOE of Solar PV & Wind
Utility-scale solar reached USD 29 per MWh in 2025, and commercial rooftop systems now deliver USD 50-70 per MWh in high-insolation zones, undercutting retail tariffs in 23 U.S. states. Chinese polysilicon oversupply pushed spot module prices below USD 0.10 per watt, while rapid-shutdown electronics trimmed installation labor by 30%. Companies, therefore, face a choice between fixed-rate PPAs and self-financed arrays with four-to-six-year paybacks. The fall in costs explains why solar is the fastest-growing slice of the commercial distributed energy generation market.
Corporate Renewable PPAs & Net-Zero Targets
Cumulative corporate renewable PPAs reached 50 GW worldwide by end-2025, 60% of which originated in North America and Europe. Portfolio-scale deals such as Google’s 1 GW contract with TotalEnergies and Microsoft’s 10.5 GW partnership with Brookfield bundle multiple technologies and oblige developers to add two-to-four-hour batteries. Because the obligation to deliver round-the-clock clean power shifts intermittency risk away from the buyer, PPAs accelerate project bankability and drive deeper penetration of distributed assets on commercial sites.
Extension of Net-Metering & ITC-Type Incentives
Forty-one U.S. states still compensate exports through net metering, but policy durability is uneven. Illinois prolonged its Adjustable Block Program to 2030, whereas California’s NEM 3.0 cut export credits by 75%.[2]California Public Utilities Commission, “NEM 3.0 Decision 23-02-005,” cpuc.ca.gov Federal Section 48E credits remain at 30% but phase out unless projects start construction by July 2026. The looming sunset has front-loaded installation pipelines and provided a short-term lift to the commercial distributed energy generation market.
Resilience Demand Amid Rising Grid Outage Risks
NERC reported a 25% rise in U.S. customer outage hours between 2020 and 2025, mainly in wildfire and storm corridors.[3]North American Electric Reliability Corporation, “2026 Reliability Risk Report,” nerc.com Hospitals, data centers, and cold-storage operators are therefore adding on-site solar, batteries, and fuel cells to sustain critical loads for multi-day events. A California children’s hospital reached 80% self-sufficiency in 2025 after installing a hybrid microgrid backed by USD 13 million in tax credits, illustrating how resilience premiums justify capex even when pure cost savings are thin.
Restraints Impact Analysis*
| Restraint | (~) % Impact on CAGR Forecast | Geographic Relevance | Impact Timeline |
|---|---|---|---|
| High upfront CAPEX & long payback period | -1.4% | Global, most acute in emerging markets with limited third-party financing | Medium term (2-4 years) |
| Evolving interconnection & tariff complexity | -0.9% | North America (queue backlogs), EU (hosting-capacity limits), India (state-level variability) | Short term (≤ 2 years) |
| Distribution-grid hosting-capacity saturation | -0.6% | California, Germany, Australia (high-penetration zones) | Medium term (2-4 years) |
| ESG traceability scrutiny for PV & wind supply chains | -0.5% | North America & EU (Uyghur Forced Labor Prevention Act, EU supply-chain due diligence) | Short term (≤ 2 years) |
| Source: Mordor Intelligence | |||
High Upfront CAPEX & Long Payback Period
Commercial solar still costs USD 1.57 per watt in the United States, and fuel-cell CHP reaches USD 6.00 per watt, translating to multi-million-dollar investments that small businesses rarely self-finance. Energy-as-a-service contracts remove capital barriers but exclude customers lacking investment-grade credit, leaving 60% of potential offtakers unserved.
Distribution-Grid Hosting-Capacity Saturation
Feeder circuits in Bavaria, Andalusia, and parts of California have little remaining capacity for new rooftop arrays. Developers, therefore, must fund voltage-regulation gear or accept curtailment, eroding the arbitrage between self-generation and retail power.[4]Electric Power Research Institute, “Distribution Feeder Hosting Capacity in High-DER Circuits,” epri.com
*Our forecasts treat driver/restraint impacts as directional, not additive. The impact forecasts reflect baseline growth, mix effects, and variable interactions.
Segment Analysis
By Technology: Fuel Cells Anchor Baseload, Solar PV Captures Growth
Fuel cells captured 37.6% of the commercial distributed energy generation market share in 2025, reflecting their value in hospitals, data centers, and industrial sites that need uninterrupted heat and power. Bloom Energy deployed more than 100 MW at Equinix facilities and lined up a 900 MW hydrogen-ready contract in Wyoming, moves that underpin its leadership. The solar segment is scaling faster, expanding at a 14.4% CAGR to 2031 as module prices dip below USD 0.10 per watt. Coupling rooftop PV with two-to-four-hour batteries slashes dependence on grid imports during evening peaks and trims demand charges, hastening payback to five to six years.
Wind turbines remain niche because zoning rules restrict 100-500 kW machines to industrial campuses with generous setbacks, while microturbine and reciprocating-engine hybrids continue to dominate off-grid mining and agribusiness use cases. Battery prices falling to USD 120 per kWh in 2025 spur adoption of one-to-two-hour storage as an add-on rather than a standalone system, reinforcing solar’s position as the default growth engine in the commercial distributed energy generation market context. In parallel, hydrogen-blended CHP offers a pathway to deep decarbonization without sacrificing dispatchability, a feature that could preserve fuel-cell relevance during the forecast period.


By Application: Data Centers Lead Share, Warehouses Post Fastest Growth
Data centers held 20.2% of the commercial distributed energy generation market size in 2025 because hyperscale operators bypass multi-year utility interconnection queues by installing on-site power. Bloom Energy’s January 2026 report indicates one-third of data hubs plan to operate entirely on site-generated electricity by 2030. Texas is set to host 30% of U.S. data-center capacity by 2028, thanks to deregulated power markets, while constrained states like California lose share.
Warehouses and logistics centers are expanding at a 15.6% CAGR to 2031, driven by electrified last-mile fleets that demand multi-megawatt chargers and expansive rooftops capable of supporting three-to-five-megawatt solar arrays. Cold-storage operator Arctic Cold saved USD 850,000 in the first year after energizing a 3.3 MW array in California, an example that is prompting national rollout across the sector. Hospitals, educational campuses, airports, and office properties follow at a slower clip, largely because payback economics are weaker or landlord-tenant incentives misalign.
Geography Analysis
Asia-Pacific dominated with 45.3% revenue in 2025. China alone installed 18 GW of commercial rooftop solar in 2025 and mandates 20-30% on-site renewables within new industrial parks. India’s open-access reforms let corporations bypass distribution companies and have propelled the commercial distributed energy generation market in the country to 35% annual growth during 2025. ASEAN economies are filling a USD 16 billion financing gap with local banks and development finance institutions to unlock rooftop potential.
The Middle East and Africa are forecast to grow at 13.1% CAGR to 2031, the fastest worldwide. Gulf states deploy solar-plus-storage to free natural gas for export, while South Africa, Kenya, and Nigeria rely on diesel-solar hybrids to maintain uptime amid grids that serve industry less than 60% of the time.
North America retained a significant share of the commercial distributed energy generation market in 2025, but interconnection queues stretching up to three years and the scheduled sunset of federal tax credits after 2027 weigh on momentum. Europe’s saturation of low-voltage feeders in Germany and Spain forces costly grid upgrades. South America remains nascent outside Brazil and Chile, though Argentina’s liberalizing reforms in 2025 could accelerate adoption after 2027.

Competitive Landscape
The commercial distributed energy generation market is moderately consolidated. Traditional equipment suppliers such as Siemens, Schneider Electric, ABB, and General Electric are shifting from one-off hardware sales toward long-term energy-as-a-service agreements. Enel X, Aggreko, and Veolia already operate customer-site assets for 15-to-20 years, converting capital expenditure into predictable service fees.
Fuel-cell leaders Bloom Energy and Cummins defend their share by making systems hydrogen-ready, while Caterpillar pilots 2 MW hydrogen microturbines in Germany. Tesla Energy and Generac use vertically integrated inverters, batteries, and software platforms to offer turnkey microgrid packages that island seamlessly during outages, a value proposition resonating with hospitals and logistics hubs.
Aggregation remains underdeveloped. AutoGrid, Stem, and ABB’s newly acquired DERMS platform vie to bundle thousands of behind-the-meter resources into virtual power plants capable of bidding capacity and frequency regulation in CAISO, ERCOT, and the Australian NEM. Mergers and acquisitions among regional developers and software specialists are expected as scale and digital competencies increasingly determine competitiveness.
Commercial Distributed Energy Generation Industry Leaders
Siemens AG
Schneider Electric
General Electric (GE Vernova)
Caterpillar Inc.
Bloom Energy
- *Disclaimer: Major Players sorted in no particular order

Recent Industry Developments
- July 2025: The Federal Energy Regulatory Commission approved Constellation Energy’s USD 16.4 billion acquisition of Calpine, creating the largest competitive power supplier in the United States with expanded distributed-generation capabilities
- July 2025: PG&E signed a 1.8 gigawatt-hour long-duration energy-storage contract, the state’s largest, underscoring the growing convergence of storage with distributed projects
- July 2025: GE Vernova acquired France’s Alteia to bolster AI-driven grid-optimization tools for commercial distributed resources
- July 2025: LS Power completed acquisition of bp’s U.S. onshore wind business, adding operating and development assets that target commercial off-takers


Global Commercial Distributed Energy Generation Market Report Scope
Commercial Distributed Energy Generation (CDG) encompasses small-scale, decentralized electricity production, like rooftop solar panels, wind turbines, or fuel cells, situated close to commercial, industrial, or institutional facilities. By harnessing these systems, businesses can produce their own energy, diminishing their dependence on the grid, cutting energy expenses, and enhancing reliability.
The commercial distributed energy generation market is segmented by technology, application, and geography. By technology, the market is segmented into solar PV, wind turbines, fuel cells, combined heat and power, battery-storage-coupled DER, and others. By application, the market is segmented into office buildings, retail stores, data centers, educational institutions, hospitals, airports and transport hubs, and others. Market forecasts are provided in value (USD).
| Solar PV |
| Wind Turbines |
| Fuel Cells |
| Combined Heat and Power (CHP) |
| Battery-Storage-Coupled DER |
| Others |
| Office Buildings |
| Retail Stores |
| Data Centers |
| Educational Institutions |
| Hospitals |
| Warehouses and Logistics Centres |
| Airports and Transport Hubs |
| Others (incl campuses, hotels) |
| North America | United States |
| Canada | |
| Mexico | |
| Europe | United Kingdom |
| Germany | |
| France | |
| Spain | |
| Nordic Countries | |
| Russia | |
| Rest of Europe | |
| Asia-Pacific | China |
| India | |
| Japan | |
| South Korea | |
| ASEAN Countries | |
| Australia and New Zealand | |
| Rest of Asia-Pacific | |
| South America | Brazil |
| Argentina | |
| Colombia | |
| Rest of South America | |
| Middle East and Africa | United Arab Emirates |
| Saudi Arabia | |
| South Africa | |
| Egypt | |
| Rest of Middle East and Africa |
| By Technology | Solar PV | |
| Wind Turbines | ||
| Fuel Cells | ||
| Combined Heat and Power (CHP) | ||
| Battery-Storage-Coupled DER | ||
| Others | ||
| By Application | Office Buildings | |
| Retail Stores | ||
| Data Centers | ||
| Educational Institutions | ||
| Hospitals | ||
| Warehouses and Logistics Centres | ||
| Airports and Transport Hubs | ||
| Others (incl campuses, hotels) | ||
| By Geography | North America | United States |
| Canada | ||
| Mexico | ||
| Europe | United Kingdom | |
| Germany | ||
| France | ||
| Spain | ||
| Nordic Countries | ||
| Russia | ||
| Rest of Europe | ||
| Asia-Pacific | China | |
| India | ||
| Japan | ||
| South Korea | ||
| ASEAN Countries | ||
| Australia and New Zealand | ||
| Rest of Asia-Pacific | ||
| South America | Brazil | |
| Argentina | ||
| Colombia | ||
| Rest of South America | ||
| Middle East and Africa | United Arab Emirates | |
| Saudi Arabia | ||
| South Africa | ||
| Egypt | ||
| Rest of Middle East and Africa | ||


Key Questions Answered in the Report
What is the projected value of the commercial distributed energy generation market by 2031?
It is forecast to reach USD 234.26 billion by 2031, translating to a 7.6% CAGR from 2026.
Which technology is expected to record the fastest growth to 2031?
Solar PV paired with batteries is projected to grow at 14.4% annually, outpacing all other technologies in the segment.
Why are data centers investing heavily in on-site generation?
They need rapid capacity additions and 24/7 reliability, and on-site generation helps bypass multi-year utility interconnection queues.
Which region will be the quickest-growing between 2026 and 2031?
The Middle East and Africa are set for a 13.1% CAGR as solar-plus-storage frees natural gas for export and hybrid microgrids replace unreliable public supply.
How do AI-enabled DER orchestration platforms improve project economics?
They allow batteries to earn ancillary-service income and cut peak demand charges, lifting project IRRs by up to 3 percentage points and shortening payback periods.
What is the main financing barrier for small commercial buyers?
High upfront capex combined with paybacks exceeding eight years keeps many small and mid-sized operators from self-funding projects, although energy-as-a-service models can bridge the gap.
Page last updated on:


