Energy Efficient Lighting Technology Market Size and Share
Market Overview
| Study Period | 2020 - 2030 |
|---|---|
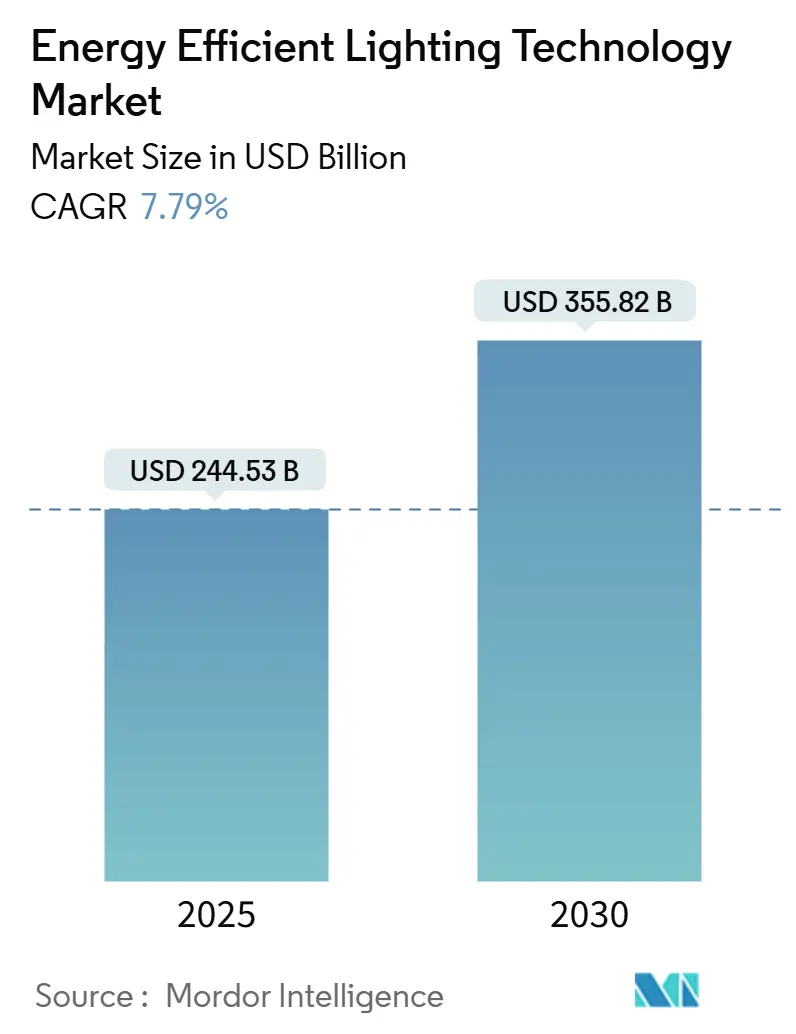
| Market Size (2025) | USD 244.53 Billion |
| Market Size (2030) | USD 355.82 Billion |
| Growth Rate (2025 - 2030) | 7.79% CAGR |
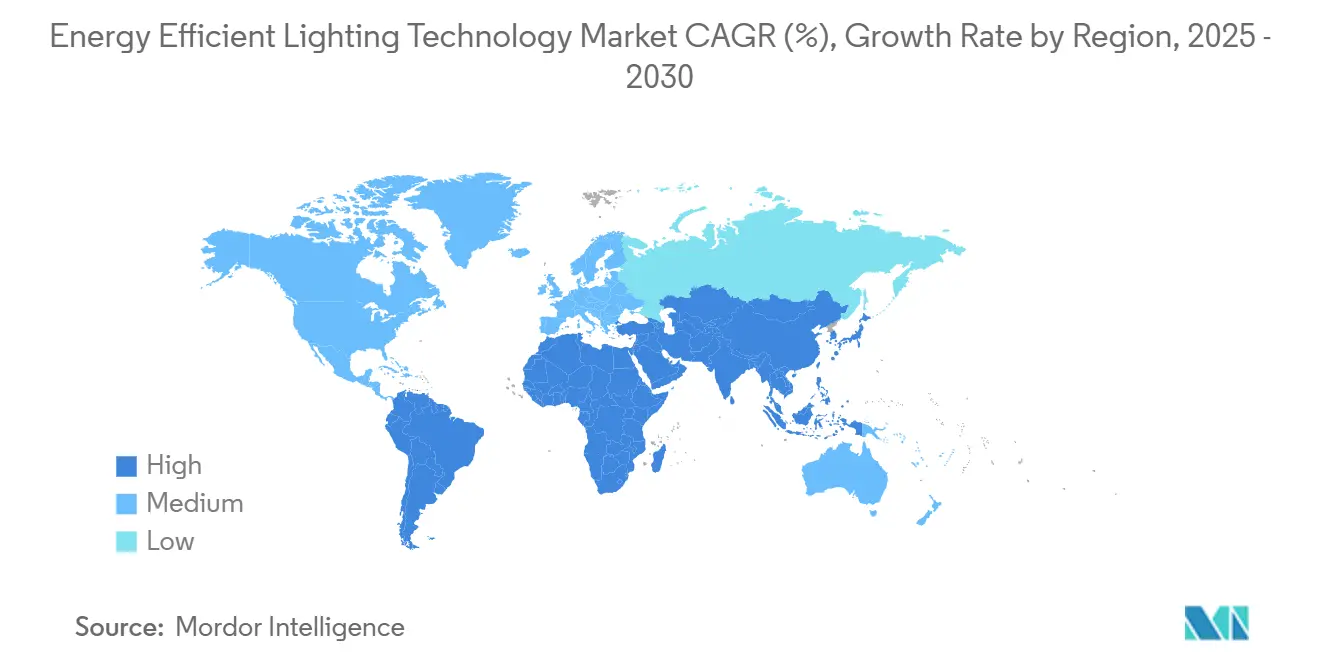
| Fastest Growing Market | Asia Pacific |
| Largest Market | Asia Pacific |
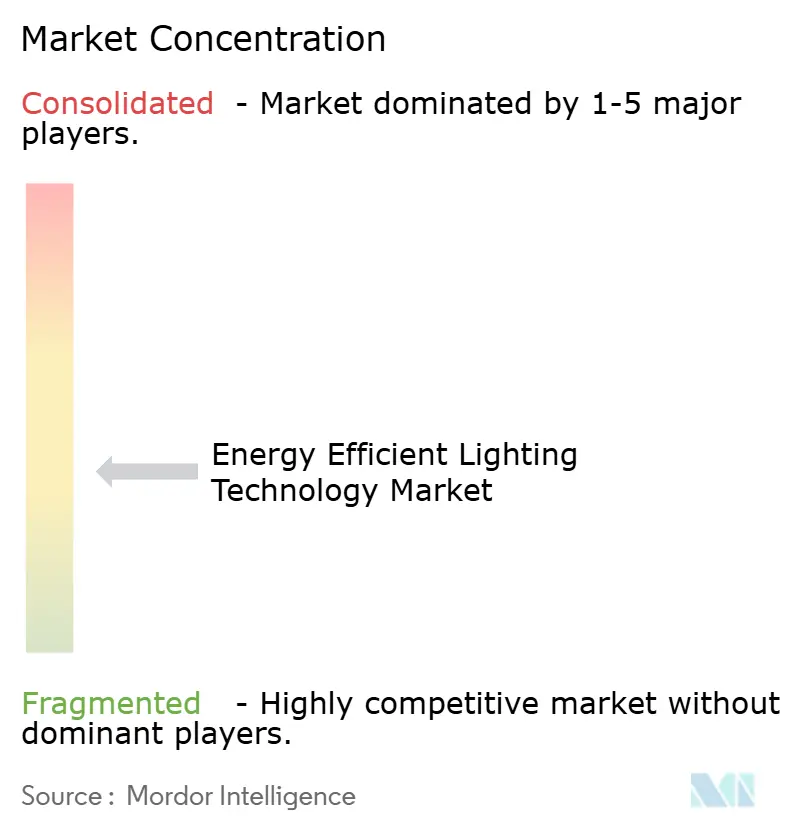
| Market Concentration | Medium |
Major Players
*Disclaimer: Major Players sorted in no particular order Image © Mordor Intelligence. Reuse requires attribution under CC BY 4.0. |
|
Energy Efficient Lighting Technology Market Analysis by Mordor Intelligence
The Energy Efficient Lighting Technology Market size is estimated at USD 244.53 billion in 2025, and is expected to reach USD 355.82 billion by 2030, at a CAGR of 7.79% during the forecast period (2025-2030).
Steady regulatory tightening, semiconductor reshoring, and rapid cost declines in light-emitting diode (LED) components anchor this outlook. New United States lamp rules will require 120 lumens per watt by 2028, doubling minimum efficacy and effectively eliminating remaining incandescent stock[1]U.S. Department of Energy, “Energy Conservation Program: General Service Lamps,” energy.gov. Parallel mercury restrictions under the European Union’s RoHS directive have removed most fluorescent products, leaving LEDs as the default specification. Supply-side momentum is reinforced by the U.S. CHIPS and European Chips Acts, which channel public incentives toward domestic silicon carbide, sensor, and LED back-end capacity. These moves lower geopolitical exposure after China’s curbs on gallium and germanium exports—materials central to phosphor and substrate formulations—tightened in 2024. Finally, corporate net-zero programs, municipal street-light conversions, and building-code upgrades collectively enlarge addressable demand, supporting double-digit shipment growth even as average selling prices keep falling.
Key Report Takeaways
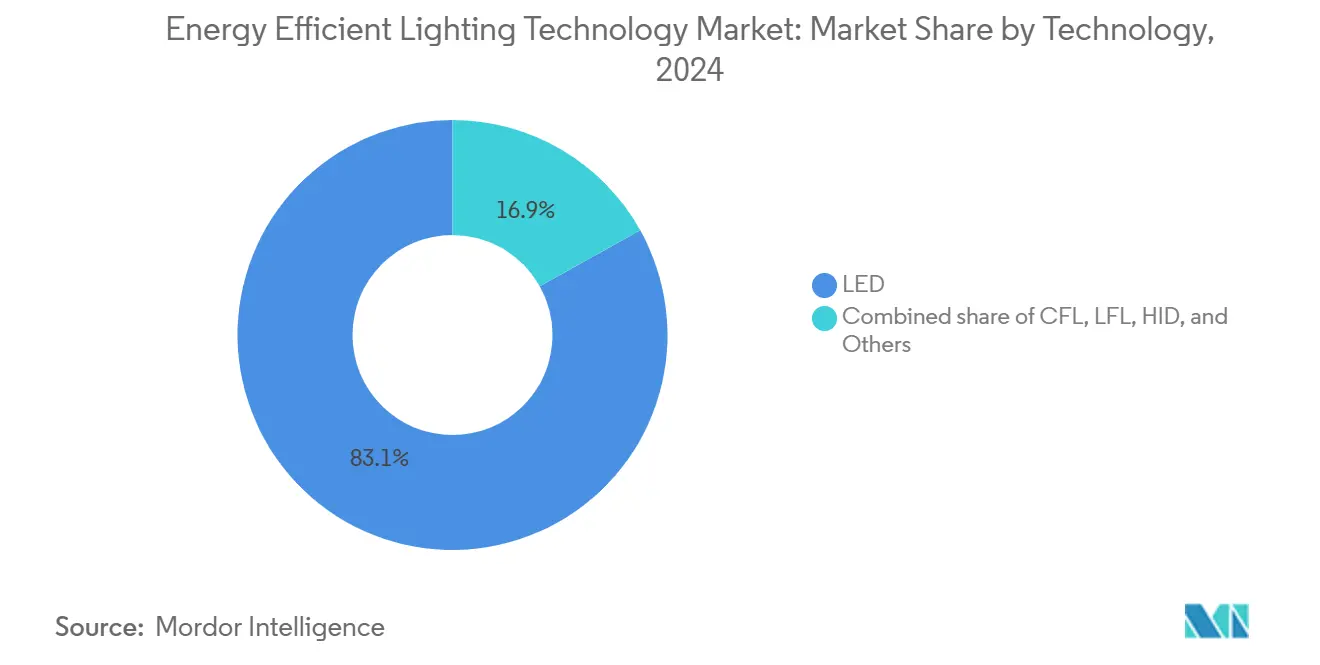
- By technology, LEDs captured 83.1% of the energy-efficient lighting technology market share in 2024.
- By application, automotive lighting will advance at a 9.3% CAGR between 2025 and 2030, outpacing all other end uses.
- By geography, Asia-Pacific commanded 43.9% of the energy-efficient lighting technology market size in 2024 and is forecast to expand at an 8.9% CAGR through 2030.
Global Energy Efficient Lighting Technology Market Trends and Insights
Drivers Impact Analysis*
| Driver | (~) % Impact on CAGR Forecast | Geographic Relevance | Impact Timeline |
|---|---|---|---|
| LED cost/lm keeps falling < $0.06 | +1.2% | Global, with strongest impact in price-sensitive APAC and emerging markets | Medium term (2-4 years) |
| Rapid ban of fluorescent & halogen lamps (EU, US, India) | +1.6% | EU, North America, India core, with spillover to aligned regulatory markets | Short term (≤ 2 years) |
| Smart-home retrofit boom | +0.9% | North America & EU primary, expanding to urban APAC centers | Medium term (2-4 years) |
| Corporate net-zero lighting pledges | +0.8% | Global, with early concentration in North America, EU, and multinational corporate hubs | Long term (≥ 4 years) |
| Micro-LED backlighting enters general lighting | +0.6% | APAC manufacturing centers, premium segments in North America and EU | Long term (≥ 4 years) |
| Grid-interactive "lighting-as-storage" pilots | +0.5% | North America and EU smart grid regions, select APAC pilot cities | Long term (≥ 4 years) |
| Source: Mordor Intelligence | |||
LED Cost Reduction Accelerates Market Democratization
LED package prices have fallen 95% since commercialization, dropping below USD 0.06 per lumen in 2025. Laboratory warm-white external quantum efficiencies advanced from 5.8% in 2003 to 38.8% in 2020, translating into shorter payback periods that open low-income housing and developing-country segments to high-efficacy products[2]Nature Energy Editorial Board, “Progress in Solid-State Lighting,” nature.com. Ongoing research into manganese-based phosphors offers further material savings by replacing cost-intensive europium and cerium, potentially cutting bill-of-materials outlays by up to 60%. These combined trajectories strengthen the energy-efficient lighting technology market by eroding the last pockets of upfront-price resistance, particularly in South Asia and Sub-Saharan Africa.
Regulatory Bans Create Irreversible Market Shift
Mandatory phase-outs have reached historic breadth: the RoHS directive eliminated most mercury lamps by February 2024, and several U.S. states now ban compact-fluorescent and linear-fluorescent sales. India’s Bureau of Energy Efficiency is coordinating a nationwide bulb exchange that targets 1 billion replacements within three years, locking in LED demand even during macro-economic slowdowns. Because the bans are statutory, retrofit volume is largely insulated from consumer sentiment swings.
Smart-Home Retrofit Boom Transforms Residential Lighting
Voice-activated hubs and low-energy wireless protocols allow connected luminaires to integrate occupancy sensing, daylight harvesting, and demand-response logic. Field studies show residential IoT lighting can cut consumption by up to 80% when paired with adaptive dimming algorithms[3]Interact, “Connected Lighting for Homes,” interact-lighting.com. Utilities see additional grid value; Pacific Gas & Electric’s SAVE virtual power plant couples smart bulbs with behind-the-meter batteries to shift peak loads during extreme-weather events. These features reposition lighting from a passive fixture to a data-rich node inside home-energy ecosystems.
Corporate Net-Zero Pledges Drive Procurement Transformation
Fortune-500 decarbonization goals push facilities teams toward quantifiable carbon abatement. Signify projects that universal LED conversion could abate 1% of global greenhouse gas emissions, a proposition that boards can benchmark against aviation and heavy-industry footprints. Acuity Brands documented 34 million metric tons of avoided emissions between 2020 and 2024 by selling LED and controls platforms, demonstrating the material influence procurement policies now carry.
Restraints Impact Analysis*
| Restraint | (~) % Impact on CAGR Forecast | Geographic Relevance | Impact Timeline |
|---|---|---|---|
| Supply crunch in key LED phosphors | -0.6% | Global, with acute impact on APAC manufacturing and cost-sensitive markets | Short term (≤ 2 years) |
| "Rebound lighting" increases total kWh | -0.4% | Global, with higher impact in developed markets with existing efficient lighting base | Medium term (2-4 years) |
| E-waste compliance costs | -0.3% | EU primary, expanding to North America and select APAC markets with stricter regulations | Medium term (2-4 years) |
| Persistent payback skepticism in low-income housing | -0.2% | Emerging markets and low-income segments globally, concentrated in South America, MEA, rural APAC | Long term (≥ 4 years) |
| Source: Mordor Intelligence | |||
Supply Chain Vulnerabilities Threaten Production Continuity
China controls 98% of refined gallium output and has restricted exports since mid-2024. U.S. Geological Survey scenarios show prices could spike 150%, compressing tight margins for mid-power chips and phosphor blends[4]U.S. Geological Survey, “Critical Mineral Resources of Gallium and Germanium,” usgs.gov. Western governments now explore stockpiles and recycling streams to buffer the energy-efficient technology market against sudden raw-material shocks. Substitution chemistries hold promise yet require multiyear qualification.
Rebound Effect Undermines Efficiency Gains
Meta-analysis finds that 10% direct and 11% indirect rebound shave an average of 20% off theoretical lighting savings as users lengthen burn hours or specify higher lux once energy cost falls. Policy designs may need complementary demand-management tools—such as adaptive tariffs—to reach headline energy targets.
*Our forecasts treat driver/restraint impacts as directional, not additive. The impact forecasts reflect baseline growth, mix effects, and variable interactions.
Segment Analysis
By Technology: LED Dominance Accelerates Innovation
LEDs represented 83.1% of total revenue in 2024 and are advancing at an 8.5% CAGR through 2030. At the segment level, the energy-efficient lighting technology market size for LEDs is projected to expand from USD 203 billion in 2025 to almost USD 310 billion by 2030. Several breakthroughs sustain this trajectory: three-dimensional gallium-nitride nano-wire arrays raise brightness without additional thermal load, while perovskite quantum-dot emitters achieve 20% external quantum efficiency at pixel densities exceeding 120,000 ppi. These capabilities extend lighting into displays, in-vehicle optics, and optical-wireless (LiFi) communications, reinforcing a virtuous cycle of scale and R&D reinvestment. Legacy compact-fluorescent and high-intensity-discharge lamps retreat to niche industrial niches where extreme temperatures or long-throw optics still favor arc-based sources.
LED platforms benefit from process knowledge borrowed from logic and memory chips; Nature Energy attributes 8.5% of historical efficiency gains to cross-sector technology spillovers. Aggressive roadmaps now target 200 lumens per watt at the luminaire level, promising another round of payback compression across commercial and public-sector retrofits.


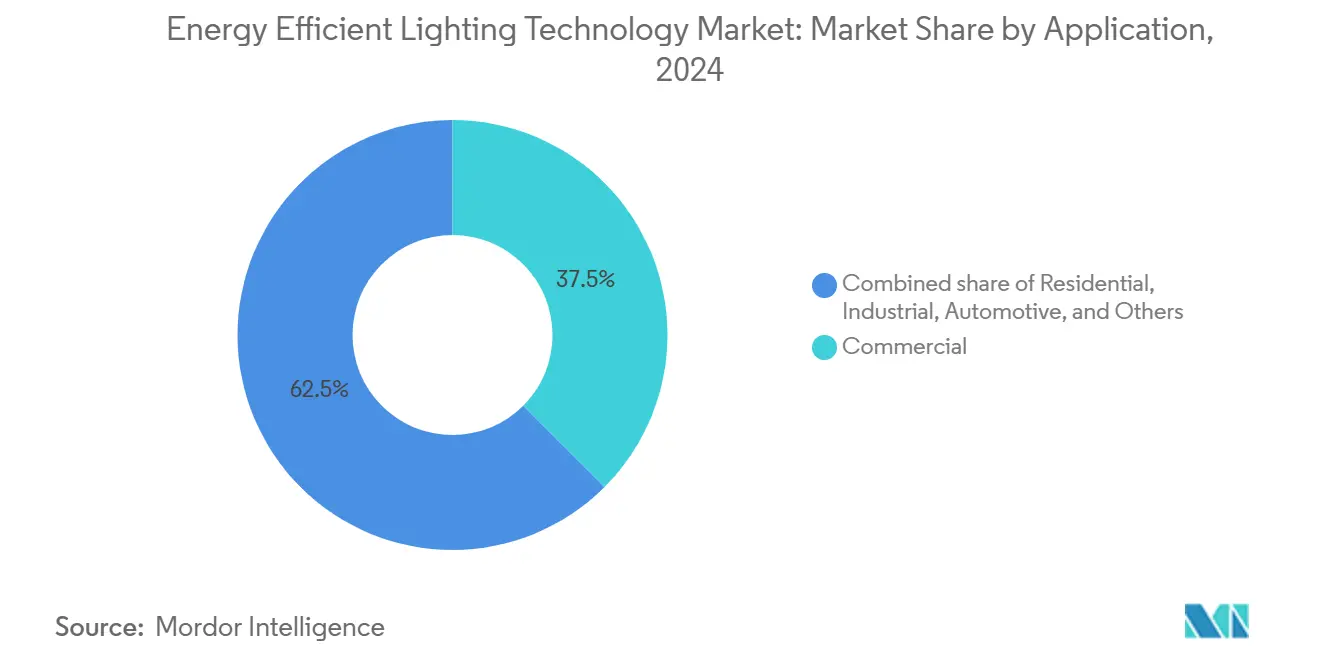
By Application: Automotive Segment Drives Premium Innovation
Commercial buildings retained the largest absolute demand in 2024, yet automotive lighting is the fastest-growing use case at 9.3% CAGR. Adaptive high-beam modules, pixelated headlamps, and dynamic styling signatures are migrating from luxury models to mass-market trims under new safety legislation in Europe and North America. Advanced micro-LED arrays enable headlamps to project over 1 million addressable pixels, selectively blanking glare while illuminating hazards. Thermal-stack designs push optical efficiency toward 89% on high-beam patterns, maximizing range for battery-electric vehicles where every kilowatt-hour counts. Tunable ambient schemes synchronize circadian cues in the cabin, adding incremental revenue per vehicle. Beyond automotive, municipalities accelerate street-light conversion programs: the City of Chicago swapped 270,000 luminaires, cutting energy use 50% and annual emissions by 23,000 metric tons. Industrial clients emphasize predictive maintenance and wireless controls for high-bay fixtures, while residential adoption grows in lockstep with smart-home ecosystems.
Geography Analysis
Asia-Pacific held 43.9% of 2024 sales and is forecast to add USD 65 billion by 2030, upheld by clustered semiconductor fabs, dense contract-manufacturer networks, and rapid infrastructure build-out. Signify’s Jiujiang complex, its largest LED facility worldwide, operates 192 automated lines, underscoring the region’s manufacturing depth. India’s Electronics Component Manufacturing Scheme allocates INR 22,919 crores to localize driver ICs and LED packages, tilting future supply growth toward South Asia. Indonesia, Vietnam, and Malaysia attract second-wave investments as firms diversify away from coastal China yet retain regional logistics efficiencies.
North America and Europe lean on policy instruments rather than pure cost economics to stimulate demand. The U.S. requirement for 120 lumens per watt by 2028 phases out nearly all incandescent stock, catalyzing a multi-year replacement wave. The European Union embeds lighting in holistic building-performance directives, driving simultaneous upgrades to controls, sensors, and EMS dashboards. Both regions commit public subsidies to domestic chip capacity to insulate the energy-efficient lighting technology market from geopolitically concentrated raw-material nodes; Wolfspeed’s USD 750 million silicon-carbide expansion and ams OSRAM’s Austrian sensor fab illustrate the push.
South America, the Middle East, and Africa represent a smaller but accelerating opportunity base. These regions often leapfrog fluorescents, proceeding straight to LED street-lights and low-cost bulbs. However,currencyy volatility and limitedfinancing, keep uptake skewed toward budget lines lacking connectivity. Multilateral climate-finance programs that pair concessional loans with carbon-credit revenue could unlock broader smart-lighting penetration.

Competitive Landscape
Market structure remains moderately fragmented: the top five vendors command roughly 45% of global revenue, a share insufficient to dictate price yet large enough to scale advanced R&D. Horizontal expansion gives way to vertical integration as leaders secure driver IC, sensor, and controls expertise amid chip-supply uncertainty. Signify, Acuity Brands, and OSRAM widen their footprints through green facility upgrades, AI-enabled design platforms, and circular-economy services like luminaire leasing. Cross-domain acquisitions intensify; Acuity Brands’ USD 1.215 billion purchase of QSC brings audio-visual management onto the same cloud as lighting and HVAC, positioning the firm to sell unified “intelligent space” subscriptions. Patent disputes proliferate because granular color-mixing algorithms and low-latency mesh networking differentiate modern systems; Signify’s infringement filing against emerging smart-lighting entrants illustrates the defensive posture of incumbents.
Upstarts concentrate on edge niches—LiFi modules capable of gigabit backhaul, horticulture luminaires tuned to specific photosynthetic wavelengths, or grid-interactive fixtures that modulate reactive power for utilities. Some build on public-domain chipsets to circumvent established IP thickets, trimming development costs but facing supply constraints as gallium bans tighten. The competitive landscape, therefore, balances scale economies in commodity LED bulbs against high-margin specialty domains where agility and domain insight outweigh factory throughput.
Energy Efficient Lighting Technology Industry Leaders
-
Signify (Philips Lighting)
-
OSRAM Licht AG
-
Acuity Brands
-
GE Current
-
Cree LED
- *Disclaimer: Major Players sorted in no particular order

Recent Industry Developments
- April 2025: India’s Ministry of Electronics and Information Technology launched a component-manufacturing fund totaling INR 22,919 crores to localize lighting electronics.
- October 2024: Acuity Brands agreed to acquire QSC for USD 1.215 billion, enlarging its Intelligent Spaces portfolio.
- August 2024: Havells Lighting LLC entered the United States via a joint venture with Krut LED LLC, adding in-house driver production for commercial and industrial customers.
- June 2024: Signify has unveiled NatureConnect, a groundbreaking product set to redefine indoor lighting. Drawing inspiration from biophilic design, NatureConnect emulates the sun's natural rhythm, aiming to boost mood, sharpen focus, and improve sleep quality.


Global Energy Efficient Lighting Technology Market Report Scope
| LED |
| CFL |
| LFL |
| HID |
| Others |
| Residential |
| Commercial |
| Industrial |
| Outdoor and Street |
| Automotive |
| Others |
| North America | United States |
| Canada | |
| Mexico | |
| Europe | United Kingdom |
| Germany | |
| France | |
| Spain | |
| Nordic Countries | |
| Russia | |
| Rest of Europe | |
| Asia-Pacific | China |
| India | |
| Japan | |
| South Korea | |
| ASEAN Countries | |
| Australia and New Zealand | |
| Rest of Asia-Pacific | |
| South America | Brazil |
| Argentina | |
| Colombia | |
| Rest of South America | |
| Middle East and Africa | United Arab Emirates |
| Saudi Arabia | |
| South Africa | |
| Egypt | |
| Rest of Middle East and Africa |
| By Technology | LED | |
| CFL | ||
| LFL | ||
| HID | ||
| Others | ||
| By Application | Residential | |
| Commercial | ||
| Industrial | ||
| Outdoor and Street | ||
| Automotive | ||
| Others | ||
| By Geography | North America | United States |
| Canada | ||
| Mexico | ||
| Europe | United Kingdom | |
| Germany | ||
| France | ||
| Spain | ||
| Nordic Countries | ||
| Russia | ||
| Rest of Europe | ||
| Asia-Pacific | China | |
| India | ||
| Japan | ||
| South Korea | ||
| ASEAN Countries | ||
| Australia and New Zealand | ||
| Rest of Asia-Pacific | ||
| South America | Brazil | |
| Argentina | ||
| Colombia | ||
| Rest of South America | ||
| Middle East and Africa | United Arab Emirates | |
| Saudi Arabia | ||
| South Africa | ||
| Egypt | ||
| Rest of Middle East and Africa | ||


Key Questions Answered in the Report
What is the projected global value of energy efficient lighting technology by 2030?
Forecasts point to USD 355.82 billion in 2030, up from USD 244.53 billion in 2025, reflecting a 7.79% compound annual growth rate.
How quickly will LED solutions expand relative to other lighting technologies?
LEDs are set to post an 8.5% CAGR through 2030, widening their already dominant 83.1% revenue share as fluorescent and halogen options phase out.
Why are automotive applications drawing the fastest growth in advanced lighting?
Adaptive headlight mandates and micro-LED design features are driving a 9.3% CAGR for vehicle lighting between 2025 and 2030, outpacing all other end uses.
Which region currently leads both demand and production for energy efficient lighting technology?
Asia-Pacific controls 43.9% of 2024 revenue and is anticipated to grow at an 8.9% CAGR, supported by dense semiconductor fabs and rapid urban infrastructure spending.
How will the new U.S. lamp efficacy rule affect product replacements?
The 120 lumens-per-watt standard effective 2028 effectively removes remaining incandescent and halogen stock, creating a multi-year LED retrofit wave.
What materials supply risk could hinder short-term LED availability?
China’s export curbs on gallium and germanium threaten phosphor and substrate inputs, a constraint that could lift costs and slow shipments until alternate sources scale.
Page last updated on:


