
Potentiostat Market Size and Share
Market Overview
| Study Period | 2020 - 2031 |
|---|---|
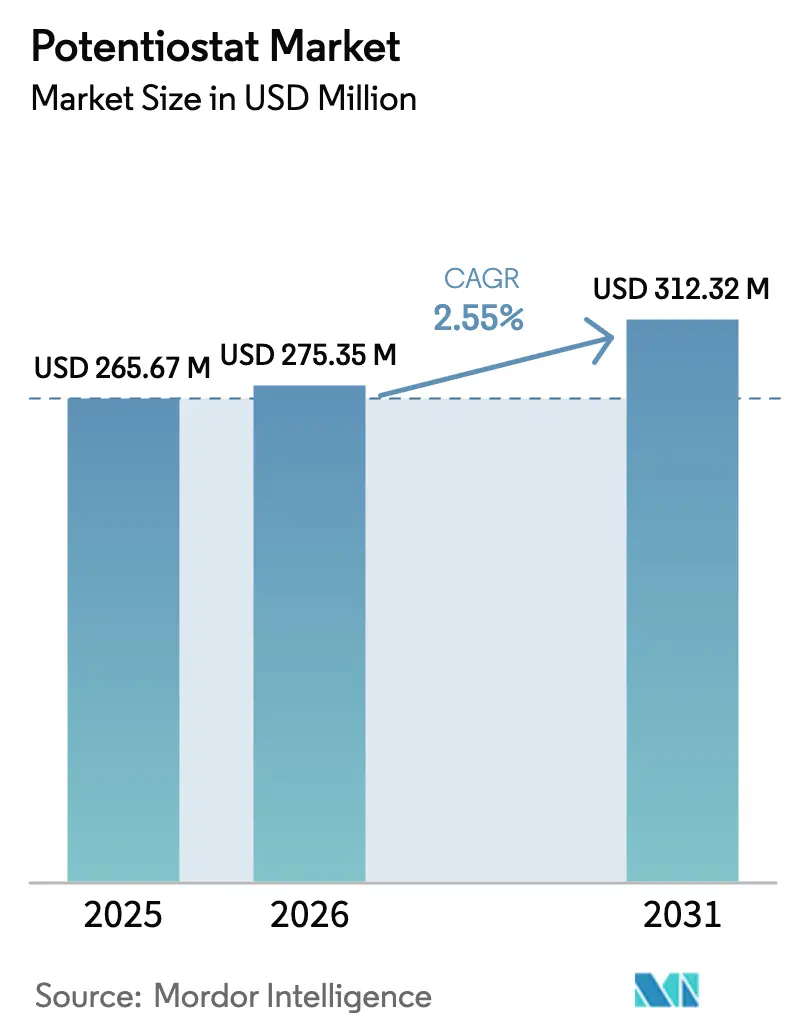
| Market Size (2026) | USD 275.35 Million |
| Market Size (2031) | USD 312.32 Million |
| Growth Rate (2026 - 2031) | 2.55 % |
| Fastest Growing Market | Asia Pacific |
| Largest Market | Asia Pacific |
| Market Concentration | Medium |
Major Players *Disclaimer: Major Players sorted in no particular order Image © Mordor Intelligence. Reuse requires attribution under CC BY 4.0. | |
Potentiostat Market Analysis by Mordor Intelligence
The Potentiostat Market size is estimated at USD 275.35 million in 2026, and is expected to reach USD 312.32 million by 2031, at a CAGR of 2.55% during the forecast period (2026-2031). Robust investment in electrochemical biosensors for drug discovery, stricter water-quality regulations that favor real-time voltammetric monitoring, and the rapid scale-up of solid-state battery research anchor that growth trajectory. Medium-current systems currently dominate the market, but high-current models exceeding 10 amperes are gaining traction as battery developers transition from coin-cell proofs of concept to full-cell validation. Multi-channel architectures, especially 8- and 16-channel frames, are now the default in pharma and materials labs because parallel testing compresses screening cycles from months to weeks. Portable form factors expand the addressable universe for field testing in environmental compliance and food safety, fragmenting competitive dynamics while broadening overall adoption. Asia-Pacific leads expansion on the back of China’s localization push in lithium-metal characterization tools and India’s surging electric-vehicle battery capacity.[1]
Key Report Takeaways
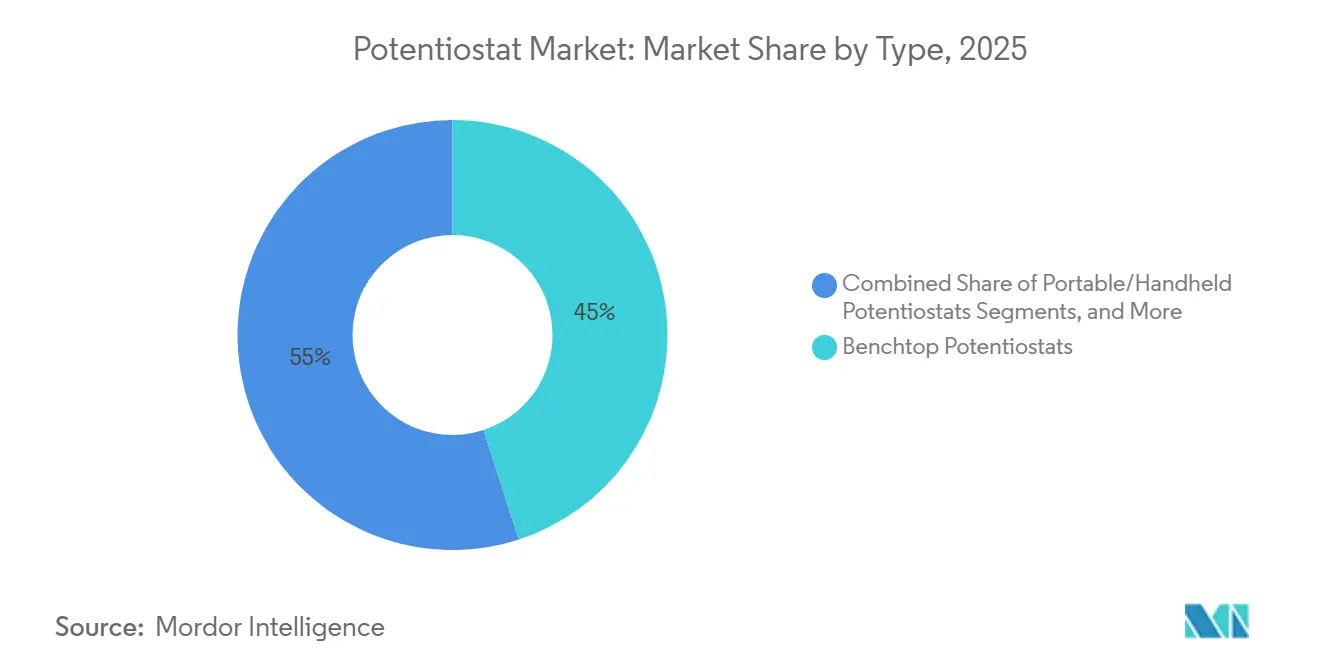
- By type, benchtop potentiostats led with 46% revenue share in 2025. Portable and handheld potentiostats are projected to grow at the fastest 2.87% CAGR through 2031.
- By channel count, multi-channel configurations dominated with a 58% share in 2025. The same multi-channel category is also forecast to expand at the quickest 3.12% CAGR over the forecast period.
- By technique support, potentiostats equipped with electrochemical impedance spectroscopy captured 63.4% of 2025 revenue. The electrochemical impedance spectroscopy segment is expected to post the highest CAGR of 2.95% to 2031.
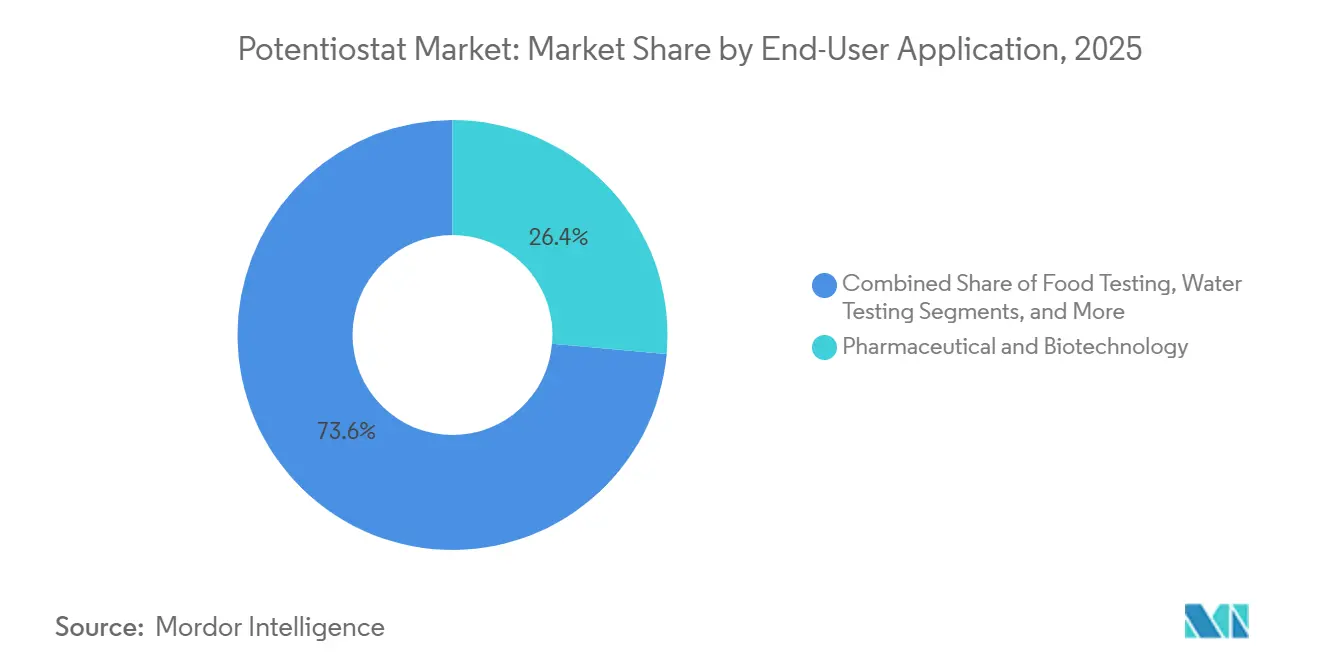
- By end-user application, the pharmaceutical and biotechnology sector accounted for the largest share, 26.4%, in 2025. Energy storage and conversion are projected to register the leading 3.16% CAGR through 2031.
- By current range, medium-current systems spanning 1–10 A held 52.1% of 2025 revenue. High-current variants above 10 A are anticipated to achieve the fastest 2.63% CAGR during the forecast horizon.
- By geography, Asia-Pacific commanded a 34.66% share of global revenue in 2025. Asia-Pacific is also poised to record the highest 3.05% CAGR between 2026 and 2031.
Note: Market size and forecast figures in this report are generated using Mordor Intelligence’s proprietary estimation framework, updated with the latest available data and insights as of January 2026.
Market Trends and Insights
Drivers Impact Analysis of Potentiostat Market*
| Driver | (~) % Impact on CAGR Forecast | Geographic Relevance | Impact Timeline |
|---|---|---|---|
| Increasing R&D in Energy Storage Materials Requiring Advanced Electrochemical Techniques | +1.3% | Asia-Pacific, North America, Europe | Medium term (2-4 years) |
| Adoption of High-Throughput Screening in Electrochemical Drug Discovery | +1.2% | North America, Europe, Asia-Pacific | Short term (≤2 years) |
| Expansion of Environmental Monitoring Regulations Mandating Electrochemical Sensors | +1.0% | North America, Europe, Global | Long term (≥4 years) |
| Miniaturization and IoT Connectivity Enabling Field-Deployable Potentiostats | +0.9% | North America, Europe, Asia-Pacific | Medium term (2-4 years) |
| Growth of Portable Electrochemical Testing in Food Safety | +0.8% | North America, Europe | Short term (≤2 years) |
| Integration with AI-Driven Data Analytics for Real-Time Corrosion Monitoring | +0.7% | Global, Oil and Gas Infrastructure | Long term (≥4 years) |
| Source: Mordor Intelligence | |||
Increasing R&D in Energy Storage Materials Requiring Advanced Electrochemical Techniques
Global battery demand is forecast to hit 3,500 GWh by 2030, up from 700 GWh in 2022, driving laboratories to adopt potentiostats capable of resolving sub-milliohm interfacial resistance. Such resolution lets researchers distinguish bulk electrolyte conductivity from solid-electrolyte-interface contributions, shortening iteration cycles in solid-state and sodium-ion programs. India’s electric-vehicle battery capacity is projected to climb from 4 GWh in 2023 to 139 GWh by 2035, intensifying regional demand for multi-channel systems that screen dozens of anode coatings in parallel. Instrument makers are reacting; Zurich Instruments and Keysight Technologies now integrate lock-in amplifiers that extend EIS frequency to 10 MHz, enabling operando tests inside synchrotron beamlines. Flow-battery developers exploit potentiostatic holds to quantify vanadium crossover, using that metric to predict grid-scale system life.
Adoption of High-Throughput Screening in Electrochemical Drug Discovery
Pharmaceutical pipelines increasingly embed electrochemical biosensors because the method quantifies binding kinetics without fluorescent tags that can distort small-molecule interactions. Bio-Logic’s 16-channel platforms rank entire 384-well plates in a single day, compressing hit-to-lead timelines. Portable units such as Gamry’s PAL, launched in January 2025, extend cyclic voltammetry to field-based diagnostic trials. FDA cybersecurity guidance published in February 2025 requires audit trails on networked laboratory instruments, aligning compliance mandates with potentiostat capabilities.[2] The convergence of miniaturization, throughput, and regulatory clarity is opening pathways for wearable patches that stream real-time pharmacokinetic data directly to study sponsors.
Expansion of Environmental Monitoring Regulations Mandating Electrochemical Sensors
EPA approved 14 electrochemical methods for drinking-water compliance between 2020 and 2024, replacing colorimetric assays susceptible to sulfide interference. Stripping voltammetry performed with handheld potentiostats now delivers same-day compliance data for lead, cadmium, and mercury, cutting turnaround from 72 hours to minutes. Europe’s Water Framework Directive requires all water bodies to achieve “good ecological status” by 2027, propelling municipalities toward continuous electrochemical monitors. Metrohm’s VIONIC covers ±50 V and ±6 A, letting environmental labs validate sensors across extreme pH values without hardware swaps. North America and Europe account for 70% of portable environmental potentiostat sales, but divergent enforcement slows adoption in Asia-Pacific.
Miniaturization and IoT Connectivity Enabling Field-Deployable Potentiostats
PalmSens’ EmStat Pico, no larger than a coin, pairs with smartphones to run differential pulse voltammetry in off-grid sites. Wireless units embedded in oil pipelines stream electrochemical noise data to cloud dashboards where machine-learning models flag pitting events hours before visual inspection would detect corrosion. Edge algorithms compress raw voltammograms into peak currents and charge-transfer resistances, lowering bandwidth to operate on solar power. EUROLAB’s October 2024 guidelines recommend role-based access controls and encrypted data streams for digitalized laboratory instruments. University labs meanwhile print flexible potentiostats on polyimide film to monitor sweat lactate during athletic training, hinting at future sports-diagnostic disruption.
Restraints Impact Analysis of Potentiostat Market*
| Restraint | (~) % Impact on CAGR Forecast | Geographic Relevance | Impact Timeline |
|---|---|---|---|
| High Cost of Multi-Channel High-Performance Potentiostats | -0.6% | Emerging Markets, Global | Medium term (2-4 years) |
| Limited Skilled Personnel for Advanced Electrochemical Techniques | -0.5% | Asia-Pacific, South America | Long term (≥4 years) |
| Supply Chain Volatility in Precision Analog Components | -0.4% | Global, East Asia Concentration | Short term (≤2 years) |
| Data Security Concerns in Cloud-Connected Laboratory Instruments | -0.3% | North America, Europe | Medium term (2-4 years) |
| Source: Mordor Intelligence | |||
High Cost of Multi-Channel High-Performance Potentiostats
Eight-channel platforms with ≥1 A per channel exceed USD 50,000 because they embed 24-bit converters, sub-picoampere op-amps, and Faraday cages, pricing out many universities and contract research organizations. Single-channel units run USD 8,000–15,000, but scaling to 16 channels pushes sticker price past USD 100,000, a nonlinear jump that depresses incremental expansion. Leasing and instrument-as-a-service models remain nascent, so emerging-market labs either time-share assets or outsource assays, extending development timelines. Import duties in South America and Africa can add 25% to landed cost, while sparse service centers extend downtime past eight weeks.
Limited Skilled Personnel for Advanced Electrochemical Techniques
Interpreting Nyquist plots, fitting equivalent-circuit models, and executing electrochemical noise analysis demand expertise taught in fewer than 50 graduate programs worldwide. Surveys show 60% of purchasers request hands-on training beyond manuals, but vendor capacity is thin because electrochemists with teaching aptitude are scarce. The deficit is self-reinforcing: universities avoid capital outlays without faculty expertise, and prospective faculty bypass electrochemistry due to limited infrastructure. Online modules help but cannot replace electrode polishing, reference-electrode maintenance, or artifact troubleshooting. Corrosion engineering feels the pinch most acutely; fewer than 200 specialists worldwide can combine noise analysis with machine-learning model training.
*Our forecasts treat driver/restraint impacts as directional, not additive. The impact forecasts reflect baseline growth, mix effects, and variable interactions.
Potentiostat Market Segment Analysis
By Type:
Portable Units Gain Traction in Field ApplicationsThe benchtop segment accounted for 46% potentiostat market share in 2025, underscoring its status as the laboratory workhorse for high-resolution measurements. Benchtop frames integrate broad ±50 V windows, picoampere sensitivity, and seamless coupling with rotating-disk and spectroelectrochemical accessories, making them indispensable in university and pharmaceutical quality-control labs. Modular card architectures let users scale from 1 A coin-cell tests to 10 A pouch-cell validation without swapping chassis, a flexibility that sustains premium pricing. Software ecosystems built around 21 CFR Part 11 compliance further lock in regulated customers, raising switching costs and extending product lifecycles.
Portable and handheld units will post the fastest 2.87% CAGR through 2031 as environmental agencies and food processors embed field voltammetry into same-day compliance checks. At less than 1.5 kg, new models pair Bluetooth or LTE connectivity with smartphone-based analytics, allowing inspectors to transmit peak currents and half-wave potentials directly to cloud dashboards. Rugged housings rated to IP 54 and battery packs that last eight hours enable on-site corrosion surveys and trace-metal assays in remote mines. Vendors now differentiate through wireless security, edge-borne signal filtering, and integration with low-cost screen-printed electrodes, elements that collectively shrink entry barriers for first-time users.

By Channel Count:
Parallel Testing Drives Multi-Channel AdoptionMulti-channel systems captured 58% potentiostat market share in 2025, reflecting researcher preference for overnight screening of battery coatings, catalyst inks, and biosensor chemistries. A 16-channel frame compresses a month-long experimental queue into a weekend run, accelerating time-to-result for pharmaceutical hit-to-lead campaigns. Galvanically isolated channels prevent cross-talk during asynchronous cycling, while unified software orchestrates data capture across thousands of impedance points in real time. Capital intensity remains high, yet per-channel cost fell from USD 12,000 in 2020 to USD 8,000 in 2025, widening accessibility for mid-tier institutes.
The segment’s 3.12% forecast CAGR rests on two pillars: growing demand for solid-state battery prototyping that requires synchronized cycling of dozens of half-cells, and broader adoption of fee-for-service electrochemistry cores inside open-access research parks. Instrument-leasing programs now bundle preventive maintenance and application training, smoothing budget approvals for public universities. Single-channel devices retain relevance where distributed sensor nodes trump centralized throughput, for example, pipeline integrity monitoring, but their share is set to erode as shared-facility models proliferate.
By Technique Support:
EIS Integration Commands Premium PricingPotentiostats equipped with electrochemical impedance spectroscopy held 63.4% of 2025 revenue, highlighting the modality’s pivotal role in decoupling charge-transfer resistance from diffusion phenomena. Measurement ranges now reach 10 MHz, allowing investigators to resolve double-layer capacitance in supercapacitor electrodes and proton-exchange-membrane fuel cells. Purpose-built modeling suites fit equivalent circuits automatically, reducing analysis time and boosting reproducibility across consortium studies. The premium, roughly 40% above voltammetry-only units, is justified by richer diagnostics that shorten failure-analysis cycles in battery aging programs.
A 2.95% CAGR to 2031 hinges on democratization trends such as USD 2,000 pocket-size modules that embed EIS from 0.1 Hz to 200 kHz. Teaching labs deploy these units to expose undergraduates to Nyquist plots without straining departmental budgets, planting early-career familiarity that converts into future demand. At the high end, synchrotron beamline operators integrate lock-in amplifiers with potentiostats to synchronize impedance spectra with X-ray diffraction frames, producing operando insights that guide electrolyte formulation. Skills shortages persist, yet online workshops and AI-driven circuit-fitting tools are lowering the learning curve.
By End-User Application:
Energy Storage Outpaces Pharmaceutical GrowthPharmaceutical and biotechnology users controlled 26.4% of 2025 revenue, cementing electrochemical assays as mainstream for binding-kinetics screening and redox-active drug characterization. Multi-channel systems analyze 384-well plates in a single shift, while validated audit-trail software satisfies regulatory data-integrity demands. Integration with microfluidic chips enables serial dilution on the fly, expanding throughput without inflating reagent budgets. As decentralized clinical trials proliferate, wearable electrochemical patches stream real-time pharmacokinetic data, opening a new demand front for miniaturized potentiostats.
Energy storage and conversion, forecast to advance at a 3.16% CAGR, represents the fastest-growing application block. Solid-state, sodium-ion, and flow-battery developers rely on operando impedance measurements to correlate interfacial dynamics with structural phase transitions captured via synchrotron or neutron scattering. High-current boosters exceeding 20 A let researchers simulate automotive load cycles in-house, trimming external pilot-line testing costs. Government grants targeting domestic cell manufacturing lines, especially in Asia-Pacific and North America, further amplify procurement budgets for battery-focused electrochemical workstations.
By Current Range:
High-Current Systems Capture Battery-Testing DemandMedium-current instruments rated 1-10 A contributed 52.1% of 2025 revenue, aligning with coin-cell and small pouch-cell research where current densities stay below 100 mA cm². These systems bridge the gap between picoampere-level biosensor studies and full-pack validation, offering modular boosters that add headroom without swapping motherboards. Forced-air cooling handles up to 500 W of resistive heat, keeping footprint compact for benchtop environments. Integrated safety interlocks satisfy corporate EHS protocols by cutting power during over-temperature excursions.
High-current models above 10 A are poised for a 2.63% CAGR, benefiting from the shift toward electric-vehicle and grid-scale cell formats that demand realistic load profiles. Liquid-cooled electrode fixtures dissipate kilowatt-level heat, while low-inductance cabling maintains measurement fidelity at rapid current transients. Coupling with calorimetry and gas-evolution accessories yields multidomain datasets that compress root-cause analysis during abuse testing. Although capital costs remain steep, consortium purchasing frameworks and tax incentives for energy-storage R&D are broadening access beyond Tier-1 cell makers.
Geography Analysis
APAC Potentiostat Market
Asia-Pacific held 34.66% of global revenue in 2025 and is projected to expand at a 3.05% CAGR through 2031. China’s localization mandate for lithium-metal characterization tools, India’s EV-battery capacity jump from 4 GWh in 2023 to 139 GWh by 2035, and Japan’s operando beamline programs underpin demand. South Korea’s hydrogen fuel-cell roadmap drives the procurement of high-current frames, while Australia’s minerals sector favors portable units for on-site ore analysis. Uneven provincial enforcement of environmental standards and limited distributor networks in Southeast Asia temper upside.
North America Potentiostat Market
North America accounted for 28% of 2025 revenue. FDA cybersecurity rules from February 2025 push QC labs toward cloud-connected potentiostats with audit trails. EPA-endorsed electrochemical methods accelerate municipal water-utility upgrades. Canada’s mining industry deploys handheld devices for tailings-pond monitoring, while Mexico’s automotive suppliers validate coatings with corrosion test cells. Forecast regional CAGR remains below Asia-Pacific through 2031.
Europe Potentiostat Market
Europe contributed 26% in 2025, with Germany, France, and the United Kingdom at the forefront of battery and environmental research. The Water Framework Directive compels municipalities to install continuous voltammetric monitors, supporting steady replacement demand. EUROLAB’s 2024 digitalization guidelines will soon embed encryption and role-based access controls as accreditation prerequisites. Southern Europe lags due to fragmented funding, and Russia’s isolation opens niche opportunities for local suppliers.

Regulatory Landscape
Potentiostats are generally treated as laboratory and analytical electrical equipment rather than medical devices, but compliance expectations tighten when the instruments are used inside regulated pharmaceutical and biotechnology workflows. In the United States, the FDA Quality Management System Regulation (QMSR) became effective on February 2, 2026 and incorporates ISO 13485:2016, reinforcing supplier-control and documentation expectations for networked lab instruments used in quality-critical testing environments.
Cross-market compliance also reflects electrical safety and EMC requirements used for lab instrumentation, including IEC 61010-1/IEC 61010-2-010 and EN 61326-1, plus RF interference requirements such as FCC Part 18 where applicable. Procurement decisions can be influenced by measurement standardization, particularly in corrosion and impedance work where practices align with ASTM (for example, ASTM G5 and EIS-related methods) and ISO 16773-2 for electrochemical impedance spectroscopy setups, while import and customs classification often falls under instruments and apparatus for physical or chemical analysis (for example, HTSUS 9027.80.40).
Value Chain Analysis
The potentiostat value chain runs from precision analog and mixed-signal component suppliers (ultra-low-noise amplifiers, high-resolution ADC/DACs, microcontrollers, isolation and power subsystems) to instrument OEM design and assembly. It also depends on software and firmware development for method libraries, EIS fitting, and audit trails, before the instrument is integrated downstream with electrodes, cells, and fixtures used across battery, corrosion, biosensor, and environmental test setups.
Distribution typically combines direct sales to regulated or high-throughput laboratories with regional channel partners that bundle installation, validation support (including 21 CFR Part 11-aligned workflows), training, and calibration services. Bottlenecks tend to concentrate in specialized precision analog components and in the application-layer service ecosystem, where limited electrochemistry expertise can extend deployment timelines and raise total cost of ownership. Strategic moves that strengthen downstream execution, including Metrohm converting its Korean distribution arm into a wholly owned subsidiary in January 2025, show how vendors build direct service coverage to reduce downtime and support complex multi-channel and high-current deployments in battery research consortia.
Competitive Landscape
The potentiostat market is moderately concentrated, with Metrohm, Gamry Instruments, Bio-Logic, Princeton Applied Research, and Ivium Technologies collectively accounting for close to 60% of global revenue. These suppliers anchor their portfolios in multi-channel scalability, high-current boosters, and validated software ecosystems that meet 21 CFR Part 11 requirements. Mid-tier vendors and regional specialists fill application gaps in corrosion monitoring, wearable biosensors, and ultra-low-noise neural-interface testing, creating space for both volume and niche strategies.
Acquisition activity underscores growing investor interest. Lifco completed the acquisition of Ivium Technologies in September 2024, adding the CompactStat and IviumStat lines to its expanding laboratory-instrument platform. NOVONIX partnered with Gamry Instruments in November 2024 to pair potentiostatic cycling with ultrahigh-precision coulometry, a combination that is rapidly becoming a de facto standard for lithium inventory-loss measurements in solid-state cells. Metrohm converted its Korean distribution arm into a wholly owned subsidiary in January 2025, reinforcing direct sales and service for battery research consortia in Asia-Pacific. Such moves tighten supply-chain control and shorten customer support cycles, especially for high-current and multi-channel systems.[3]
Disruptive entrants pressure incumbents from the bottom and the edge. PalmSens delivers electrochemical impedance spectroscopy in a USD 2,000 pocket-sized package that appeals to teaching labs and field inspectors. Zurich Instruments augments potentiostats with lock-in amplifiers, enabling operando frequency ranges to 10 MHz for synchrotron beamline experiments. Compliance is now a decisive moat, as the FDA's February 2025 cybersecurity guidance favors vendors with encrypted data paths and role-based access controls. As laboratories migrate toward cloud-connected workflows, suppliers able to certify secure audit trails are poised to capture share, while laggards risk exclusion from regulated markets.
Potentiostat Industry Leaders
-
Metrohm AG
-
Gamry Instruments
-
Princeton Applied Research (AMETEK Scientific Instruments)
-
Ivium Technologies BV
-
Bio-Logic SAS
- *Disclaimer: Major Players sorted in no particular order

Potentiostat Market Companies Covered in this Report
- Metrohm AG
- Gamry Instruments
- Pine Research Instrumentation Inc.
- Princeton Applied Research (AMETEK Scientific Instruments)
- Ivium Technologies BV
- Bio-Logic SAS
- Zahner-elektrik GmbH and Co. KG
- CH Instruments Inc.
- DropSens SL
- PalmSens BV
- Uniscan Instruments Ltd.
- Wanlida Technology Co. Ltd.
- WonATech Co. Ltd.
- EmStat Pico
- Solartron Analytical
- Scribner Associates Inc.
- Redox.me Sp. z o.o.
- NTT Advanced Technology Corporation
- Zurich Instruments AG
- Keysight Technologies Inc.
Market Opportunities and Future Outlook
White space remains in compact and embedded potentiostat platforms that place electrochemical testing closer to the sample, shifting use from fixed lab workflows toward distributed sensing for environmental compliance, food testing, and wearable or point-of-care research tools. Academic and prototype work points in this direction: a 6-channel wearable potentiostat design (Eprobe) reported by Beijing Institute of Technology in September 2025, and a multifunctional portable platform with integrated fluidic automation and onboard processing (FACILE 2.0) reported by the University of Rome Tor Vergata in April 2026, both underline demand for multi-channel portability and tighter integration between sample handling and measurement.
A second opportunity sits at the system level, where potentiostat capability becomes a module within broader test stations, especially in energy storage and industrial process control settings that require higher channel density, wider voltage windows, and connectivity. CMOS-based architectures reported to expand supported voltage swing, along with ongoing research into low-power wireless interfaces (Bluetooth, NFC, Wi-Fi), support the case for miniaturized, networked instruments. At the same time, a tightening compliance environment for connected instruments, including FDA cybersecurity guidance referenced in the report context and the 2026 QMSR effective date, creates differentiation for suppliers that pair hardware performance with secure data handling and validated software.
Recent Industry Developments in Potentiostat Market
- June 2026: Princeton Applied Research and Solartron Analytical highlighted the SI-9300R potentiostat system for solid-state and high-impedance electrolyte analysis. The highlight emphasizes operando and next-generation battery and electrolyte characterization use cases, strengthening the premium segment's competitive dynamics.
- October 2025: AMETEK Scientific Instruments launched the PARSTAT Multichannel Advanced Technology (PMC-AT) series under Princeton Applied Research. Expanding multichannel offerings aligns with the market shift toward parallel testing in battery and materials labs that want higher throughput without expanding lab footprint. The move raises the performance baseline in multichannel frames and increases pressure on incumbents to differentiate via software, isolation, and data-management features.
- March 2024: Metrohm introduced the Autolab IMP, a compact potentiostat with integrated electrochemical impedance spectroscopy (EIS) functionality. Bringing EIS into a more compact format broadens access for teaching labs, field-adjacent workflows, and smaller industrial labs that want impedance diagnostics without a full workstation configuration. The product adds intensity to the mid-range segment where portability, EIS capability, and software usability increasingly influence vendor selection.
Potentiostat Market Report Scope and Research Methodology
Market Definition and Coverage
For this study, the potentiostat market covers revenues earned from potentiostat instruments used to run electrochemical tests (including systems used for EIS-enabled and standard techniques) across lab and field settings, and counted at the point of instrument sale.
Scope exclusions: We exclude consumables, lab chemicals, electrodes, sample-prep items, and broader lab services that are not part of the potentiostat instrument value.
Segments Covered in This Report
- By Type
- Benchtop Potentiostats
- Portable/Handheld Potentiostats
- Modular/Stackable Potentiostats
- By Channel Count
- Single-Channel
- Multi-Channel
- By Technique Support
- Potentiostats with Electrochemical Impedance Spectroscopy
- Potentiostats without Electrochemical Impedance Spectroscopy
- By End-User Application
- Pharmaceutical and Biotechnology
- Environmental Testing
- Food Testing
- Water Testing
- Energy Storage and Conversion
- Corrosion Engineering
- Rest of Applications
- By Current Range
- Low-Current (Less than 1 A)
- Medium-Current (1-10 A)
- High-Current (More than 10 A)
- By Geography
- North America
- United States
- Canada
- Mexico
- Europe
- Germany
- France
- United Kingdom
- Italy
- Spain
- Russia
- Rest of Europe
- Asia-Pacific
- China
- Japan
- India
- South Korea
- Australia and New Zealand
- Rest of Asia-Pacific
- South America
- Brazil
- Argentina
- Rest of South America
- Middle East
- Saudi Arabia
- United Arab Emirates
- Turkey
- Rest of Middle East
- Africa
- South Africa
- Nigeria
- Rest of Africa
- North America
Data Sources, Market Sizing, and Validation
Desk Research
Desk work starts by mapping where potentiostats are actually used, and which demand pools can be observed in public data. We referenced OECD science and R&D indicators, the World Bank (research spending and industrial activity signals), and USGS and IEA publications that describe energy storage and materials directionality. For compliance-related testing needs, we also used US EPA and EU water and environmental monitoring resources to connect regulation and electrochemical test demand.
We then checked instrument adoption signals from peer reviewed electrochemistry journals, university lab procurement notes where available, and company filings and investor decks that describe analytical instrumentation lines and lab capex cycles. Patent databases were also reviewed to track where electrochemical techniques are being developed quickly, particularly battery testing and corrosion methods, which helps set realistic growth guardrails. For market math support, we used a paid subscription for company financials and intelligence and a paid patent database to fill gaps where public reporting was too high level. These sources are illustrative only, and many other references were used to collect, cross-check, and clarify individual data points.
Primary Interviews and Surveys
Primary work focused on validating what buyers actually purchase, and how configuration choices influence pricing and replacement cycles. We spoke with instrument manufacturers, distributors, lab managers, and end users across pharma and biotech, energy storage testing, corrosion labs, and environmental and water testing, then used those inputs to refine channel splits and realistic ASP bands by form factor.
Because this is a global market, interviews were balanced across major demand regions, so assumptions on multi-channel adoption, EIS attach rates, and high-current needs could be checked against local research intensity and industrial testing activity.
Distribution of primary research fieldwork respondents
| Company type | Respondent position | Region |
|---|---|---|
| Top tier: 26% | CXOs: 13% | APAC: 44% |
| Mid tier: 57% | Functional/Unit leaders: 33% | EMEA: 31% |
| Smaller Players: 17% | Managers: 54% | Americas: 25% |
Market-Sizing & Forecasting
Sizing was built using top-down and bottom-up logic. We first reconstructed demand from observable testing activity and lab investment cycles, then cross-checked totals using selective supplier and channel approximations. The top-down build relied on regional R&D intensity, battery and materials research momentum, environmental compliance testing needs, and lab capital spending patterns that typically govern instrument replacement.
To keep the model grounded, we used market fingerprints that practitioners consistently referenced, including the split between benchtop and portable units, the share of systems sold with EIS capability, the move from single-channel to multi-channel systems in high-throughput labs, and the mix of low, medium, and high current ranges used in batteries and corrosion work. Pricing was handled through ASP bands by configuration, then adjusted by region using currency timing and typical discounting practices gathered from channel discussions.
Forecasts were produced using scenario analysis supported by a light multivariate regression check, where demand is linked to R&D spend trends, energy storage testing activity, and environmental monitoring intensity. When bottom-up checks had gaps (for example, limited disclosures for small suppliers), we filled them using distributor coverage estimates and realistic utilization and replacement assumptions, then re-tested the outcome with primary inputs before finalizing.
Data Validation & Update Cycle
Model outputs were tested against independent signals, such as growth in electrochemistry publications, patenting activity around battery and corrosion testing, and visible changes in lab capex sentiment, so totals do not drift away from real demand. Variance checks were run by region and by configuration to flag outliers, and then reviewed in a second analyst pass before sign-off.
The dataset is refreshed annually. Interim updates are triggered when material events occur, such as major lab funding programs, import restrictions that impact instrument availability, or a sharp shift in battery testing investment. Before delivery, we do a final update pass so buyers receive the latest aligned view of market numbers and assumptions.
Mordor Intelligence's Global Potentiostat Market Size Measured Against Other Published Estimates
Published market values for potentiostats often differ because firms do not count the same product set and they do not treat configurations in the same way. The biggest gaps usually come from whether the estimate counts only potentiostat instruments, or also folds in adjacent electrochemical test equipment, and whether pricing is modeled as a single average or tied to channel count, EIS support, and current range.
In practice, the spread is also driven by how the base year is picked, and how quickly assumptions are refreshed when lab spending shifts. Some estimates lean on shipment stories without checking ASP erosion in mature lab segments, while others assume faster growth from energy storage testing without assessing how much demand is served by the existing installed base. Keeping the instrument-only scope and mapping it to configuration level pricing, updated through January 2026, explains why the 2026 value lands where it does, a modeling choice applied by Mordor Intelligence.
Benchmark comparison
| Source | Market Size | Gaps in Research Methodology |
|---|---|---|
| Mordor Intelligence | USD 275.35 M (2026) | |
| Industry Data Publisher A | USD 160.00 M (2025) | Uses a different base year and appears to frame the market around potentiostats used mainly in academic and general research, which can undercount industrial battery and corrosion testing demand and higher priced multi-channel systems. |
| Technology Research Brief B | USD 788.70 M (2024) | Likely includes a wider equipment set around electrochemical testing and related instrumentation, and the higher value also suggests an aggressive ASP or scope assumption that is not limited to potentiostat instruments sold as standalone systems. |
The table shows that scope and pricing logic are the two main reasons figures move apart. When the count is restricted to potentiostat instruments and then priced by the configurations labs actually buy, the outcome stays traceable to clear demand drivers and repeatable checks, which helps keep planning discussions practical.
Key Questions Answered in the Report
What CAGR is the potentiostat market projected to post from 2026 to 2031?
The market is forecast to grow at a 2.55% CAGR over the period.
Which geographic region is expected to register the fastest growth?
Asia-Pacific is poised to record the highest 3.05% CAGR through 2031, supported by large-scale battery manufacturing investments.
Why are multi-channel potentiostats gaining popularity in research labs?
Parallel testing compresses screening cycles, making the higher upfront cost worthwhile for pharmaceutical and energy-storage developers.
How does electrochemical impedance spectroscopy benefit battery developers?
EIS separates charge-transfer resistance from diffusion phenomena in one sweep, enabling precise diagnosis of battery aging mechanisms.
What is the main hurdle to wider adoption of potentiostats in emerging markets?
High capital costs for multi-channel systems and limited local service networks continue to restrain uptake.
Which companies currently dominate the high-current potentiostat niche?
Princeton Applied Research and Metrohm lead the segment with booster-enabled systems exceeding 10 A output.