
Electronic Offender Monitoring Solutions Market Size and Share
Market Overview
| Study Period | 2020 - 2031 |
|---|---|
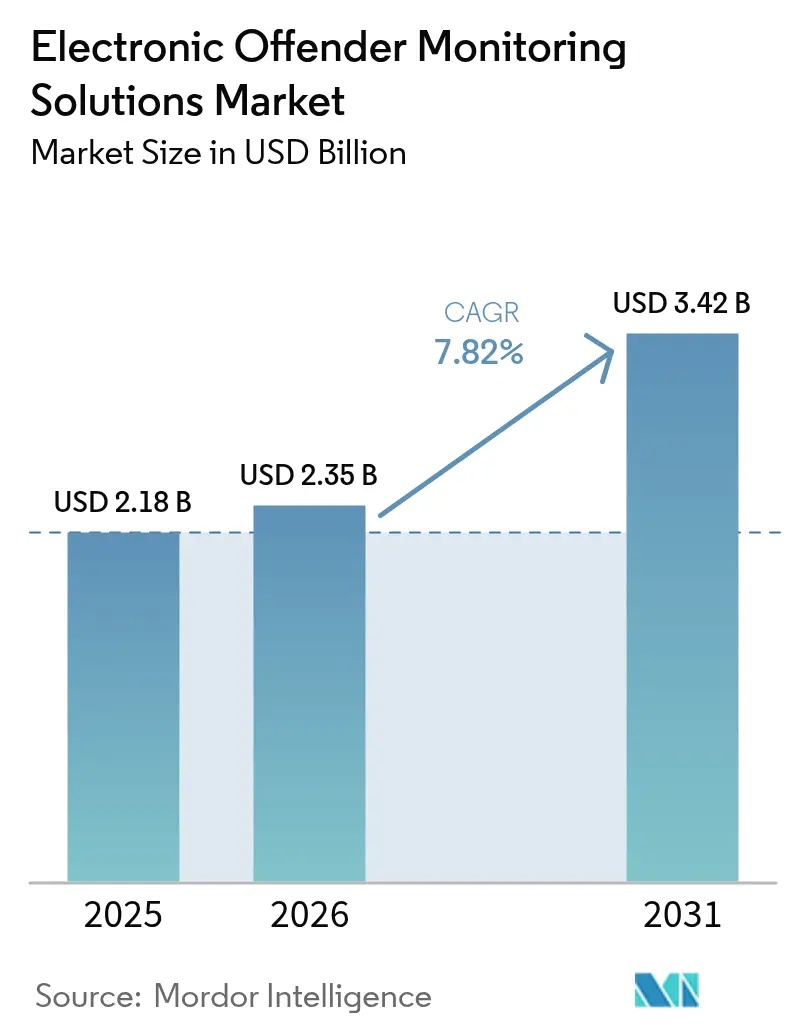
| Market Size (2026) | USD 2.35 Billion |
| Market Size (2031) | USD 3.42 Billion |
| Growth Rate (2026 - 2031) | 7.82 % |
| Fastest Growing Market | Asia Pacific |
| Largest Market | North America |
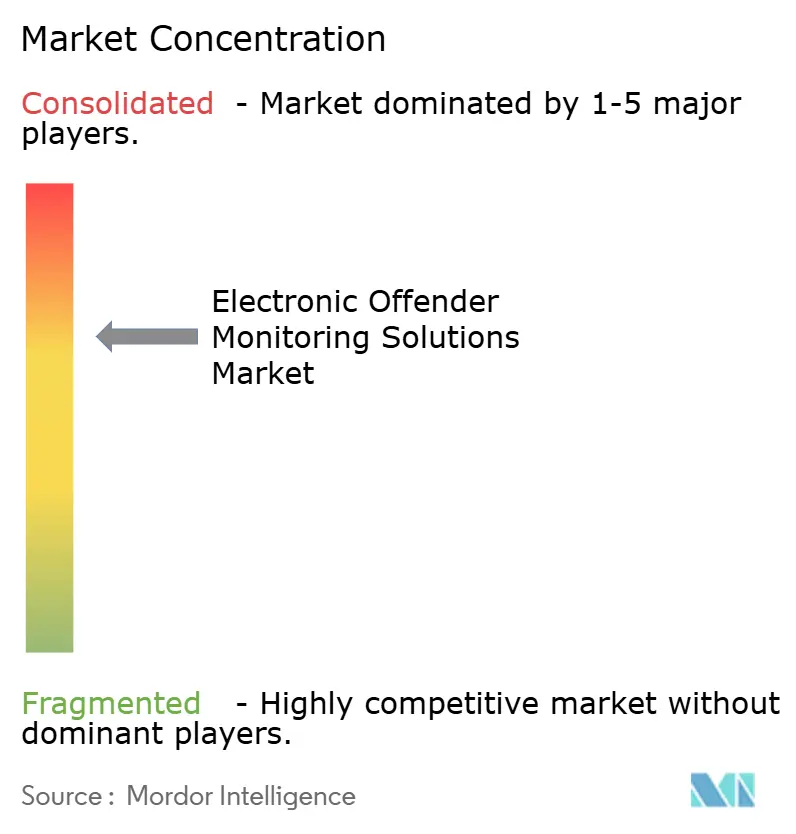
| Market Concentration | Medium |
Major Players *Disclaimer: Major Players sorted in no particular order Image © Mordor Intelligence. Reuse requires attribution under CC BY 4.0. | |
Electronic Offender Monitoring Solutions Market Analysis by Mordor Intelligence
The electronic offender monitoring solutions market size in 2026 is estimated at USD 2.35 billion, growing from 2025 value of USD 2.18 billion with 2031 projections showing USD 3.42 billion, growing at 7.82% CAGR over 2026-2031. The expansion reflects criminal-justice reforms that favor community-based supervision to alleviate prison overcrowding, limit corrections spending, and still protect public safety. Growth momentum is reinforced by statutory mandates for non-custodial sentencing, accelerating uptake of multi-modal ankle devices, and rising investment in cloud-native supervision platforms. Agencies are also adopting cellular IoT connectivity to cut signal dropouts and extend battery life, while predictive analytics improve caseload triage and early-warning alerts. Sustained contract renewals in North America, rapid policy changes in Asia-Pacific, and expanding domestic-violence programs across Europe underscore a broad demand base that buffers the electronic offender monitoring solutions market against cyclical funding fluctuations.
Key Report Takeaways
- By technology, GPS solutions led with 67.60% electronic offender monitoring solutions market share in 2025, while LTE-M/NB-IoT hybrid systems are projected to grow at an 8.49% CAGR to 2031.
- By offering, hardware and wearables accounted for 51.45% of the electronic offender monitoring solutions market size in 2025; SaaS platforms and analytics are set to expand at a 9.33% CAGR through 2031.
- By end-user, adult parole and probation agencies held 59.10% revenue share in 2025, whereas domestic-violence courts represent the fastest-growing segment at a 9.04% CAGR during the forecast period.
- By geography, North America commanded 41.80% of 2025 revenue; Asia-Pacific is forecast to advance at a 8.86% CAGR to 2031.
Note: Market size and forecast figures in this report are generated using Mordor Intelligence’s proprietary estimation framework, updated with the latest available data and insights as of 2026.
Market Trends and Insights
Driver Imapct Analysis of Electronic Offender Monitoring Solutions Market*
| DRIVER | (~) % IMPACT ON CAGR FORECAST | GEOGRAPHIC RELEVANCE | IMPACT TIMELINE |
|---|---|---|---|
| LTE-M/NB-IoT integration in ankle devices | +1.8% | North America, Europe | Medium term (2-4 years) |
| National non-custodial sentencing mandates | +2.1% | North America, Europe, Asia-Pacific | Long term (≥4 years) |
| Expansion of domestic-violence programs | +1.5% | Global (developed markets concentration) | Short term (≤2 years) |
| Cloud-native offender management SaaS | +1.3% | North America, Europe (Asia-Pacific spill-over) | Medium term (2-4 years) |
| Insurance-backed cost-sharing models | +0.9% | North America, early trials in Europe | Long term (≥ 4 years) |
| Government climate-driven push for e-mobility trackers | +0.4% | Europe, select North American jurisdictions | Long term (≥ 4 years) |
| Source: Mordor Intelligence | |||
Integration of LTE-M / NB-IoT into Ankle Devices
Dual-mode cellular IoT replaces single-channel GPS by layering LTE-M or NB-IoT alongside GNSS, Wi-Fi, and RF beacons to maintain location visibility in urban canyons, tunnels, and remote corridors. Sequans’ GM02S modules illustrate this shift with 3GPP Release 14 compliance, eSIM provisioning, and extended battery optimization that lowers daily charge cycles to once every 7–10 days.[1]Source: Sequans Communications, “GM02S LTE-M & NB-IoT Module Product Information,” sequans.com These attributes reduce inadvertent violations stemming from depleted batteries and diminish field-officer workloads linked to power-related alerts. Vendors are embedding over-the-air firmware updates that shield agencies from future spectrum sunsets and permit security patching without device recall. The net result is a performance step-change that supports more stringent curfew windows and tighter exclusion-zone radii. Coupled with tamper sensors and biometric confirmation, next-generation cellular IoT hardware unlocks a scalable path for the electronic offender monitoring solutions market to substitute incarceration for even high-risk categories such as violent recidivists.
National Mandates Favouring Non-Custodial Sentencing
Legislatures worldwide are codifying electronic monitoring as the default alternative to pre-trial detention or low-level prison terms. Japan’s 2023 statute empowers courts to impose GPS tracking on bail-eligible defendants accused of flight-risk offenses, with full rollout scheduled by 2028. In the United Kingdom, amendments enacted in 2024 refine accountability obligations for private providers delivering monitoring services.[2]Source: The National Archives (UK), “The Electronic Monitoring (Responsible Persons) Amendment Order 2024,” legislation.gov.uk Fiscal arithmetic drives the momentum: a USD 6 daily monitoring cost compares favorably with USD 83 for a standard prison bed, producing annual savings greater than USD 28,000 per inmate at state-level corrections budgets. Over the long horizon, compulsory electronic supervision clauses written into sentencing guidelines insulate procurement pipelines from discretionary funding pauses, lifting baseline volumes for devices, data plans, and SaaS licenses across the electronic offender monitoring solutions market.
Escalating Domestic-Violence Protection Programs
Domestic-violence courts are scaling pilot efforts where perpetrators carry GPS ankle bracelets that trigger victim-facing smartphone alerts if exclusion boundaries are breached. Queensland’s Domestic and Family Violence Protection Amendment Bill 2025 institutionalizes a bilateral monitoring framework that assigns simultaneous devices to the accused and the survivor, ensuring 24/7 proximity geofencing backed by real-time police dispatch.[3]Source: Queensland Parliamentary Counsel, “Domestic and Family Violence Protection and Other Legislation Amendment Bill 2025,” legislation.qld.gov.au Similar models in several U.S. states route monitoring data directly into computer-aided-dispatch systems to shrink response times. The emphasis on victim-centric outcomes is prompting public-safety grants earmarked specifically for domestic-abuse tracking, a funding channel that operates independently from mainstream community-corrections appropriations. These vertical program budgets guide procurement specifications toward lighter, discreet wearables with adjustable straps designed to accommodate anatomical differences and mitigate stigma, thereby expanding the served-addressable population for the electronic offender monitoring solutions market.
Cloud-Native Offender Management SaaS Uptake
Courts and probation departments are retiring on-premises case-management silos in favor of cloud suites that fuse scheduling, restitution payments, electronic monitoring feeds, and predictive compliance scoring. Tyler Technologies’ Enterprise Supervision platform automates violation triage and integrates evidence repositories, enabling officers to supervise 25% more cases without adding headcount.[4]Source: Tyler Technologies, “Enterprise Supervision Software Product Sheet,” tylertech.comMulti-tenant architecture supports agile feature releases and data-sovereignty configurations aligned with GDPR and the California Consumer Privacy Act, two benchmarks now mirrored in draft Asia-Pacific privacy codes. Cloud micro-services also decouple software releases from hardware lifecycles, allowing agencies to extend legacy GPS bracelets via open APIs instead of forced mass replacements. These efficiencies accelerate total cost-of-ownership reductions, a decisive factor when legislative bodies scrutinize corrections allocations. As more jurisdictions sign statewide master agreements, California’s superior-court consortium renews through 2029 recurring SaaS revenue becomes the fastest-climbing line item in the electronic offender monitoring solutions market size calculus.
Restraints Impact Analysis of Electronic Offender Monitoring Solutions Market*
| RESTRAINTS | (~) % IMPACT ON CAGR FORECAST | GEOGRAPHIC RELEVANCE | IMPACT TIMELINE |
|---|---|---|---|
| High device failure and replacement costs | −1.4% | Global (rural counties pronounced) | Short term (≤2 years) |
| GDPR-style privacy litigation exposure | −0.8% | Europe (spreading to North America, Asia-Pacific) | Medium term (2-4 years) |
| Public opinion backlash on continuous biometric tracking | -0.4% | North America and Europe, emerging in Asia-pacific democracies | Long term (≥ 4 years) |
| Cellular-dead-zone risk in rural monitoring | -0.6% | Rural areas globally, concentrated in developing regions | Medium term (2-4 years) |
| Source: Mordor Intelligence | |||
High Device Failure–Replacement Costs
Lost, damaged, or tampered units erode operating budgets, particularly in rural counties where offender poverty rates hinder cost recovery through user fees. La Crosse County documented 84 missing devices over a two-year window, offsetting the USD 6 per-day savings enjoyed when units remain functional.[5]Source: SuperCom Ltd., “Investor Presentation 2025,” supercom.com Engineering breakthroughs, such as sealed casings that resist submersion and tamper circuitry that survives attempted strap cut-through, are narrowing failure windows, yet the capital-outlay risk transfers to small agencies that lack insurance pools. Device-leasing models and social-impact bonds financed by private insurers are emerging stopgaps, but until unit durability matches parole-cycle length, replacement spending will constrain margin expansion inside the electronic offender monitoring solutions market.
Stringent GDPR-Style Data-Privacy Litigation Exposure
Europe’s data-protection regime obligates corrections agencies to articulate necessity, proportionality, and storage minimization for every dataset generated by location bracelets. Vendor roadmaps now embed anonymization layers, time-bound retention policies, and subject-access portals to preempt lawsuits that can halt procurements for months. The rigor is contagious: several U.S. districts require privacy-impact assessments modeled after EU templates, and India’s high court is weighing whether GPS mandates infringe constitutional privacy guarantees. Compliance redesign inflates research and development overhead and demands third-party audits that lengthen deployment cycles by up to six months. Although privacy safeguards elevate public trust, the associated cost drag slices 80–100 basis points off forecast margins for cloud-hosted monitoring ecosystems within the electronic offender monitoring solutions market.
*Our forecasts treat driver/restraint impacts as directional, not additive. The impact forecasts reflect baseline growth, mix effects, and variable interactions.
Electronic Offender Monitoring Solutions Market Segment Analysis
By Technology:
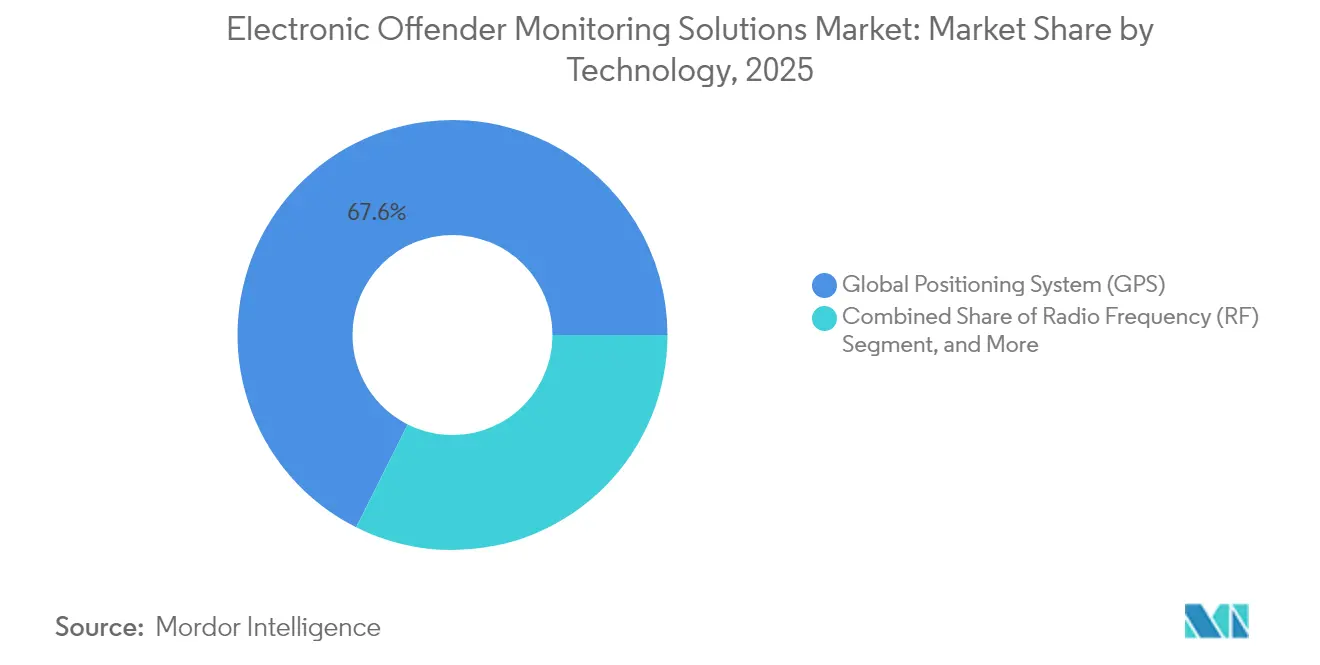
Cellular IoT Broadens Coverage HorizonsGPS devices held 67.60% of the electronic offender monitoring solutions market share in FY2025. Their ubiquity springs from proven accuracy and court familiarity, yet blind spots persist in multistory buildings and underground transit. LTE-M/NB-IoT hybrids, advancing at an 8.49% CAGR, overlay low-band cellular channels so that bracelets stay latched onto network towers even when satellites fail, cutting location-blackout minutes by 40% in dense urban grids. RF beacons retain value for curfew compliance, highlighting that agencies often deploy mixed-technology portfolios tailored to offense severity and budget.
Adoption dynamics pivot on lifecycle economics: LTE-M modules command a 15–20% price premium but halve maintenance call-outs tied to manual reboots or battery swaps. Firmware-as-a-service allows detectives to flash geofence libraries remotely, eliminating courthouse visits for device re-enrollment. These operational savings entice procurement teams to phase out legacy GSM bracelets well ahead of regional 2G sunsets, fortifying total revenue visibility for technology suppliers across the electronic offender monitoring solutions market.



By Offering:
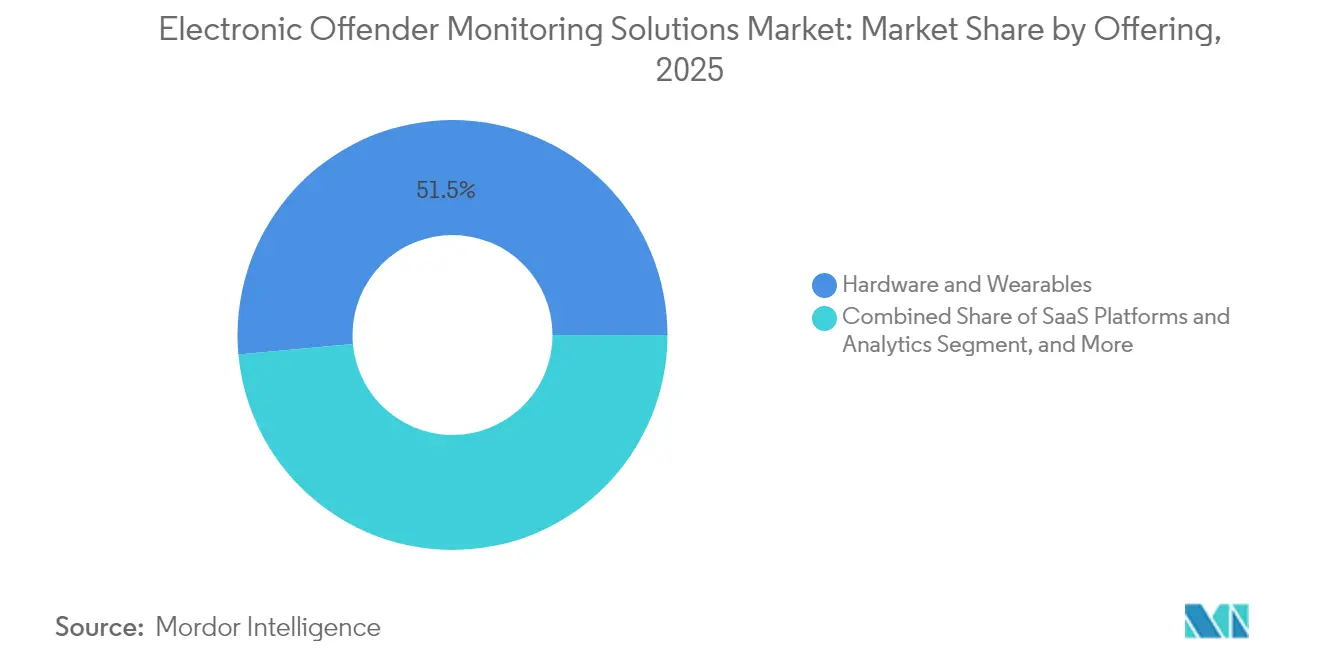
SaaS Platforms Reshape Revenue MixHardware and wearables comprised 51.45% of 2025 revenue, positioning device production as the anchor of the electronic offender monitoring solutions market size. Yet software subscriptions and analytics will capture disproportionate incremental value through 2031, owing to predictable ARR structures and cross-sell elasticity into sentencing, restitution, and rehabilitation modules. Enterprise cloud dashboards bundle AI-driven risk scoring that elevates violation-prediction accuracy by 25 percentage points over rule-based systems.
Managed monitoring services increasingly appeal to counties with fewer than 500 active supervisees, transferring 24/7 alarm triage and officer dispatch to vendor control centers. This full-stack outsourcing converts capex to opex, an accounting maneuver favored when municipal bond ceilings cap new borrowing. As wearable costs continue their gradual deflation, platform monetization will propel blended gross-margin expansion from the high-30% band toward mid-40% levels by 2031, cementing SaaS as the long-term growth nucleus of the electronic offender monitoring solutions industry.
By End-User:
Domestic-Violence Courts Accelerate AdoptionAdult parole and probation agencies managed nearly 60% of monitored individuals in 2025, upholding their dominance within the electronic offender monitoring solutions market. They emphasize graduated sanctions, so device fleets span baseline RF units for low-risk supervisees to LTE-M multi-sensor bracelets for violent felons. Domestic-violence courts, however, will outpace every other cohort with 9.04% CAGR as awareness of intimate-partner fatalities spurs compulsory GPS tagging statutes.
Program design trends point to bilateral device assignment, where survivors carry discreet beacons that synchronize with perpetrator bracelets for real-time separation distance analytics. Embedded panic buttons pipe duress signals directly into 911 CAD platforms, shortening intervention windows when protective orders are breached. Juvenile departments and immigration authorities sustain stable, single-digit expansion because political debate over youth surveillance and asylum-seeker tracking tempers device rollouts. Collectively, diversified end-user demand insulates suppliers from macro budget swings while broadening the functional spec sheet for next-generation offerings across the electronic offender monitoring solutions market.
Geography Analysis
North America Electronic Offender Monitoring Solutions Market
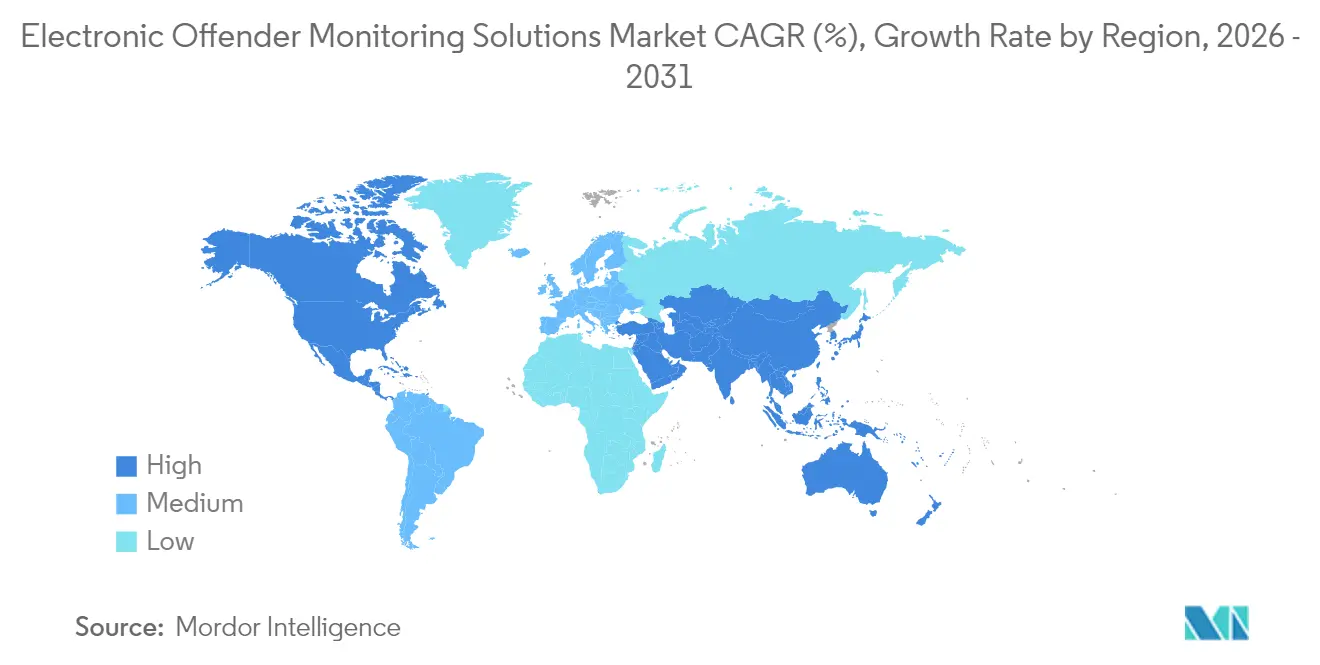
North America remains the revenue powerhouse with a 41.80% share in 2025, undergirded by multi-decade operational maturity and coordinated vendor certification pipelines. U.S. installations expanded from 53,000 monitored persons in 2005 to nearly 500,000 by 2022, representing a 9× volume surge that normalized electronic monitoring as a mainstream supervision lever. Canada layers provincial programs that pair GPS with transdermal alcohol sensors, deepening per-capita spend despite a smaller supervisee pool.
Europe Electronic Offender Monitoring Solutions Market
Europe contributes a sizable slice to the electronic offender monitoring solutions market size through standardized procurements that require GDPR-compliant encryption and edge-device data minimization. The United Kingdom reported 20,893 active tags in June 2024, a 17% annual jump fueled by a 34% expansion in GPS devices and a 38% climb in alcohol tags. France, Germany, and the Nordics broaden domestic-violence frameworks, funneling stimulus funds into pilot programs that emphasize cross-border interoperability for offenders relocating within the Schengen zone. Strict privacy vetting elongates tender cycles but elevates device ASPs owing to mandatory on-chip encryption modules and sovereign-cloud hosting, creating a margin tailwind for compliant suppliers.
APAC Electronic Offender Monitoring Solutions Market
Asia-Pacific leads in growth velocity with a 8.86% CAGR projection through 2031. Japan’s five-year implementation plan covers court-ordered GPS for bail-risk defendants and prospective sex-offender tracking, anchoring early-cycle revenue visibility. India’s justice-digitization statutes recognize electronic evidence and video hearings, constructing foundational rails for e-monitoring deployments once pilot evaluations conclude. South Korea fine-tunes its 24-hour satellite shadowing of violent offenders, while Australia expands state-level domestic-violence programs with bilateral devices. Although regulatory heterogeneity complicates one-size-fits-all SKUs, regional suppliers benefit from governments’ appetite to leapfrog legacy RF solutions straight into cellular IoT architectures, expanding addressable revenue across the electronic offender monitoring solutions market.

Regulatory Landscape
Regulation is tightening around program eligibility, vendor accountability, and data governance as electronic monitoring becomes embedded in sentencing and release conditions. In the United Kingdom, The Compulsory Electronic Monitoring Licence Condition (Amendment) Order 2026 (made 7 July 2026, in force 2 September 2026) updates how electronic monitoring can be applied as a licence condition, and the Sentencing Act 2026 and related Crime and Policing Act 2026 provisions link tagging capacity to wider community-sentencing policy. The UK National Audit Office (July 2026) also increased scrutiny on service resilience following the October 2023 transition to Serco and Allied Universal Electronic Monitoring, reinforcing the operational and reporting obligations that shape tender requirements.
Privacy and performance standards are also filtering into product specifications and procurement timetables across major markets. Scotland's The Electronic Monitoring (Use of Devices and Information) (Scotland) Regulations 2025 set explicit governance on use of devices and information, including a maximum 12-year retention period for GPS monitoring data and formalized sharing protocols with justice bodies such as Police Scotland and the Crown Office. In North America, frameworks such as NIJ Standard-1004.00 for Offender Tracking Systems (OTS) provide voluntary technical and safety benchmarks, while state-level rules such as South Carolina certification requirements for monitoring agencies and California regulations for electronic monitoring programs create compliance checkpoints that raise barriers for new entrants and favor vendors with mature quality, documentation, and audit processes.
Value Chain Analysis
The value chain covers specialized hardware design and manufacturing (ankle and wrist devices, tamper detection, and power systems), connectivity and location enablers (GNSS and cellular IoT modules, plus SIM and eSIM provisioning and carrier relationships), and a growing software layer (cloud case management, alerting, analytics, and APIs into justice systems). Upstream component availability and lifecycle management matter as agencies move away from legacy networks, and device OEMs and module suppliers increasingly align roadmaps around over-the-air firmware updates and security patching. Midstream participants include platform providers such as Corrisoft (supervision management software suites) and integrated vendors such as BI Incorporated, which combine devices, cloud dashboards, and service delivery.
Downstream, procurement and delivery are shaped by public-sector frameworks and service-operating models. Large framework contracts such as New York State Office of General Services Award 23300 (valid until November 2026) and statewide term contracts such as North Carolina's 915C standardize specifications and vendor onboarding, while UK Ministry of Justice models separate device and system components from services to manage integration, field operations (installation, fitting, and removal), and monitoring center workflows. Implementation partners and service integrators, such as Sentinel Offender Services and national justice framework operators such as Fennix Global, sit closest to agencies for enrollment, compliance response, and 24/7 alert triage; their ability to integrate with courts, probation and parole, and police dispatch systems becomes a practical differentiator that can drive recurring integration cost and timeline risk.
Competitive Landscape
Moderate fragmentation defines the electronic offender monitoring solutions market, with the top five vendors controlling just under 60% of global revenue in 2024. BI Incorporated capitalizes on multi-state master contracts by bundling hardware leasing with cloud dashboards, cutting per-unit service costs for cash-strapped probation departments. Track Group renews statewide agreements, such as its 2025 Virginia Department of Corrections extension, adding breath-alcohol mobile units to deepen wallet share. SuperCom leverages pure-one technology coupled with back-office managed services to secure county sheriff contracts across South Dakota and deliver 16,000 active monitors in Europe.
Strategic thrust now orbits vertical integration. Vendors operating device factories, cellular MVNOs, and AI-enabled SaaS suites command end-to-end economics, making it harder for hardware-only rivals to compete on total-cost propositions. Cellular IoT chipset suppliers such as Sequans forge design wins that embed GNSS and low-power wake-on-motion features, amplifying differentiation for OEM partners. Meanwhile, disruptors like eHawk promote smartphone-centric supervision, but judiciary skepticism over tamper vulnerability and handset affordability curbs penetration among high-risk cohorts.
Regulatory convergence around privacy accelerates demand for zero-trust architectures and sovereign-cloud hosting, a shift that rewards vendors with ISO 27001 credentials and in-house security operations centers. The competitive script also spotlights bilateral monitoring tagging both offender and victim as a white-space niche where first movers can capture premium pricing. As contracts lengthen to five- or seven-year terms with automatic renewal clauses, incumbent incumbency advantages harden, raising entry barriers and shaping a stable but innovation-intensive electronic offender monitoring solutions industry landscape.
Electronic Offender Monitoring Solutions Industry Leaders
SCRAM Systems
Track Group, Inc.
SuperCom Ltd.
BI Incorporated (GEO Group)
Attenti Group (Allied Universal Electronic Monitoring)
- *Disclaimer: Major Players sorted in no particular order
Electronic Offender Monitoring Solutions Market Companies Covered in this Report
- Attenti Group (Allied Universal Electronic Monitoring)
- BI Incorporated (The GEO Group, Inc.)
- SCRAM Systems (Alcohol Monitoring Systems, Inc.)
- Track Group, Inc.
- SuperCom Ltd.
- Sentinel Offender Services, LLC
- Buddi Ltd.
- GEOSATIS SA
- Shadowtrack Technologies, Inc.
- Corrisoft LLC
- Tarheel Monitoring LLC
- Laipac Technology, Inc.
- SafeTracks GPS Canada Inc.
- Seahawk Monitoring
- MEGASTEK Ltd.
- Thinkrace Technology Co., Ltd.
- Guardian Ankle Monitoring Service
- Amber360 (Shenzhen Chenqi Technology Co.)
- Trk USA Inc.
- Securus Technologies LLC
- Omnilink Solutions LLC
- Synergye International
- Satellite Tracking of People LLC
- G4S Monitoring Technologies Ltd.
- Guardian RMS (US)
Read Analysis of Electronic Offender Monitoring Solutions Companies

Market Opportunities and Future Outlook
Program scale-up and vendor switching activity are opening near-term whitespace for suppliers able to support resilient national or multi-jurisdiction deployments, with service operations that fit procurement expectations. In Europe, the United Kingdom has an active policy push to expand community-based sentencing capacity via the Sentencing Act 2026 and related provisions, while the Ministry of Justice and HMPPS are executing a "Stabilise, Scale and Transform EM" (STEM) plan after service-performance issues cited by the UK National Audit Office in July 2026. Those steps shift emphasis toward operational reliability, standardized reporting, and integration-ready platforms, not standalone devices.
There is also opportunity in jurisdictions moving toward direct-to-vendor contracting and broader modality coverage, such as GPS combined with alcohol and drug monitoring, under unified supervision workflows. SuperCom's 2026 wins, including a launched national project with Norway's Prison and Probation Service (published budget USD 6.1 million) and a national contract launch with Sweden Prison and Probation Services (published budget up to USD 75 million), point to procurement appetite for turnkey deployments that combine devices, software, and managed monitoring. In the United States, SuperCom reported multiple new state entries and agency awards during 2026, reflecting continued tender activity and incumbent displacement, particularly as agencies upgrade device fleets to avoid legacy network sunsets and to add OTA-updatable, cryptographically protected IoT hardware. Alongside this, guidance from bodies such as UNODC on safeguards and proportionality is pushing vendors to productize privacy-by-design features such as retention controls, access logs, and secure update channels, which supports demand for compliant cloud-native supervision suites that reduce integration burden for courts and probation departments.
Recent Industry Developments in Electronic Offender Monitoring Solutions Market
- June 2026: SuperCom signed and launched a national electronic monitoring contract with Sweden Prison and Probation Services, with a published budget up to USD 75 million. The rollout expands SuperCom's footprint in European national-scale programs and increases competitive pressure on incumbent providers across large framework procurements.
- August 2025: SCRAM Systems acquired PharmChem, adding the PharmChek Drugs of Abuse Sweat Patch to its portfolio. The acquisition extends SCRAM's substance-testing capabilities alongside monitoring workflows, enabling agencies to bundle compliance modalities under fewer vendors.
- May 2024: The United Kingdom's electronic monitoring service continued under the post-transition environment following the October 2023 procurement shift to Serco and Allied Universal Electronic Monitoring. The operating model change increased focus on service resilience and data-quality reporting, shaping how subsequent tenders and performance oversight were structured.


Electronic Offender Monitoring Solutions Market Report Scope and Research Methodology
Market Definition and Coverage
This market covers electronic monitoring technologies and related services used by justice and public safety programs to track and supervise offenders outside custodial settings, using devices, software platforms, and monitoring operations tied to supervision outcomes.
Scope exclusions: We exclude general law enforcement IT that does not directly support offender tracking, as well as broader prison facility security systems that are not used for community supervision.
Segments Covered in This Report
- By Technology
- Radio Frequency (RF)
- Global Positioning System (GPS)
- LTE-M / NB-IoT Hybrid
- Bluetooth-Low-Energy Tether
- By Offering
- Hardware and Wearables
- SaaS Platforms and Analytics
- Managed Monitoring Services
- By End-user
- Adult Parole and Probation Agencies
- Juvenile Justice Departments
- Immigration and Border Enforcement
- Domestic-Violence Courts
- By Geography
- North America
- United States
- Canada
- Mexico
- South America
- Brazil
- Argentina
- Rest of South America
- Europe
- Germany
- United Kingdom
- France
- Russia
- Rest of Europe
- Asia-Pacific
- China
- Japan
- India
- South Korea
- South-East Asia
- Rest of Asia-Pacific
- Middle East and Africa
- Middle East
- Saudi Arabia
- United Arab Emirates
- Rest of Middle East
- Africa
- South Africa
- Egypt
- Rest of Africa
- Middle East
- North America
Data Sources, Market Sizing, and Validation
Desk Research
Desk research starts by mapping the real demand pool for electronic monitoring, which is anchored in probation, parole, pretrial, and alternative-to-detention programs. We review public justice statistics and program signals from sources such as the US Bureau of Justice Statistics, Eurostat, UNODC, and national corrections or interior ministry publications, which helps frame supervised populations and the policy direction.
To translate demand into revenue, we also check procurement and pricing context using items such as government tender portals, budget documents, and audit reports, then cross-reference standards and guidance from bodies such as NIJ and relevant ISO publications. Company filings, investor materials, and reputable press are used to validate directionally where revenues sit across devices, software, and monitoring services, and then a paid subscription for company financials and a global contracts and tenders database are used selectively to reduce gaps. These desk research sources are illustrative and not exhaustive, and many other public and paid references were used for data collection, validation, and clarification.
Primary Interviews and Surveys
Primary work is used to validate what desk research cannot fully show, especially adoption intensity, typical contract structures, and how programs choose between RF and GPS based monitoring. We speak with monitoring program administrators, justice procurement staff, solution operations leaders, and integrators across APAC, EMEA, and the Americas, and then re-check key assumptions on pricing, service attachment, and renewal cycles before finalizing the model.
Distribution of primary research fieldwork respondents
| Company type | Respondent position | Region |
|---|---|---|
| Top tier: 36% | CXOs: 18% | APAC: 47% |
| Mid tier: 46% | Functional/Unit leaders: 40% | EMEA: 32% |
| Smaller Players: 18% | Managers: 42% | Americas: 21% |
Market-Sizing & Forecasting
Sizing is built using a top-down approach where justice supervision populations and program adoption rates are converted into monitored cohorts, which are then translated into annual spending using typical device counts, monitoring days, and contract pricing patterns. Once that ceiling is formed, selective bottom-up approximations are used to corroborate totals, including sampled contract value checks, supplier revenue splits by geography, and channel conversations around device replacement cycles.
Key inputs used in the model include the size of probation and parole populations, pretrial supervision volumes, electronic monitoring program penetration, average monitoring duration (days per case), device mix between RF and GPS, and the share of spending tied to services versus solutions. Because pricing can vary by contract type, we normalize rates into common annualized terms and handle data gaps by applying conservative ranges that are later narrowed through expert feedback. Forecasts are generated using scenario analysis that flexes policy momentum, budget availability, and program expansion speed, and then the final trajectory is aligned to what interviewees expect for technology shift toward GPS and service outsourcing.
Data Validation & Update Cycle
Validation happens through stepwise checks that compare outputs against independent signals like program enrollment disclosures, tender volumes, and known contract timing patterns, followed by sanity checks at regional and global totals. When variances look unusual, assumptions are revisited and specific interview follow-ups are triggered to confirm whether the change is scope related, pricing related, or driven by a one-time contract event.
Before sign-off, an analyst reviews the full calculation chain, and then a second reviewer checks the logic, units, and currency conversions so errors do not carry into the final model. Reports are refreshed annually, and interim updates are made when material events occur, such as large program awards, regulatory changes, or budget resets. Right before delivery, we do a fresh pass to confirm that the latest public signals and interview learnings are reflected.
Mordor Intelligence's Global Electronic Offender Monitoring Solutions Market Size Measured Against Other Published Estimates
Published market values for electronic offender monitoring can differ quite a bit, even when the topic name sounds identical. The largest differences usually come from what is counted as revenue, which geographies are included, and whether the estimate is tied to supervision demand signals or mainly to supplier narratives.
Key gap drivers tend to be scope choices and the way pricing is treated over time, especially how device-led revenue is separated from monitoring services and how multi-year contracts are annualized. Some sources also focus on a limited regional bundle and then generalize it to global totals, and currency timing can shift values if exchange rates and inflation assumptions are not refreshed in the same cycle.
Benchmark comparison
| Source | Market Size | Gaps in Research Methodology |
|---|---|---|
| Mordor Intelligence | USD 2.35 B (2026) | |
| Trade Publisher A | USD 1.60 B (2023) | Often limited to selected regions (commonly North America, Europe, and Latin America) and can undercount APAC and MEA program ramp-ups, which keeps the total lower even before forecasting. |
| Industry Portal B | USD 2.64 B (2025) | Can blend adjacent offender monitoring services and broader supervision support into one bucket, which inflates the value when non-core operational services are not separated from electronic monitoring program spend. |
The table shows that the spread is mostly explained by regional coverage and how service revenue is classified, and then secondarily by the year chosen for the reference point. By tying the modeled spend to supervised cohorts, contract duration, and device mix, the market total stays traceable to repeatable inputs, a scope discipline applied near the end of the modeling workflow by Mordor Intelligence.


Key Questions Answered in the Report
How big is the electronic offender monitoring solutions market in 2026?
The electronic offender monitoring solutions market size stands at USD 2.35 billion in 2026 and is projected to reach USD 3.42 billion by 2031.
What is the expected growth rate of electronic monitoring solutions through 2031?
The market is forecast to expand at a 7.82% CAGR between 2026 and 2031.
Which technology segment grows fastest?
LTE-M/NB-IoT hybrid devices exhibit the quickest rise, recording an 8.49% CAGR over the forecast period.
Why are domestic-violence courts adopting electronic monitoring?
Mandates focused on victim safety drive bilateral GPS programs that reliably enforce exclusion zones and accelerate police response when orders are breached.
Page last updated on:


 Your data is secure and never sold or shared.


