Technology, Media and Telecom
5th MayPricing Strategy for Semiconductor Components
3 Min Read
The Optoelectronics Market Report is Segmented by Device Type (LED, Laser Diode, Image Sensors, and More), Device Material (Gallium Nitride (GaN), Gallium Arsenide (GaAs), Silicon Carbide (SiC), and More), Application (Lighting and Display, Sensing and Imaging, and More), End-User Industry (Automotive, Aerospace and Defense, Consumer Electronics, and More), and Geography. The Market Forecasts are Provided in Terms of Value (USD).
Market Overview
| Study Period | 2019 - 2030 |
|---|---|
| Market Size (2025) | USD 45.79 Billion |
| Market Size (2030) | USD 59.12 Billion |
| Growth Rate (2025 - 2030) | 5.24 % CAGR |
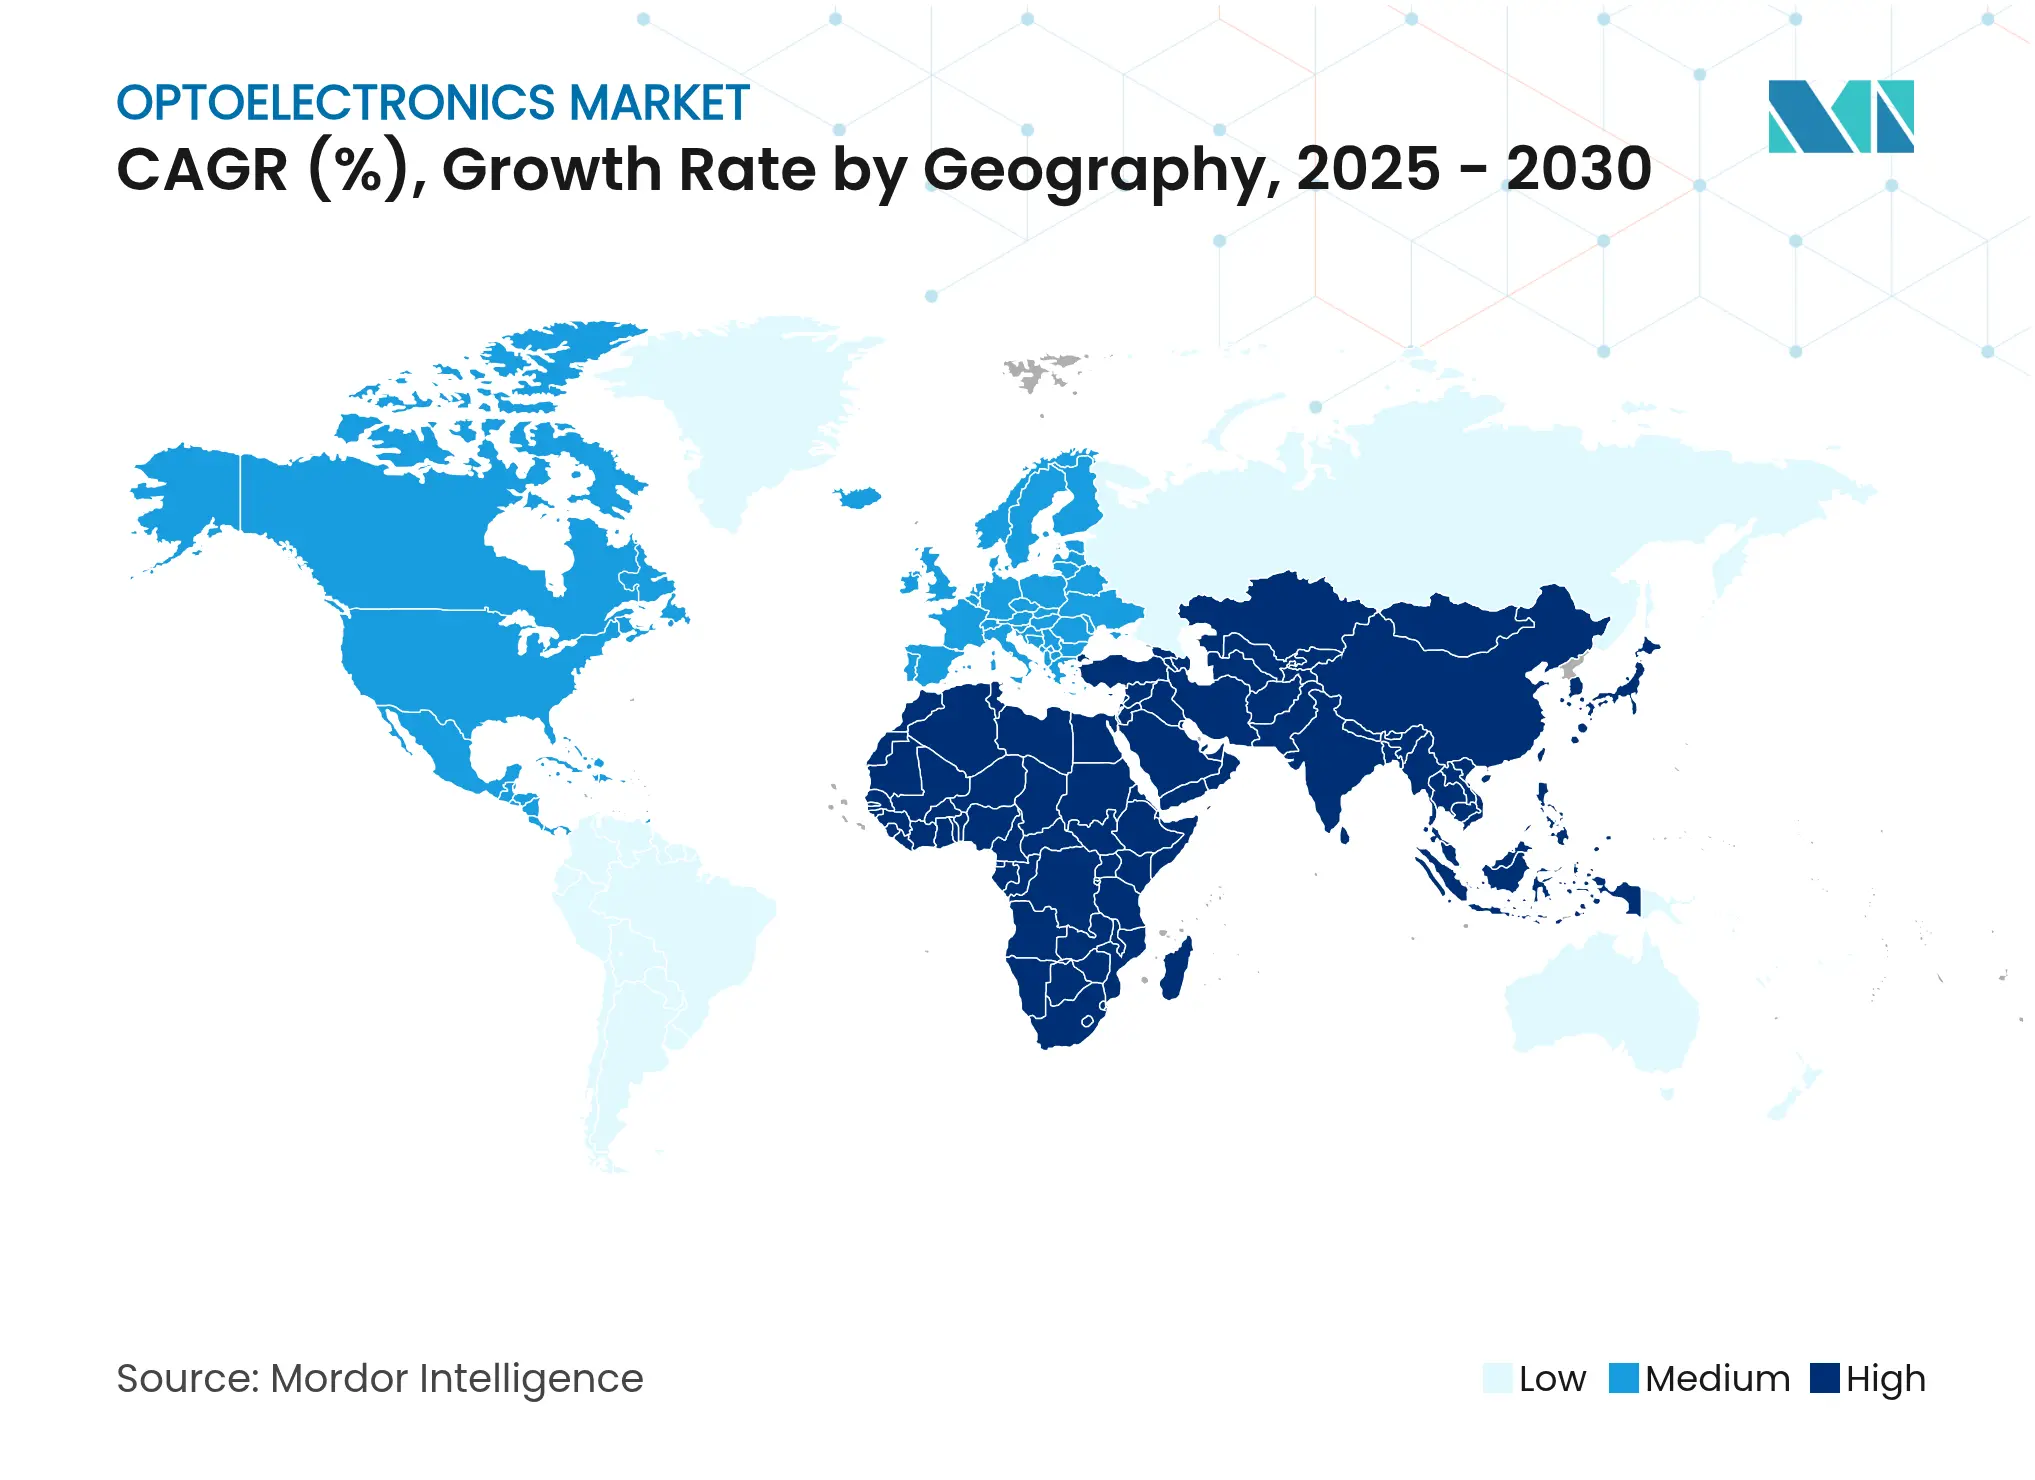
| Fastest Growing Market | Middle East and Africa |
| Largest Market | Asia Pacific |
| Market Concentration | Medium |
Major Players*Disclaimer: Major Players sorted in no particular order. Image © Mordor Intelligence. Reuse requires attribution under CC BY 4.0. |
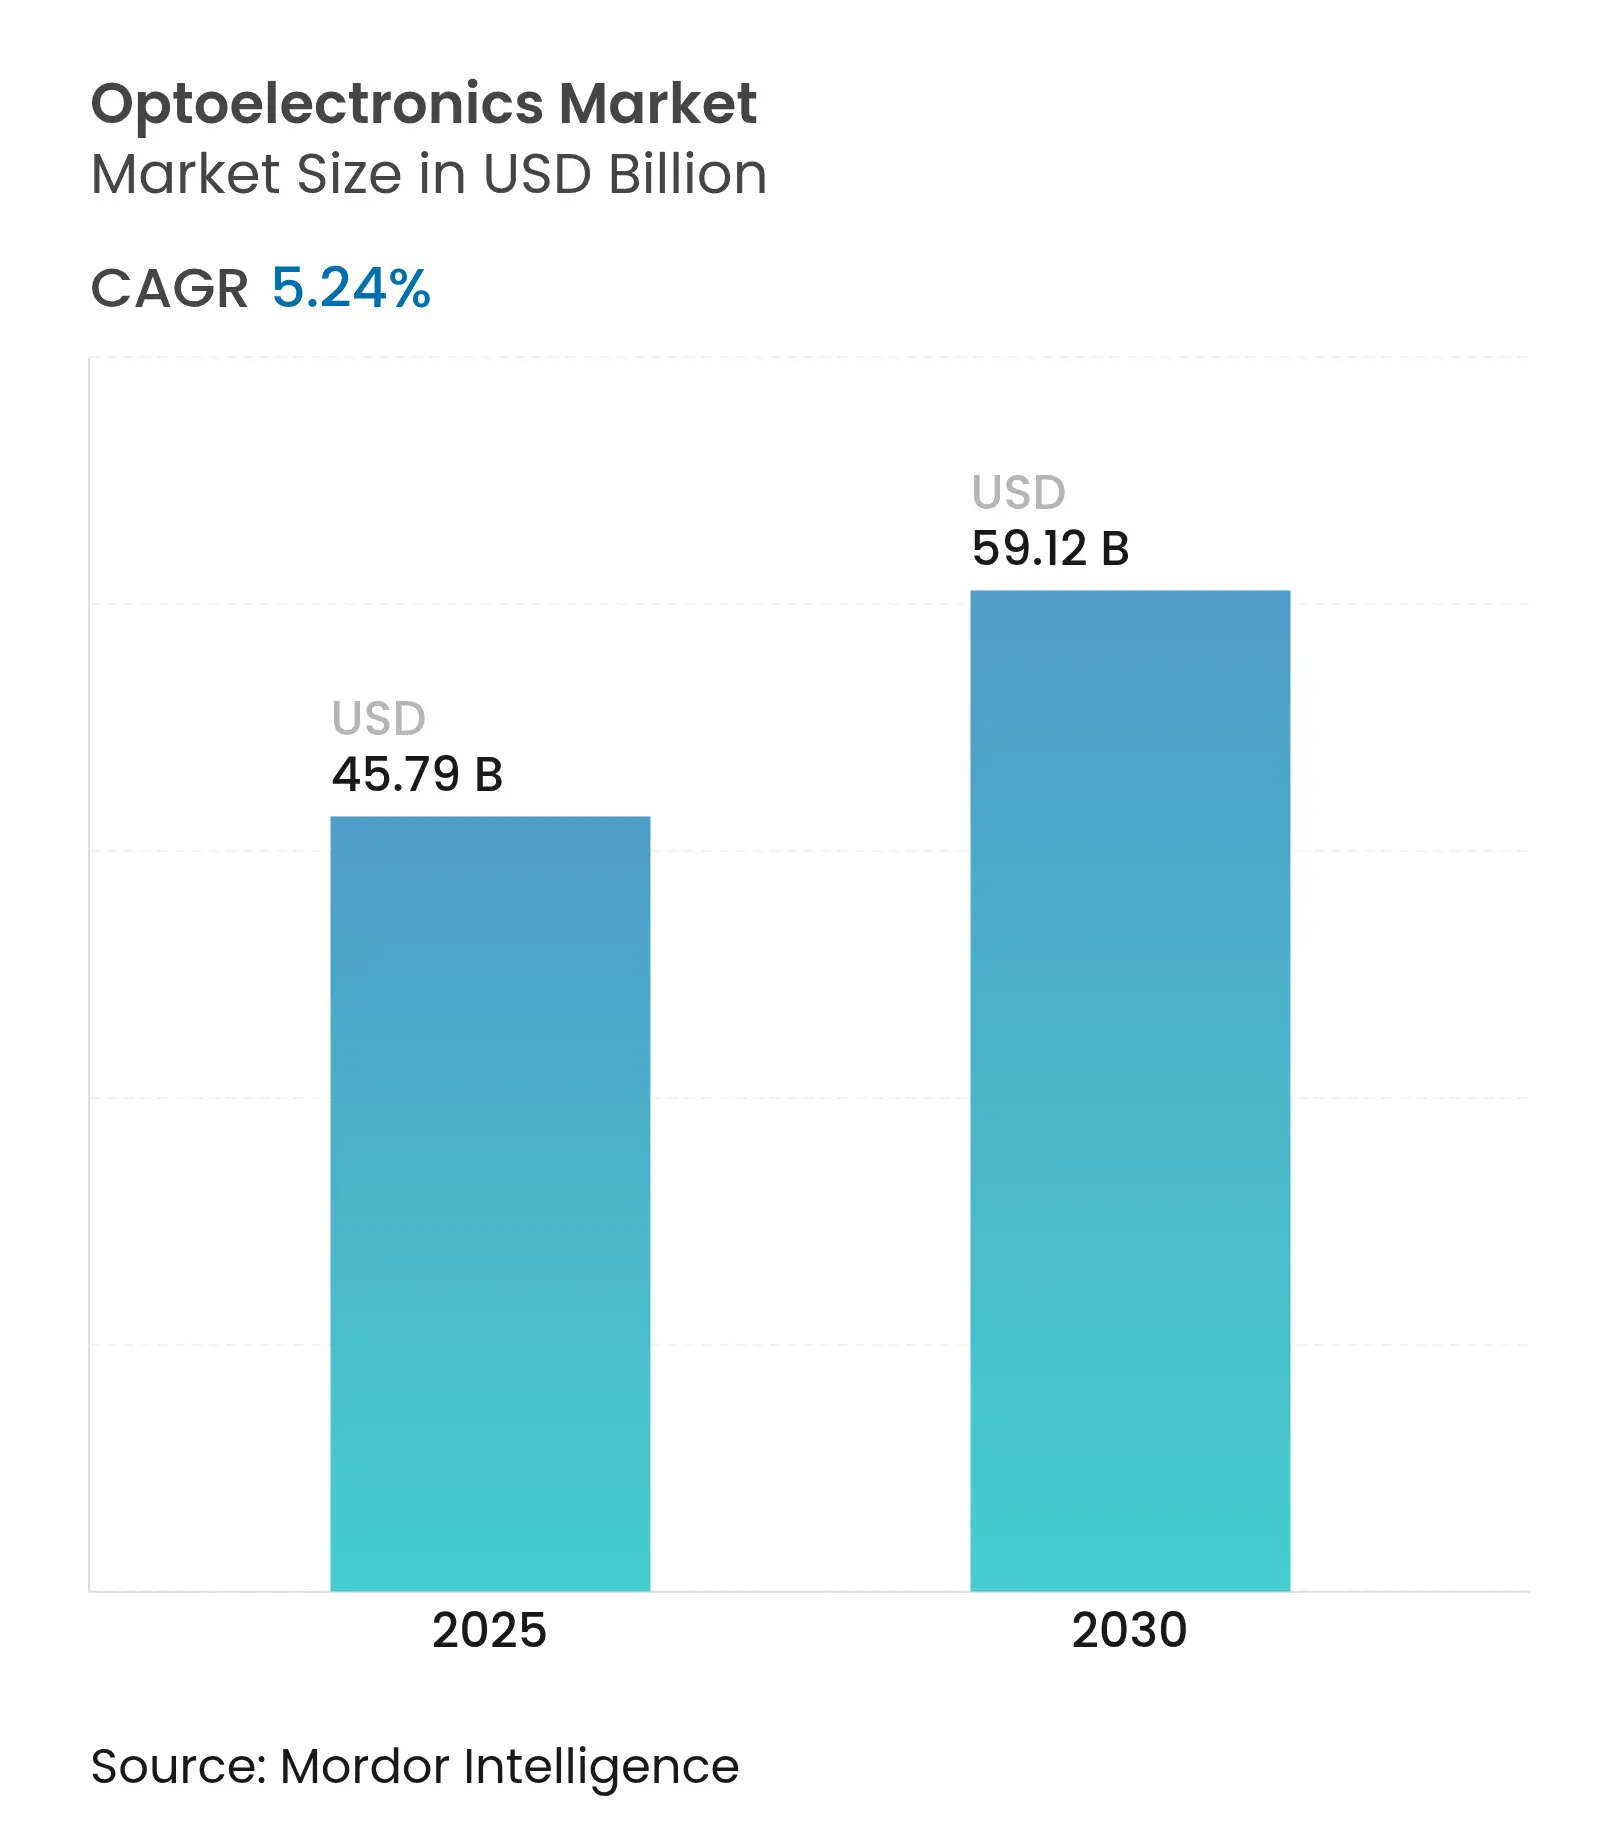
The optoelectronics market size reached USD 45.79 billion in 2025 and is forecast to climb to USD 59.12 billion by 2030 as it advances at a 5.24% CAGR. Demand is broad-based, spanning next-generation 3D sensing in consumer devices, higher-speed optical links for AI-heavy data centers, and advanced lighting and imaging systems in electric vehicles. Device innovation benefits from wide-bandgap materials that operate efficiently at elevated frequencies and temperatures, while policy incentives in Asia and North America encourage regional fabrication to bolster supply-chain resilience. Companies able to integrate metasurface optics or multi-junction VCSEL architectures are positioned to capture premium opportunities, especially where power efficiency and compact form factors are decisive. Across all end uses, buyers increasingly evaluate suppliers on the ability to certify both traceable sourcing of critical inputs and compliance with emerging export-control rules, factors that now influence design-win decisions as much as raw performance.
Key Report Takeaways
Drivers Impact Analysis
| Driver | (~) % Impact on CAGR Forecast | Geographic Relevance | Impact Timeline | |||
|---|---|---|---|---|---|---|
Proliferation of VCSEL-based 3-D Sensing in Asian Smartphones Proliferation of VCSEL-based 3-D Sensing in Asian Smartphones | +1.2% | Asia Pacific, with spillover to North America | Medium term (2-4 years) | (~) % Impact on CAGR Forecast :+1.2% | Geographic Relevance :Asia Pacific, with spillover to North America | Impact Timeline:Medium term (2-4 years) |
Stringent Automotive LED-Lighting Mandates in Europe Stringent Automotive LED-Lighting Mandates in Europe | +0.9% | Europe, with global adoption following | Medium term (2-4 years) | |||
Rapid Roll-out of 400 G Fiber Modules in North-American Data Centers Rapid Roll-out of 400 G Fiber Modules in North-American Data Centers | +1.1% | North America, with expansion to Europe and Asia Pacific | Short term (≤ 2 years) | |||
Government Incentives for GaN LEDs in SE-Asian Smart-City Projects Government Incentives for GaN LEDs in SE-Asian Smart-City Projects | +0.7% | Southeast Asia, with spillover to Middle East | Medium term (2-4 years) | |||
Digital Medical Imaging Boom Driving CMOS Sensors in Japan Digital Medical Imaging Boom Driving CMOS Sensors in Japan | +0.6% | Japan, with global healthcare applications | Long term (≥ 4 years) | |||
Middle-East Defense Modernization Fueling Infra-red Detector Demand Middle-East Defense Modernization Fueling Infra-red Detector Demand | +0.8% | Middle East and Africa | Medium term (2-4 years) | |||
| Source: Mordor Intelligence | ||||||
Proliferation of VCSEL-based 3D sensing in Asian smartphones
Rising demand for secure facial authentication, spatial video capture, and indoor navigation is reinforcing the role of vertical-cavity surface-emitting lasers in flagship handsets. Major brands integrate multi-junction VCSEL arrays that raise optical power while cutting battery drain, ultimately improving user experience.[1]Xiao Y. et al., “Multi-junction Cascaded VCSEL with a High Power Conversion Efficiency of 74%,” nature.comPatent filings by Chinese vendors illustrate a push to localize the full VCSEL stack and reduce dependence on imported epi-wafers, a move aligned with broader semiconductor self-reliance goals. Component suppliers positioned with high-yield epi-growth and advanced testing capacity are securing multi-year supply agreements ahead of under-display 3D sensing roll-outs. As optical-AI co-processors mature, the optoelectronics market anticipates wider adoption of VCSEL-enabled gesture and environment mapping across mid-tier phones as well.
Stringent automotive LED-lighting mandates in Europe
European Union safety standards now favor adaptive LED headlights that minimize glare and improve night driving comfort, pushing carmakers to adopt sophisticated light-domain controllers.[2]Optoelectronics Journal, “On-Chip Light Control of Semiconductor Optoelectronic Devices Using Metasurfaces,” oejournal.orgTier-1 suppliers respond with RGB matrices that enable dynamic beam shaping, brand-signature animations, and energy savings that extend electric-vehicle range. Design cycles increasingly require close collaboration between lighting and thermal teams to meet lumen output and regulation targets without adding cooling mass. The legislation indirectly boosts the optoelectronics market because micro-optics, drivers, and sensors embedded in the modules add value beyond the LED die itself. Global automakers homologating models for Europe tend to propagate the same advanced lighting packages into other regions, broadening unit demand.
Rapid roll-out of 400 G fiber modules in North-American data centers
Cloud and social-media operators are upgrading to 400 G and emerging 800 G links to service AI model training that can exceed 10^26 operations. Silicon-photonics-based transceivers integrate modulators, drivers, and detectors on a single reticle, driving down cost per bit and simplifying line-card design. QSFP-DD remains the preferred form factor because it offers backward compatibility and dense port configurations that preserve rack space in legacy halls. Suppliers able to guarantee compliance with new due-diligence requirements for advanced computing ICs now enjoy preferred-vendor status among hyperscalers. This hardware cycle elevates optical component demand not only in North America but also in regions building sovereign AI compute clusters.
Government incentives for GaN LEDs in Southeast-Asian smart-city projects
Municipal retrofits across ASEAN use wide-bandgap GaN devices in street lighting, signage, and sensor networks to meet energy-efficiency targets while supporting digital-city platforms. Policy grants reduce initial capital outlay, enabling early adoption of adaptive dimming systems tied to traffic and weather data feeds. GaN’s robustness at high junction temperatures lengthens service life in hot, humid climates, raising its cost-of-ownership advantage over legacy sodium lamps. Local foundries that previously produced silicon power devices are re-tooling to fabricate GaN HEMTs and LEDs, accelerating knowledge transfer within the region. These projects enlarge the optoelectronics market by fusing lighting, connectivity, and environmental sensing into a single procurement stream.
Restraints Impact Analysis
| Restraint | (~) % Impact on CAGR Forecast | Geographic Relevance | Impact Timeline | |||
|---|---|---|---|---|---|---|
Chronic GaN-substrate Supply Constraints Chronic GaN-substrate Supply Constraints | -0.8% | Global, with severe impact in Asia Pacific | Medium term (2-4 years) | (~) % Impact on CAGR Forecast :-0.8% | Geographic Relevance :Global, with severe impact in Asia Pacific | Impact Timeline :Medium term (2-4 years) |
High Thermal-management Cost of Consumer VCSEL Arrays High Thermal-management Cost of Consumer VCSEL Arrays | -0.6% | Global consumer electronics manufacturing | Short term (≤ 2 years) | |||
Export-control Barriers on Advanced Image-Sensor Supply Chains Export-control Barriers on Advanced Image-Sensor Supply Chains | -0.7% | Global, with particular impact on China-US trade | Medium term (2-4 years) | |||
LED Price-Erosion Compressing Tier-2 Chinese Margins LED Price-Erosion Compressing Tier-2 Chinese Margins | -0.5% | China, with global pricing implications | Short term (≤ 2 years) | |||
| Source: Mordor Intelligence | ||||||
Chronic GaN-substrate supply constraints
Production of free-standing GaN wafers remains concentrated in a handful of specialized facilities, creating bottlenecks for high-power devices. Makeshift workarounds such as growing GaN on silicon help lower costs but introduce dislocation densities that limit voltage ratings. Governments now treat wide-bandgap substrates as critical assets, offering tax credits for domestic crystal-growth plants to ease strategic risk. Pioneering approaches like Qromis Substrate Technology adapt hetero-epitaxial stacks to 200 mm formats, promising higher throughput and better compatibility with mainstream fabs. While these measures will add capacity over the medium term, short-term shortages continue to prompt allocation prioritization in favor of electric-vehicle and defense programs.
High thermal-management cost of consumer VCSEL arrays
Dense VCSEL matrices in LiDAR-equipped smartphones generate localized heat that undermines efficiency and lifetime if unmanaged. Traditional metal heatsinks add bulk unfit for slim industrial design trends. Recent research demonstrates multi-junction VCSELs achieving 74% power-conversion efficiency, markedly reducing resistive losses. Complementary integration of intra-cavity circular Bragg gratings further stabilizes single-mode operation, trimming excess heat.[3]Hu S. et al., “VCSEL with Intra-Cavity Circular Bragg Gratings for Single-Mode Operation,” aip.orgEven with these advances, packaging houses must still incorporate graphite sheets or vapor chambers, elevating bill-of-material costs until high-efficiency designs reach volume production.
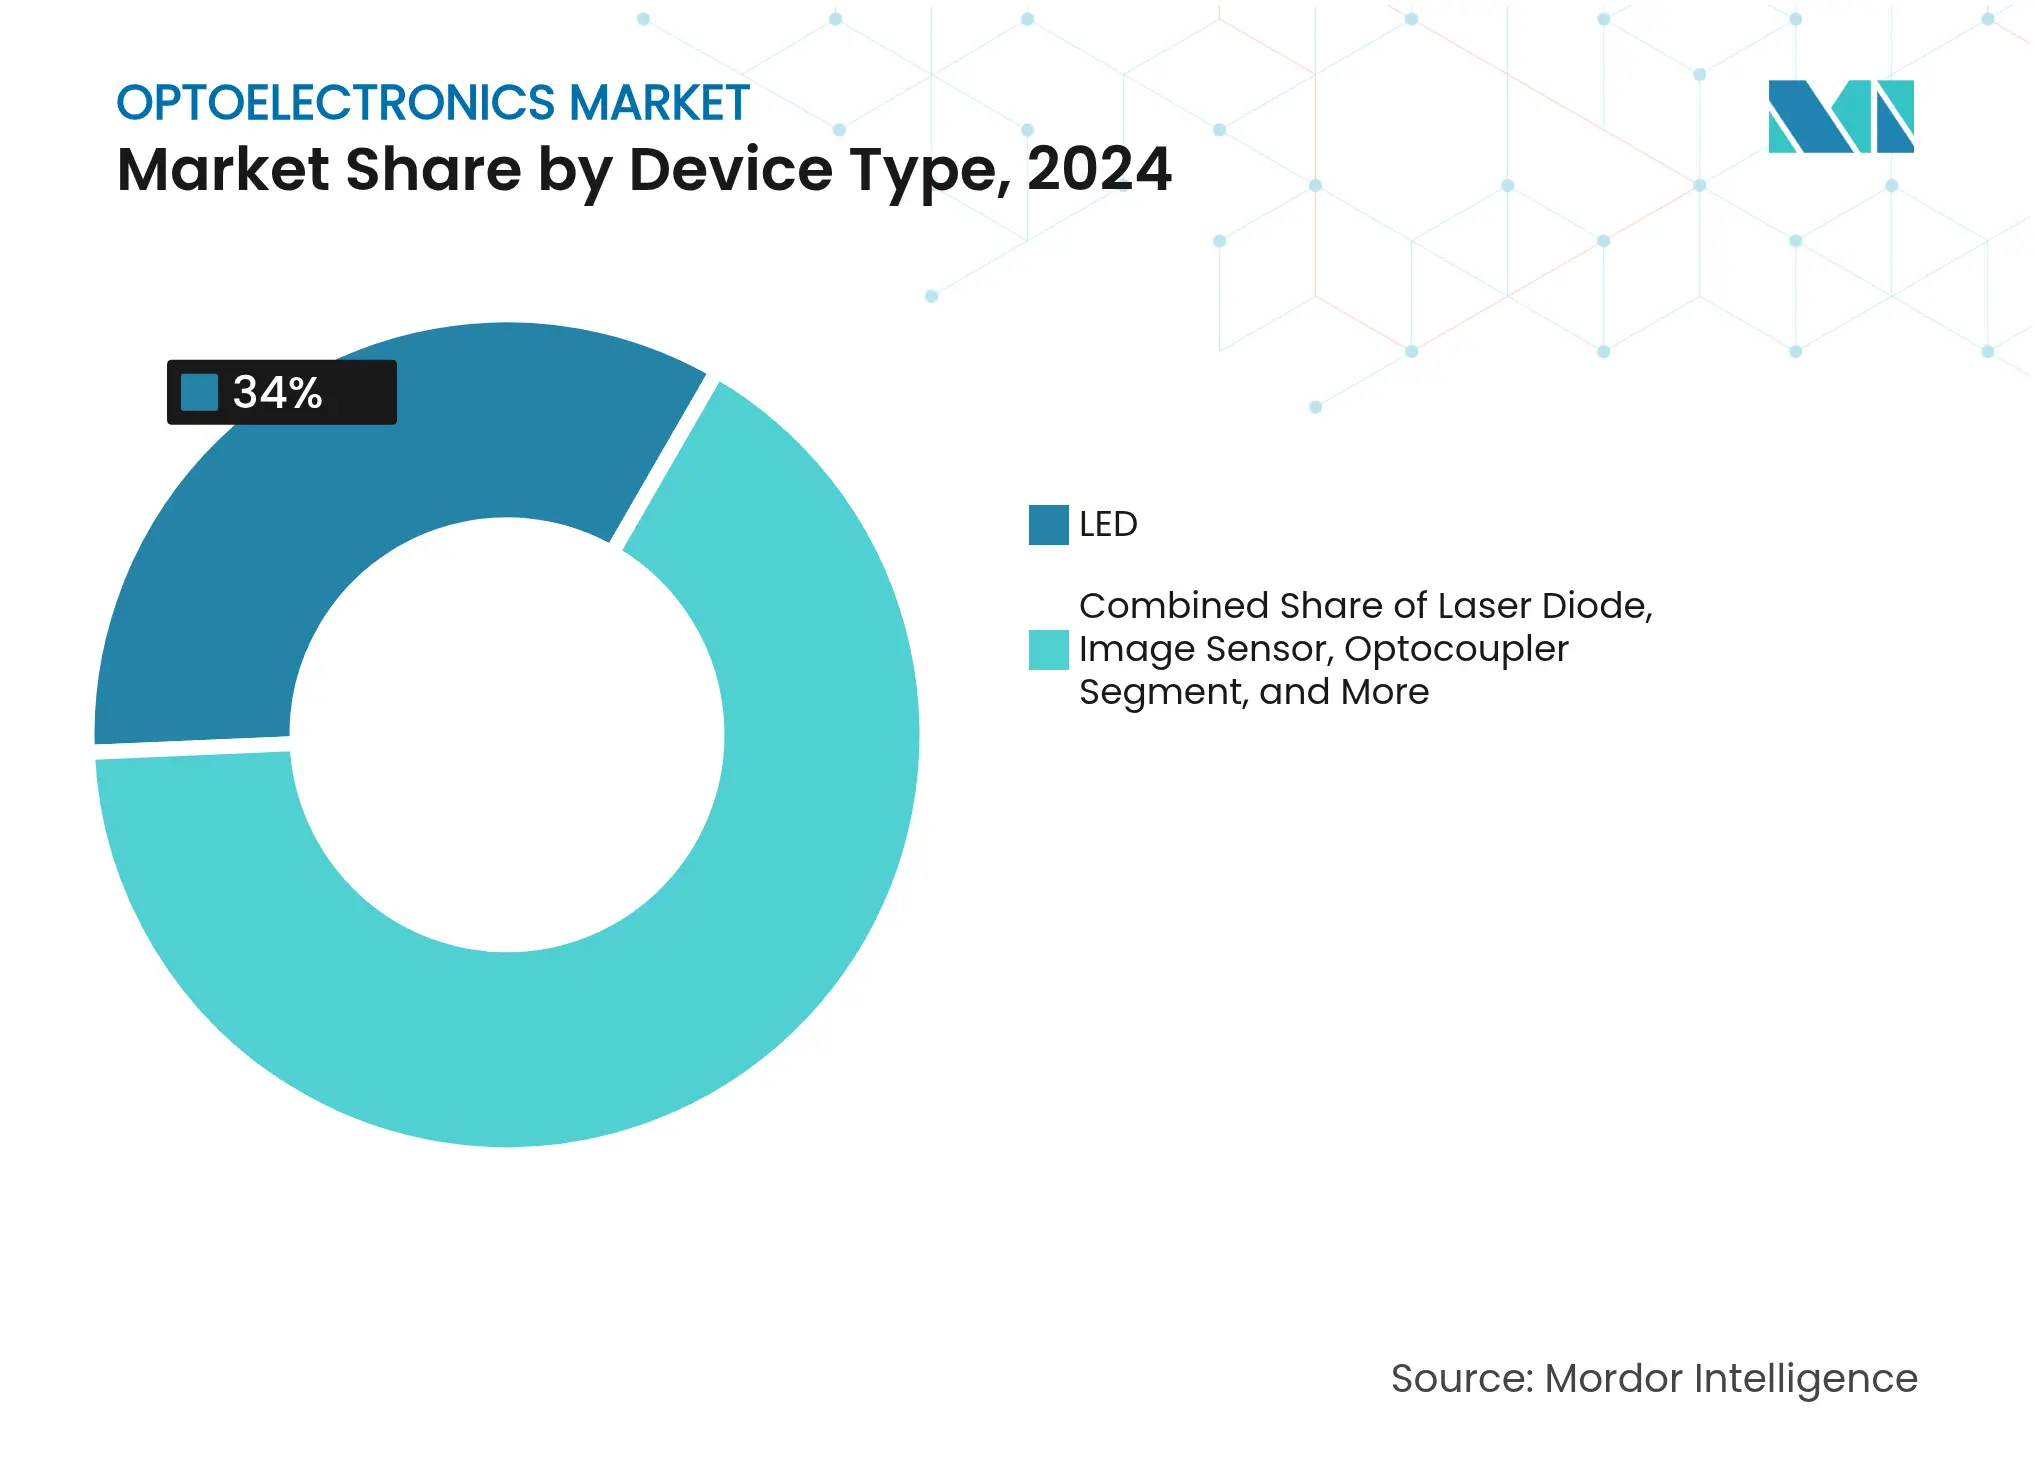
By Device Type: Laser diodes disrupt traditional LED dominance
LEDs retained the largest position in the 2024 optoelectronics market, accounting for 34% revenue as horticulture lighting, automotive exterior modules, and commercial displays rebounded. The segment benefited from mature manufacturing lines and incremental chip-level improvements that squeezed more lumens per watt without major capital upgrades. In parallel, laser diodes-especially vertical-cavity and edge-emitting structures-advanced at a 6.8% CAGR outlook due to expanding 3D sensing, short-reach optical interconnect, and automotive LiDAR adoption. Multi-junction architectures now squeeze additional optical power from the same die area, a feature critical for under-display projectors where footprint is limited. Suppliers that combine wafer-scale testing with integrated driver ICs continue to gain design wins as handset makers favor turnkey emitter packages.
Rising interest in metasurface integration amplifies the value of precise beam shaping at the chip face, which in turn raises switching costs for device original equipment manufacturers. As metasurface libraries mature, laser-diode designers embed custom patterning in the final epitaxy step, delivering pattern and phase control unattainable with conventional lenses. The ability to tailor divergence profiles opens enterprise demand for AR displays and short-throw projectors, widening the total addressable optoelectronics market. LEDs will remain indispensable for large-area illumination, yet laser diodes are carving out premium niches where coherent light or tight beam steering is essential.
By Device Material: SiC challenges GaN’s market leadership
Gallium nitride maintained dominance in 2024 with a 41% optoelectronics market share, sustained by its superior electron mobility and thermal conductivity that allow efficient operation at high switching speeds. Wafer scaling to 200 mm supports cost reductions, while alloy engineering delivers ultraviolet-to-visible emission tuning for sensing and sterilization. However, silicon carbide exhibits the fastest growth trajectory at a 7.4% CAGR as its threefold higher thermal conductivity enables power devices for fast-charging electric vehicles and solar inverters. Government-backed pilot lines in the United States and Europe now qualify 8-inch SiC substrates, signaling a ramp toward mass production.[4]U.S. Department of Energy, “Semiconductor Supply Chain Deep Dive Assessment,” energy.gov
Indium phosphide garners renewed attention for data-center optics beyond 400 G because its direct bandgap accommodates high-modulation speeds with low drive voltage. Gallium arsenide remains the workhorse for infrared emitters in remote-control and time-of-flight sensors. Meanwhile, silicon photonics positions itself as a cost-effective solution for dense transceivers, leveraging CMOS fabs and hybrid laser attach to sidestep III-V wafer shortages. Collectively, these trends underscore material pluralism wherein application-specific requirements dictate substrate selection, enriching the broader optoelectronics market.
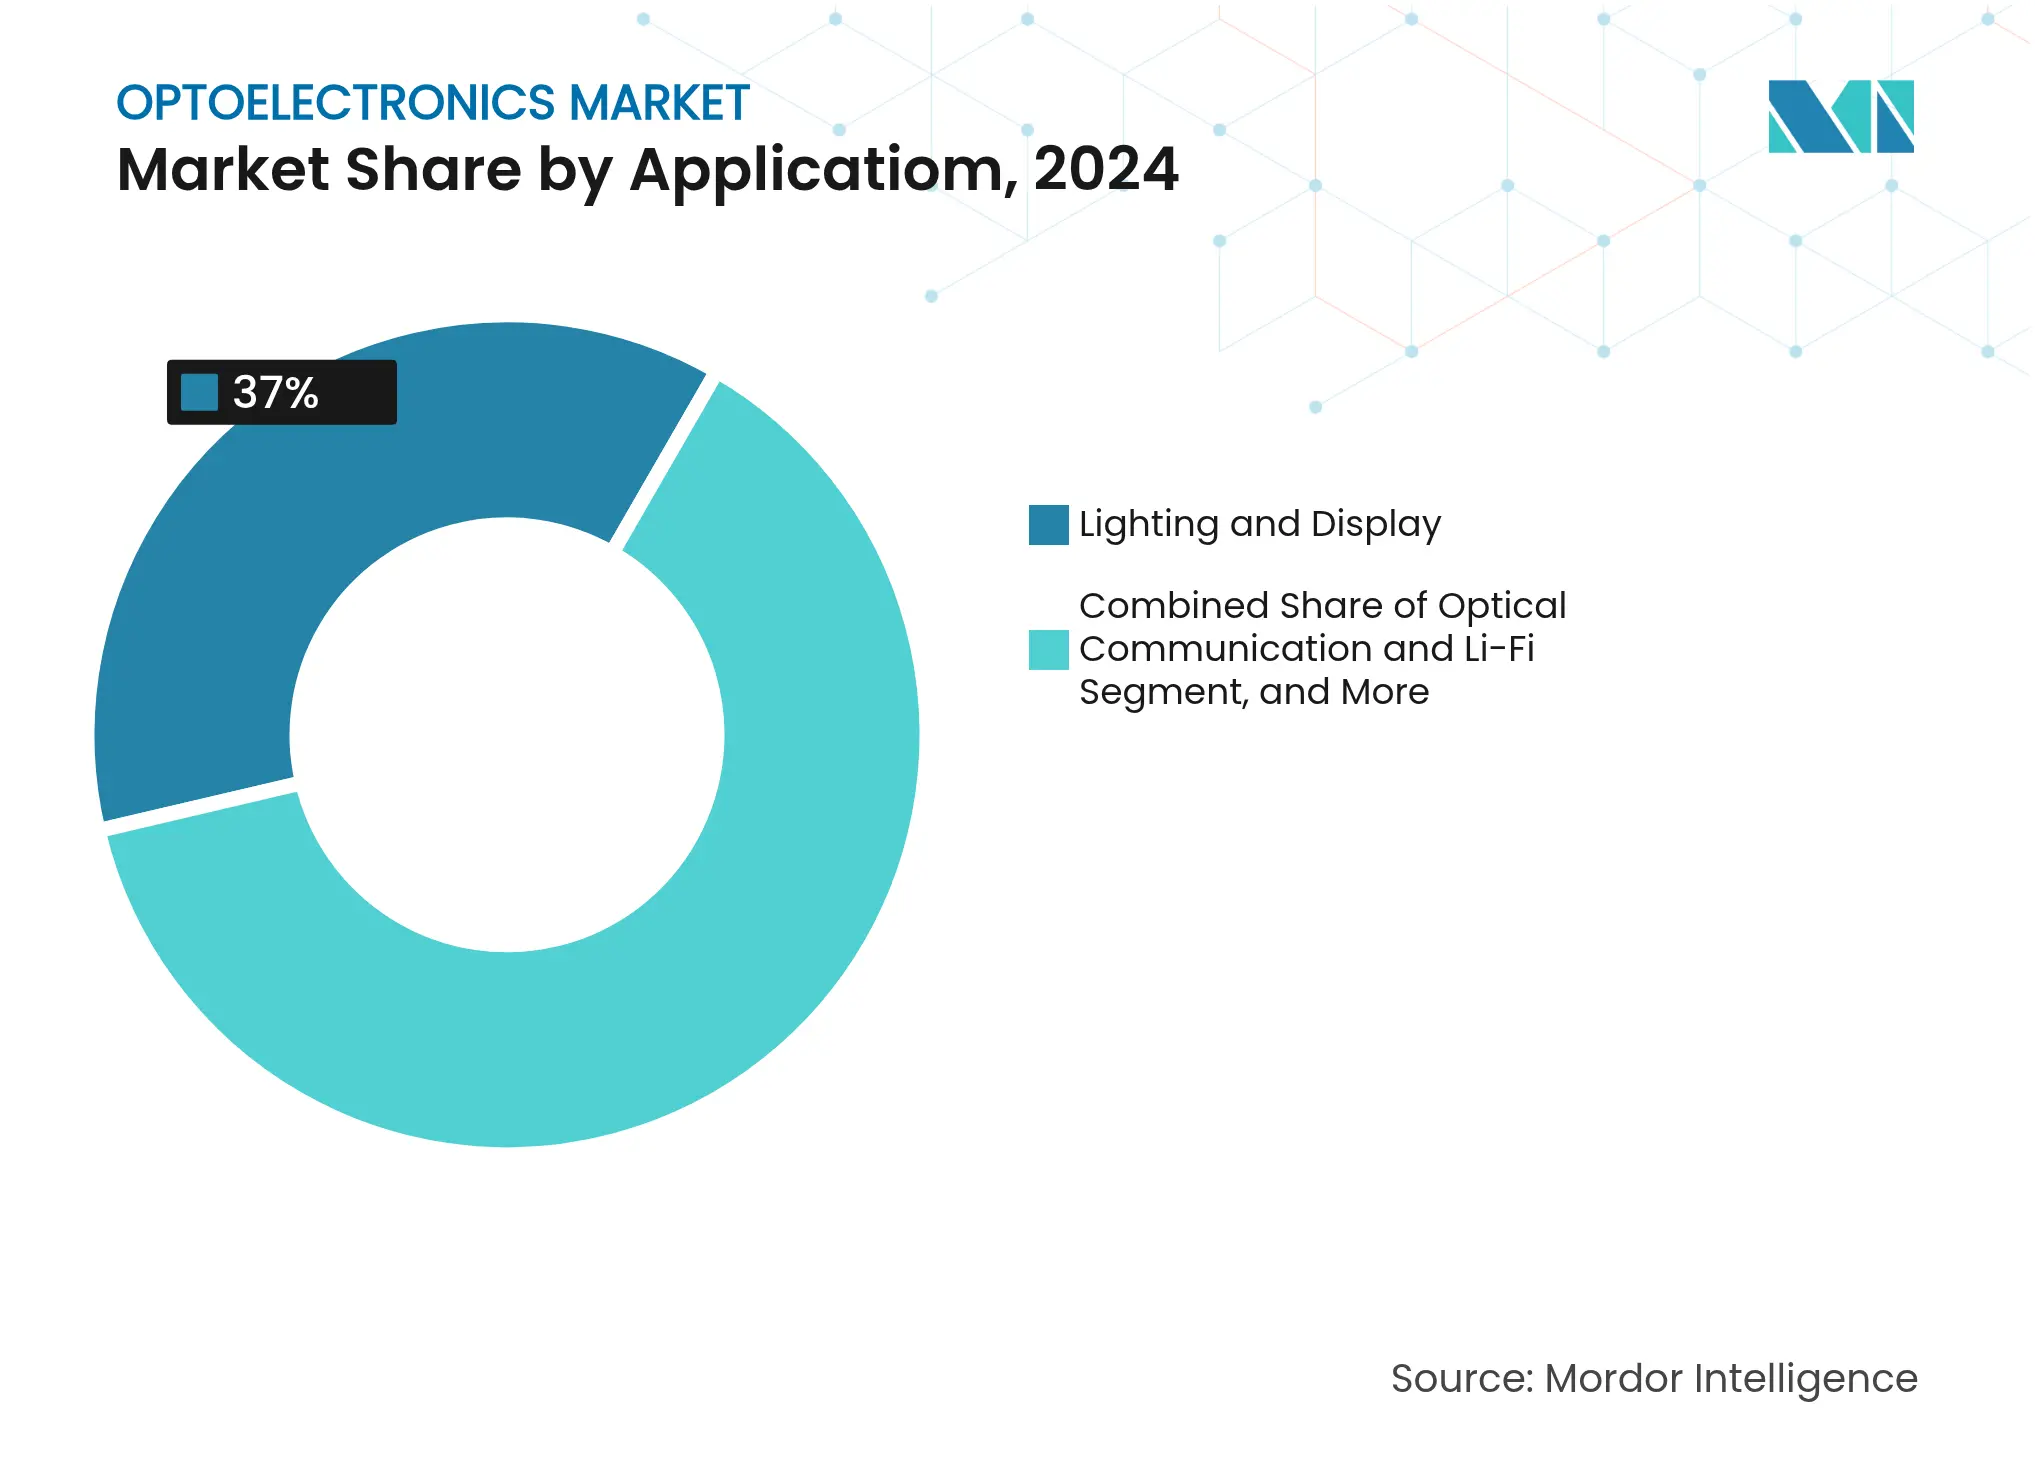
By Application: Optical communication outpaces traditional lighting
Lighting and display held a commanding 37% revenue slice of the optoelectronics market size in 2024, buoyed by commercial LED retrofits and rising micro-LED videowall installations. However, optical communication and Li-Fi generate the quickest gains, expanding at a 5.6% CAGR as hyperscalers transition from copper backplanes to fully optical fabrics. Co-packaged optics place transceiver modules adjacent to switch ASICs, shrinking power budgets while maintaining line-rate throughput above 25 Tb/s. Beyond data-center walls, Li-Fi pilots in hospitals and aircraft cabins showcase interference-free wireless links that complement congested RF spectra.
Sensing and imaging continue to gain relevance as automotive, industrial, and medical sectors adopt spectrally tuned detectors and camera modules for real-time analytics. Patient-mounted imaging wearables under development in Japan illustrate how CMOS sensors extend healthcare beyond clinical environments (qst.go.jp). Power conversion and photovoltaics also contribute to optoelectronics market expansion through high-efficiency GaN and SiC inverters that reduce system costs for residential solar arrays. Defense and security programs in the Middle East prioritize infrared detectors for border surveillance, a demand pattern likely to persist given geopolitical volatility.
By End-user Industry: Automotive sector accelerates adoption
Consumer electronics retained a 46% revenue share in 2024 as smartphones, smartwatches, AR glasses, and home robots embedded increasingly sophisticated optical modules. Growth stems not only from unit volumes but also from higher average semiconductor content per device, particularly in depth-sensing and biosensing. Conversely, the automotive sector posts a 6.1% CAGR outlook as electrification and autonomy necessitate lidar, advanced lighting, and cabin-monitoring cameras. Europe’s transition toward zero-emission fleets compels tier-1 suppliers to integrate optoelectronic devices that cut vehicle energy draw without sacrificing safety.
Information-technology operators press forward with generational network upgrades that stretch optical budgets and drive rapid innovation in integrated photonics. Healthcare providers demand ultra-low-noise detectors for early cancer diagnostics, translating research breakthroughs into commercial radiology equipment. Aerospace and defense agencies in several regions pursue multi-spectral payloads that improve situational awareness, an area where sovereign supply considerations mesh with technical requirements. Industrial automation remains steady, parlaying machine-vision adoption in quality control and predictive maintenance to stabilize the optoelectronics market across economic cycles.
Asia Pacific dominates the optoelectronics market with 52% of 2024 revenue, a lead built on deep supply-chain integration, experienced labor, and long-standing policy support. China’s foundry capacity continues to grow as provincial governments subsidize 200 mm and 300 mm fabs that focus on compound semiconductors, an expansion that mitigates some substrate shortages yet also raises concerns about overcapacity. Japan leverages its medical-imaging expertise to pioneer CMOS-sensor-based diagnostic platforms, boosting domestic demand while exporting subsystems to Europe and North America. South Korea’s display vendors push micro-LED process nodes that shrink epi-defect density, creating new high-brightness panels for augmented reality. Taiwan remains indispensable in the advanced-packaging stack despite geopolitical risk, prompting multinational OEMs to diversify second-source assembly in Southeast Asia.
The Middle East and Africa region posts a 7.9% CAGR outlook through 2030, fueled by national defense procurements and smart-city megaprojects that integrate LED lighting, fiber backbones, and security imaging. United Arab Emirates and Saudi Arabia channel oil-export surpluses into sovereign technology clusters, inviting global optoelectronic players to establish regional design centers. African coastal economies invest in submarine fiber landing stations that anchor shorter terrestrial links, stimulating passive-optics demand and downstream maintenance services. Although base volumes remain modest compared with Asia, high growth accelerates adoption of niche devices such as cooled mid-wave IR detectors for perimeter systems.
North America sustains substantial optoelectronics market influence thanks to robust venture funding, strong university research, and the U.S. CHIPS incentive that earmarks USD 50 billion for semiconductor manufacturing and R&D. The National Semiconductor Technology Center provides shared prototyping lines that lower barrier-to-entry for photonics start-ups, while export-control updates tighten oversight of dual-use ICs. Canada nurtures quantum-photonics ventures that explore entanglement-based communication, adding a frontier segment to the regional opportunity set.
Europe contends with a gradual erosion of global semiconductor share yet retains leadership in metrology optics, automotive lighting, and lithography equipment. The Chips Act allocates EUR 43 billion to amplify local production, though the European Court of Auditors projects only 11.7% global share by 2030 absent further interventions. Germany and France coordinate pilot lines for wide-bandgap power devices, while Nordic nations expand compound-semiconductor epitaxy dedicated to space and defense customers. The region’s stringent environmental rules stimulate demand for energy-efficient optoelectronic components, particularly in building automation.
South America remains a smaller but rising geography for the optoelectronics market, driven by broadband expansion, LED street-lighting programs, and agricultural imaging in Brazil and Argentina. International suppliers use joint-ventures to sidestep import duties and meet local-content requirements, seeding ecosystem capability that could scale in the next decade.

Reports are available across multiple geographies.
Gain in-depth market insights across regions to support informed decisions.
Market Concentration
The optoelectronics market exhibits moderate concentration: the top five suppliers collectively account for roughly 55% of revenue, while a long tail of specialist firms addresses niche applications. Leading multi-segment players cement positions through vertical integration that spans epitaxy, device fabrication, and module assembly, ensuring both cost control and supply certainty. Recent takeovers consolidate tooling assets for compound-semiconductor etching, granting acquirers process recipes that shorten time-to-yield for emerging devices. Intellectual-property depth remains a decisive moat; portfolios in metasurface patterning, wafer-bonding, and heterogeneous integration attract licensing revenue streams that subsidize further R&D.
ZEISS Group illustrates technology-centric growth, posting FY 2023/24 revenue of €10.894 billion largely on strong lithography optics demand. Coherent Corp. complements this trend by unveiling silicon-photonics and distributed EML transceivers that double faceplate bandwidth without breaking power envelopes, a move aligned with AI training cluster roll-outs. Jenoptik expands laser-processing systems for solar-cell structuring, capitalizing on green-energy tailwinds and securing public funding for a new Dresden micro-optics plant (jenoptik.us). In contrast, tier-2 Chinese LED makers confront compressing margins following tariff clarifications that maintained duties on lighting components .
Geopolitical tensions and export-control regimes alter competitive calculus. U.S. licensing hurdles on advanced image sensors steer some investment toward regional fabs in Malaysia and Vietnam, while European OEMs diversify substrate sourcing away from single-country dependencies. These dynamics invite collaboration between defense primes and civilian photonics houses to co-develop radiation-hardened, low-SWaP detectors. Meanwhile, venture-backed start-ups spearhead neuromorphic optical processors and quantum-secure communication links, features that could shift the performance frontier and redefine value pools within the broader optoelectronics market.

*Disclaimer: Major Players sorted in no particular order
1. INTRODUCTION
2. RESEARCH METHODOLOGY
3. EXECUTIVE SUMMARY
4. MARKET LANDSCAPE
5. MARKET SIZE AND GROWTH FORECASTS (VALUES)
6. COMPETITIVE LANDSCAPE
7. MARKET OPPORTUNITIES AND FUTURE OUTLOOK
Market Definitions and Key Coverage
Segmentation Overview
Detailed Research Methodology and Data Validation
Primary Research
Desk Research
Market-Sizing & Forecasting
Data Validation & Update Cycle
Why Mordor's Optoelectronics Baseline Earns Trust
Benchmark comparison
| Market Size | Anonymized source | Primary gap driver | ||
|---|---|---|---|---|
USD 45.79 B (2025) | Mordor Intelligence | - | Anonymized source:Mordor Intelligence | Primary gap driver:- |
USD 47.10 B (2024) | Global Consultancy A | passive optics included, uniform ASP, biennial refresh | ||
USD 46.88 B (2023) | Trade Journal B | excludes photovoltaic cells, single-factor trend extrapolation |
Pricing Strategy for Semiconductor Components
3 Min Read
Accelerating Additive Manufacturing Adoption in India
3 Min Read
When decisions matter, industry leaders turn to our analysts. Let’s talk.