
Market Overview
| Study Period | 2020 - 2031 |
|---|---|
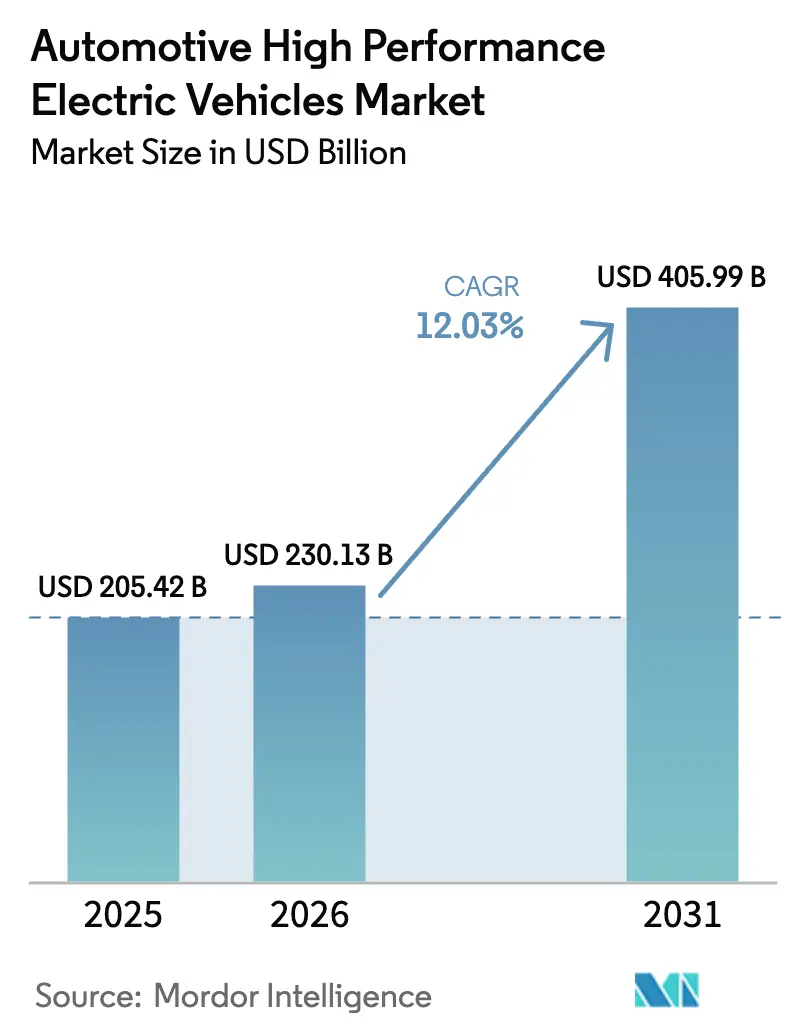
| Market Size (2026) | USD 230.13 Billion |
| Market Size (2031) | USD 405.99 Billion |
| Growth Rate (2026 - 2031) | 12.03 % |
| Fastest Growing Market | South America |
| Largest Market | Asia Pacific |
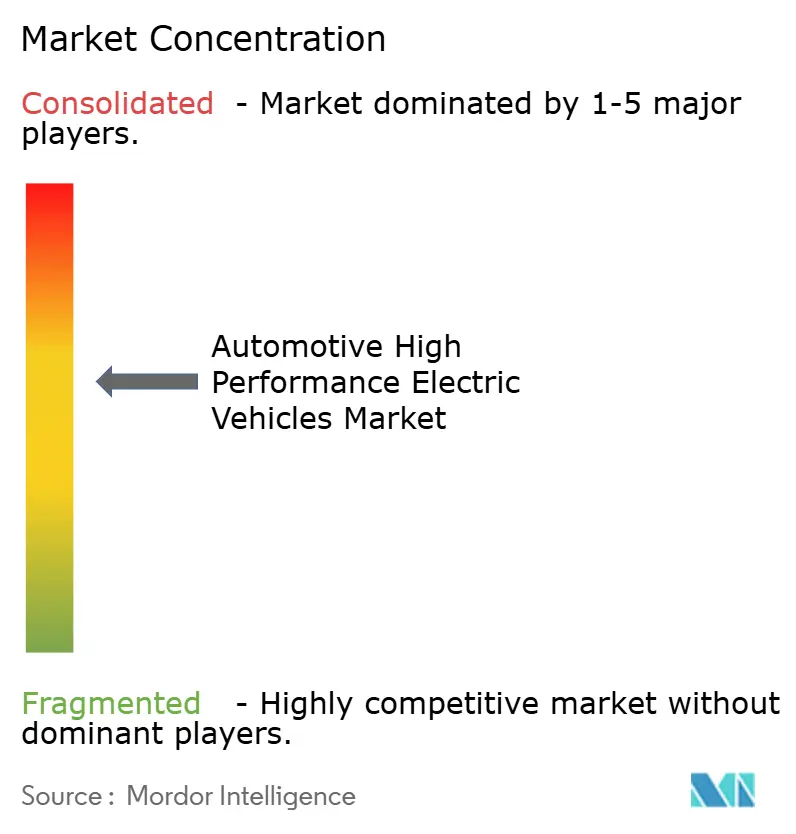
| Market Concentration | Medium |
Major Players *Disclaimer: Major Players sorted in no particular order Image © Mordor Intelligence. Reuse requires attribution under CC BY 4.0. | |
Automotive High Performance Electric Vehicles Market Analysis by Mordor Intelligence
The Automotive High Performance Electric Vehicles Market size is expected to grow from USD 205.42 billion in 2025 to USD 230.13 billion in 2026 and is forecast to reach USD 405.99 billion by 2031 at 12.03% CAGR over 2026-2031. Continued cost declines in battery packs, rapid 800 V platform diffusion, and a new wave of tri- and quad-motor models position the automotive high performance EVs market for sustained double-digit expansion. Consumer interest in vehicles that deliver both near-silent operation and super-car-level acceleration is reinforcing premium pricing power, while governments use zero-emission mandates and purchase subsidies to pull forward demand.
Key Report Takeaways
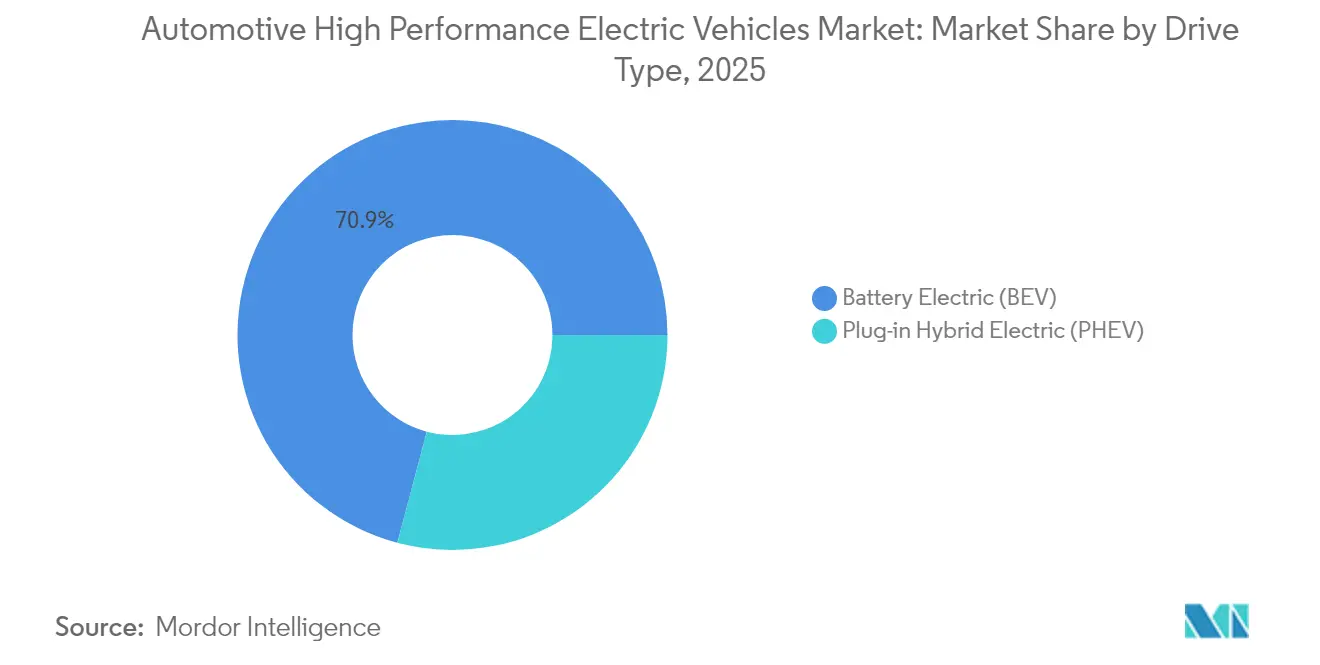
- By drive type, Battery Electric Vehicles led with 70.87% revenue share in 2025; Plug-in Hybrid Electric Vehicles are advancing at a 13.13% CAGR to 2031.
- By vehicle type, passenger cars held 84.12% share of the automotive high performance EVs market in 2025; commercial vehicles are growing at a 12.66% CAGR through 2031.
- By motor type, permanent-magnet synchronous motors accounted for 62.74% share of the automotive high performance EVs market size in 2025, whereas axial-flux motors post the highest CAGR at 12.71%.
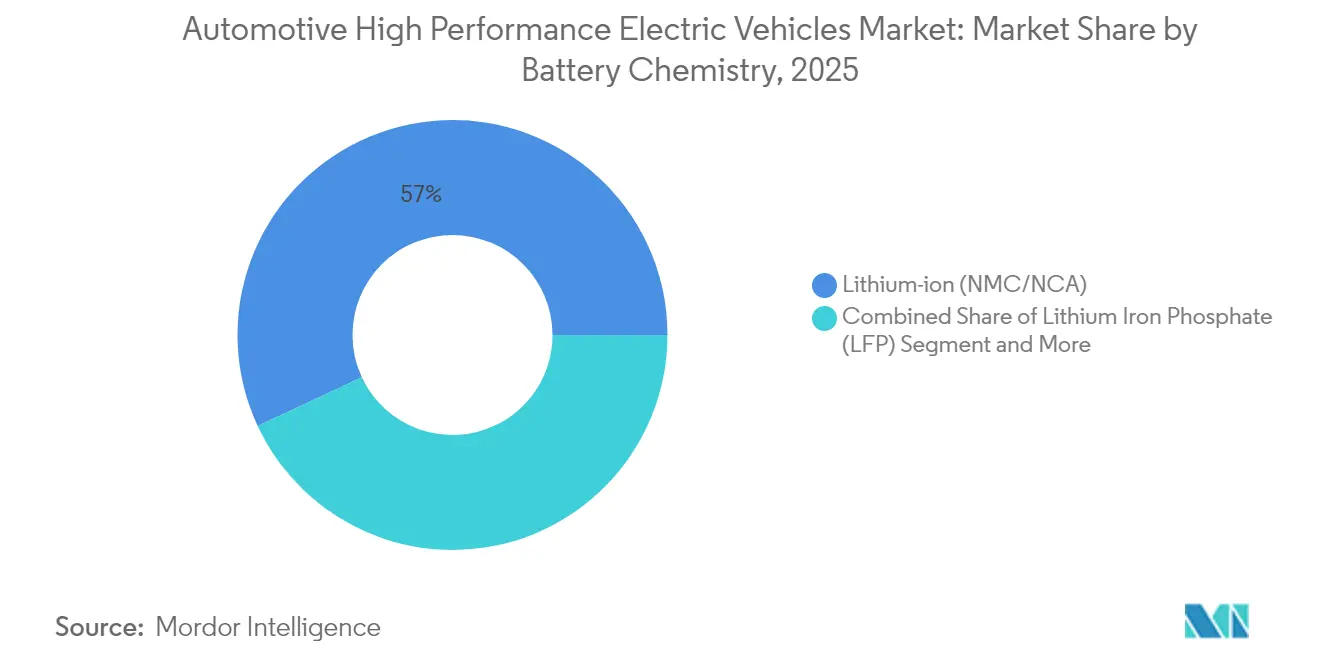
- By battery chemistry, NMC/NCA packs maintained 56.95% revenue share in 2025, while solid-state and semi-solid chemistries grow at 12.96% CAGR to 2031.
- By power-train architecture, dual-motor AWD systems commanded 47.69% share of the automotive high performance EVs market size in 2025; tri/quad-motor AWD platforms record the fastest 12.47% CAGR to 2031.
- By geography, Asia-Pacific captured 46.32% of the automotive high performance EVs market share in 2025, while South America is projected to climb at a 12.99% CAGR through 2031.
Note: Market size and forecast figures in this report are generated using Mordor Intelligence’s proprietary estimation framework, updated with the latest available data and insights as of 2026.
Market Trends and Insights
Drivers Impact Analysis of Automotive High Performance Electric Vehicles Market*
| Driver | (~) % Impact on CAGR Forecast | Geographic Relevance | Impact Timeline |
|---|---|---|---|
| Battery Cost Decline and 800V Adoption | +2.8% | Global, with early gains in Germany, China, South Korea | Medium term (2-4 years) |
| Government Incentives | +2.1% | North America and EU, spill-over to Asia Pacific core | Short term (≤ 2 years) |
| Ultra-Fast Charging Corridors | +1.9% | Global, concentrated in developed markets | Medium term (2-4 years) |
| SiC Inverters for Track Duty | +1.4% | Global, premium segment focus | Long term (≥ 4 years) |
| EV-only Racing Halo | +0.8% | Global, with strong influence in Europe, North America | Long term (≥ 4 years) |
| OTA Performance-Upgrade Revenue | +0.6% | Global, tech-forward markets leading | Medium term (2-4 years) |
| Source: Mordor Intelligence | |||
Battery Cost Decline & 800 V Adoption
NMC and NCA cell prices continued falling below USD 90 kWh in 2025 as Tesla’s 4680 line hit volume production and Chinese suppliers commercialized 6C-charge packs, shrinking pack-level cost structures by double digits. Eight-hundred-volt architectures pioneered by the Porsche Taycan now permeate premium segments, slicing DC fast-charge sessions by 40% and allowing lighter cabling that offsets added motor mass. Silicon-carbide MOSFET inverters from Infineon and Wolfspeed drop switching losses for tri- and quad-motor layouts, supporting 10-minute full charges without thermal derate. The combined effect propels the automotive high performance EVs market toward broader affordability while sustaining ultra-high power outputs.[1]“Mission R Technology Update,” Porsche AG, newsroom.porsche.com
Government Incentives & Emission Norms
The U.S. Inflation Reduction Act grants up to USD 7,500 per vehicle, complemented by state rebates that trim effective transaction prices by as much as USD 15,000. The European Union’s Fit-for-55 package legally binds a 55% fleet-average CO₂ cut by 2030, compelling OEMs to lean into high performance EV volume to counterbalance residual ICE output.[2]“Fit for 55: Delivering the EU Green Deal,” European Commission, europa.eu China’s dual-credit regime pushed BYD deliveries to 4.27 million units in 2024, more than doubling its EV tally in two years.
Ultra-fast Charging Corridors
Tesla opened access to its 50,000-plug Supercharger network, while the U.S. NEVI program funds 500,000 150 kW+ chargers by 2030, removing one of the final adoption hurdles for performance-minded buyers. Ionity’s 350 kW European sites enable 20-minute 10-80% sessions for 800 V models, and megawatt-class hardware planned for commercial rigs will spill over to halo passenger programs. These rollouts reinforce resale values and underpin the automotive high performance EVs market’s long-range usability.[3]“NEVI Formula Program Guidance,” U.S. Department of Energy, energy.gov
SiC Inverters for Track Duty
Silicon-carbide switches hold 3times higher electron mobility than silicon, allowing inverters to run cooler at higher switching frequencies. Formula E’s Gen3 racer converts over 95% of drawn energy to forward motion and recuperates more than 40% through braking, a blueprint now migrating into Ferrari and McLaren road cars. Track-durable electronics assure repeatable lap times and mitigate thermal throttling, critical for the automotive high performance EVs market segment targeting circuit use.[4]“ABB FIA Formula E World Championship Season 10 Overview,” Fédération Internationale de l’Automobile, fia.com
Restraints Impact Analysis of Automotive High Performance Electric Vehicles Market*
| Restraint | (~) % Impact on CAGR Forecast | Geographic Relevance | Impact Timeline |
|---|---|---|---|
| Thermal-Management Limits | -1.8% | Global, acute in hot climate regions | Short term (≤ 2 years) |
| Rare-Earth Price Risk | -1.5% | Global, supply concentrated in China | Medium term (2-4 years) |
| Insurance-Premium Spike | -1.2% | North America and EU primarily | Short term (≤ 2 years) |
| Grid Bottlenecks for MW Chargers | -0.9% | Developed markets with aging infrastructure | Long term (≥ 4 years) |
| Source: Mordor Intelligence | |||
Thermal-management Limits
Current lithium-ion packs lose capacity rapidly above 60 °C, and extreme duty cycles in multi-motor setups can push cells to these thresholds in minutes. Liquid-cooling plates, phase-change composites, and refrigerant-based chillers add cost, weight, and service complexity. In the Persian Gulf, summer ambient temperatures already trim real-world range by up to 20% during spirited driving. OEMs are exploring structural cooling and immersion methods, yet short-term capex remains a hurdle for the automotive high performance EVs market.
Rare-earth Price Risk
Permanent-magnet motors use neodymium and dysprosium whose spot prices doubled in the past couple of years. China refines over 80% of global rare earths, exposing supply chains to geopolitical tension. BMW, GM and Hyundai have funded closed-loop recycling plants, while switched-reluctance and axial-flux designs aim to cut magnet intensity by 60-80%. Until these alternatives scale, raw-material volatility will weigh on the automotive high performance EVs industry.
*Our forecasts treat driver/restraint impacts as directional, not additive. The impact forecasts reflect baseline growth, mix effects, and variable interactions.
Automotive High Performance Electric Vehicles Market Segment Analysis
By Drive Type:
BEVs Dominate Despite PHEV AccelerationBattery Electric Vehicles secured 70.87% of 2025 revenue, underscoring buyer preference for pure-electric thrust and simplified drivetrains. BEVs exploit instant torque and finer power modulation, exemplified by the Xiaomi SU7 Ultra’s Nürburgring benchmark lap. The segment also benefits from lighter maintenance demand and OTA-driven performance tuning. Meanwhile, Plug-in Hybrid Electric Vehicles are expanding at a 13.13% CAGR, appealing to enthusiasts in regions where 350 kW public chargers remain scarce.
Europe’s stricter CO₂ fleet averages make PHEVs attractive for compliance, and premium marques integrate track-oriented electric boost modes that deliver sustained lap performance. Tax regimes in Germany and the U.K. favor PHEVs for company fleets, propelling adoption among executive buyers.



By Vehicle Type:
Passenger Cars Lead While Commercial Vehicles SurgePassenger cars commanded 84.12% of 2025 revenue of the automotive high performance EVs market size, propelled by sports sedans and luxury SUVs that now out-accelerate legacy supercars. Battery floor mounting drops centers of gravity, and torque vectoring enhances handling, enabling Mercedes-AMG, BMW M, and Audi Sport to offer sub-3-second 0-60 mph times with four-door practicality. Customer willingness to pay for software-unlock extras further fortifies margins.
Commercial vehicles, led by performance-oriented pickups and delivery vans, record a 12.66% CAGR through 2031. Fleet managers appreciate torque for towing and payload while benefiting from lower fuel and service bills. Rivian’s R1T and Ford’s F-150 Lightning prove that workhorse fleets can extract premium value from propulsion systems designed for extremes. As duty-cycle data feeds predictive maintenance, residuals improve, inviting institutional capital into the automotive high performance EVs market.
By Motor Type:
Permanent Magnets Dominate Despite Axial Flux InnovationPermanent-magnet synchronous motors captured 62.74% of 2025 volume of the automotive high performance EVs market. Their high power density and broad efficiency plateau make them indispensable for prolonged high-speed runs. Axial-flux machines expand at 12.71% CAGR, condensing 800 hp into sub-40 kg packages such as Koenigsegg’s Dark Matter unit
Carbon-nanotube windings and 3D-printed stators promise further mass savings, pushing gravimetric power past 15 kW kg in pilot lines. As these breakthroughs mature, multi-motor platforms will combine different machine types—PM on main axles, axial-flux on torque-vectoring units—to balance cost and performance. Suppliers with diversified motor portfolios therefore gain negotiating leverage across the automotive high performance EVs market.
By Battery Chemistry:
NMC/NCA Leads While Solid-state AcceleratesNMC/NCA batteries retained 56.95% share of 2025 shipments of the automotive high performance EVs market. High nickel cathodes deliver discharge rates suited for sustained max-power stints, though thermal management complexity rises. Tesla’s 4680 cells and CATL’s Qilin modules illustrate incremental gains through tab-less designs and cell-to-pack integration. Solid-state chemistries grow at 12.96% CAGR, driven by ambitions to double energy density to 500 Wh kg while eliminating liquid electrolyte fire risk. BMW’s 2025 i7 flagship debuts a pouch-format solid-state pack, cutting mass by 20% and clearing interior space.
Semi-solid variants such as Gotion’s pilot 0.2 GWh line bridge today’s supply chain with tomorrow’s performance, providing 1,000 km range and 10-minute charges at 400 kW. LFP remains a cost-grounded alternative for entry trims. The interplay of cost, safety, and peak-power tolerance will dictate chemistry splits, yet every pathway underpins higher ceiling performance, bolstering confidence in the long-term trajectory of the automotive high performance EVs market.
By Powertrain Architecture:
Dual-Motor AWD Leads While Multi-Motor Systems AccelerateDual-motor AWD held 47.69% share in 2025, roughly USD 97.96 billion in sales, balancing cost, weight, and torque-vectoring finesse. Even mainstream trims such as Hyundai’s Ioniq 5 N leverage dual units for drift-mode theatrics. Tri- and quad-motor layouts, however, climb at a 12.47% CAGR on the back of Rivian’s 1,025 hp R1T and Lucid’s Sapphire line, which cut 60-80 mph passes to 1.5 seconds. Individually controlled motors enable millisecond-level torque adjustments on each wheel, redefining handling envelopes.
Energy overheads once made four-motor specs impractical, but 800 V buses and SiC inverters improved driveline efficiency, while shared component families lower per-unit cost. As pack capacities pass 120 kWh and energy densities rise, multi-motor weight penalties shrink. OEM roadmaps indicate most 2027 premium launches will use at least three drive motors, suggesting a re-mix that could tip the automotive high performance EVs market in favor of highly modular, skateboard-based platforms.
Geography Analysis
APAC Automotive High Performance Electric Vehicles Market
Asia-Pacific dominated with 46.32% 2025 revenue share, anchored by China where electric vehicles are slated to reach 60% of total light-duty sales in 2025. Japan remains hybrid-skewed, yet South Korea and Australia witness double-digit growth under expanded purchase rebates and 350 kW highway charger deployments. Integrated supply chains allow battery, inverter, and chip suppliers to co-locate, compressing lead times and securing a structural price edge for the automotive high performance EVs market in the region.
Europe and Mexico Automotive High Performance Electric Vehicles Market
Europe rebounded with around 30% BEV sales growth in Q1 2025 after a 2024 plateau, supported by joint public-private funding that targets one million public charge points by 2030. Germany and the U.K. posted a decent respective gains, benefiting from residual-value guarantees and Formula E technology spillovers. Mexico’s planned mini-EV hub for 2030 integrates NAFTA content rules and low labor costs, creating a contiguous supply belt that reinforces regional competitiveness. Such build-local trends align with national security narratives, shielding the automotive high performance EVs market from distant supply disruptions.
South America Automotive High Performance Electric Vehicles Market
South America delivered the fastest 12.99% CAGR outlook as Latin American EV registrations doubled units in 2024. Uruguay tops regional per-capita adoption; Brazil cut import tariffs to accelerate domestic assembly programs, and Paraguay eyes battery-grade lithium business anchored on hydropower. Yet charging coverage remains patchy outside capital corridors, prompting fleets to prioritize depot-based operations. As renewable generation expands, the automotive high performance EVs market should find fertile ground in clean-energy branding for premium imports.


Regulatory Landscape
Regulation affecting high-performance electric vehicles is tightening on both tailpipe and vehicle-performance validation dimensions, prompting OEMs to certify emissions compliance alongside battery durability and electric-range performance under formal test cycles. In the European Union, Euro 7 (Regulation (EU) 2024/1257) adds new type-approval requirements covering battery durability, with approval authorities required to refuse type-approval for new vehicle types that do not comply starting November 29, 2026. That creates a hard cutoff for platforms that cannot demonstrate durability and performance retention.
In the United States, federal policy is converging on multi-pollutant regulation and technical requirements for electrified powertrains. The EPA finalized multi-pollutant emissions standards for model years 2027-2032, while battery-related minimum performance and durability requirements for light-duty ZEVs and PHEVs are codified in 40 CFR 86.1815-27 beginning in MY 2027. At the state level, California Air Resources Board test procedures for 2026 and later model year ZEVs and PHEVs add more compliance detail, increasing the importance of validated power determination, low-temperature performance, and battery health retention for premium, high-output trims.
Value Chain Analysis
The value chain for automotive high performance EVs begins upstream with critical minerals and advanced materials (nickel, cobalt, lithium, manganese, graphite, and rare earths), then moves into cell manufacturing and module or pack assembly. Power electronics (SiC devices and inverters) and traction motors (permanent-magnet and emerging magnet-lean designs) are followed by thermal systems and vehicle integration, and then by distribution through OEM direct and dealer networks. Software and OTA performance monetization add another layer downstream.
Concentration risks persist across multiple nodes. As of 2025, CATL and BYD account for over half of global EV battery installations, and China dominates processing steps for battery inputs used for LFP/LMFP pathways (such as battery-grade manganese sulfate and purified phosphoric acid) as well as motor inputs, including rare-earth refining and sintered magnet production. Localization and alternative-technology pathways are reshaping midstream sourcing for premium performance platforms. In June 2026, Hyundai Motor Group and SK On started series production of battery cells at their HSBMA joint venture plant in Bartow County, Georgia (USD 5 billion), strengthening North American supply for high-voltage packs and reducing logistics exposure for regional assembly. On the motor side, MP Materials began construction work in June 2026 on a rare earth magnet factory in Northlake, Texas (USD 1.25 billion), while the industry evaluates magnet-light approaches (switched-reluctance and axial-flux) to mitigate rare-earth concentration risk that can affect high power-density traction motors.
Competitive Landscape
The automotive high performance EVs market shows moderate concentration, the top five brands scale advantages against a persistent long-tail of niche super-EV builders. Tesla and BYD leverage battery self-sufficiency and vertically integrated inverter and software stacks to compress cost and accelerate iteration cycles. Volkswagen’s USD 5 billion alignment with Rivian underscores incumbent recognition that proprietary zonal electronic architectures and centralized compute pathways now differentiate performance and user-experience even more than mechanical attributes.
Technology transfer from motorsport accelerates product cycles. Nissan and Jaguar harvest race telemetry from Formula E into production-vehicle power-limit and brake-regen algorithms within 12 months, preserving brand leadership on track-day metrics. BMW i Ventures’ invested more than USD 30 million in DeepDrive’s dual-rotor machines hints at a future where IP around compact, magnet-light motors becomes pivotal. Rimac’s holds more than half of the stake in Bugatti Rimac couples boutique EV hypercar know-how with century-old luxury cachet, illustrating cross-fertilization patterns that sustain premium price points.
Chinese challengers flood export lanes with attractively priced, feature-rich performance models. BYD ships vehicles at margins comparable to global incumbents thanks to in-house blade batteries and next-gen 6C cells. Meanwhile, U.S. and European brands prioritize software roadmaps, layering subscription-based performance unlocks to deepen post-sale monetization. As supply chains for SiC wafers, solid-state cells, and axial-flux motors mature, competitive advantage will hinge on integration speed and capital agility, positioning diversified conglomerates and venture-funded specialists alike to expand influence across the automotive high performance EVs market.
Automotive High Performance Electric Vehicles Industry Leaders
Tesla
BYD Auto
Volkswagen Group
BMW Group
Mercedes-Benz Group
- *Disclaimer: Major Players sorted in no particular order
Automotive High Performance Electric Vehicles Market Companies Covered in this Report
- Tesla
- BYD Auto
- Volkswagen Group
- BMW Group
- Mercedes-Benz Group
- General Motors
- Ford Motor Company
- Stellantis NV
- Hyundai Motor Group
- Toyota Motor Corporation
- Nissan Motor Co.
- Lucid Group
- Rivian Automotive
- Rimac Automobili
Read Analysis of Automotive High Performance Electric Vehicles Companies

Market Opportunities and Future Outlook
Near-term whitespace centers on scaling high-performance EV architectures while meeting tighter durability and certification requirements, particularly for 800 V platforms, multi-motor AWD layouts, and track-capable thermal systems. Investment and plant actions during 2026 show OEMs and suppliers prioritizing localized capacity for both vehicles and cells. BMW Group completed a USD 1.7 billion investment program in South Carolina, including Plant Spartanburg expansion and the Plant Woodruff battery facility, while Hyundai Motor Group with SK On advanced a USD 5 billion Georgia battery plant into cell series production, improving regional availability of high-output packs used in premium trims.
Platform and product programs also create room for performance-focused differentiation at the top end, while widening addressable price bands through scale. Rivian increased the planned capacity of its Georgia facility to 300,000 vehicles annually and began vertical construction activities in 2026, reflecting an emphasis on volume-capable architectures that can support high-performance variants. In Europe, Mercedes-Benz started production for an all-electric C-Class at Kecskemet, Hungary after a EUR 1 billion site expansion, indicating continued effort to industrialize EV output where high-performance powertrains can be offered as trims. On the cell side, AESC began mass production of 46120 large-format cylindrical cells for BMW programs, and BYD reported ramp activity for second-generation Blade Battery cells at its Xixian base, aligning with demand for faster-charging, higher-power cells and more consistent supply for performance-limited configurations.
Recent Industry Developments in Automotive High Performance Electric Vehicles Market
- July 2026: Porsche introduced a Manthey performance kit for the Taycan Turbo GT with Weissach Package after the car recorded a 6:55.533 lap time at the Nurburgring Nordschleife. The kit extends the Taycan performance offering beyond factory specification and reinforces the role of track-validated hardware and calibration in premium EV positioning.
- May 2025: BMW implemented solid-state battery technology in its all-electric i7 flagship, marking a high-profile production deployment of the chemistry in the luxury segment. This milestone supports higher energy-density roadmaps that translate into either more sustained performance at a given pack mass or greater range headroom for high-output trims.
- June 2024: Volkswagen Group announced plans to invest up to USD 5 billion in Rivian via a joint venture focused on electrical architecture and software integration. The collaboration highlights how centralized compute, zonal architectures, and software-defined powertrain controls are becoming core differentiators for high-performance EV driving character and OTA upgrade pathways.


Automotive High Performance Electric Vehicles Market Report Scope and Research Methodology
Market Definition and Coverage
For this methodology, the market covers new automotive high-performance electric vehicles sold globally, measured in revenue, across battery electric vehicles and plug-in hybrid electric vehicles that meet performance-led expectations (such as strong acceleration and longer driving range).
Scope exclusions: We exclude used-vehicle resale values, aftermarket upgrades, charging services, and standalone components that are not part of the vehicle sale price.
Segments Covered in This Report
- By Drive Type
- Battery Electric (BEV)
- Plug-in Hybrid Electric (PHEV)
- By Vehicle Type
- Passenger Cars
- Commercial Vehicles
- By Motor Type
- Permanent-Magnet Synchronous
- Induction
- Switched Reluctance
- Axial Flux
- By Battery Chemistry
- Lithium-ion (NMC/NCA)
- Lithium Iron Phosphate (LFP)
- Solid-state & Semi-solid
- By Powertrain Architecture
- Single-Motor RWD
- Dual-Motor AWD
- Tri-/Quad-Motor AWD
- Geography
- North America
- United States
- Canada
- Rest of North America
- South America
- Brazil
- Argentina
- Rest of South America
- Europe
- Germany
- United Kingdom
- France
- Italy
- Spain
- Russia
- Rest of Europe
- Asia-Pacific
- China
- Japan
- India
- South Korea
- Australia
- Rest of Asia-Pacific
- Middle East and Africa
- United Arab Emirates
- Saudi Arabia
- South Africa
- Turkey
- Rest of Middle East and Africa
- North America
Data Sources, Market Sizing, and Validation
Desk Research
Desk work starts with building a clean fact base on EV sales, fleet age, and policy direction, then aligning that to what buyers tend to treat as high-performance in the vehicle market. Public sources such as the International Energy Agency (Global EV Outlook), the US Department of Energy Alternative Fuels Data Center, Eurostat, national transport agencies, and customs statistics are used to understand registrations, charging build-out, and trade flows that support adoption.
Next, we add inputs from company filings, investor presentations, automaker press releases, and reputed automotive press to map launches, price positioning, and regional availability. Where helpful, we also use paid subscriptions for company financials and intelligence, news and financials, and vehicle park and sales databases to cross-check model inputs like addressable volumes and typical price bands. The desk sources listed here are illustrative only, and many other public and paid references were also used for data collection, cross-checking, and clarification.
Primary Interviews and Surveys
Primary work was used to pressure-test what counts as high-performance in real buying decisions and how pricing moves as battery, motor, and software capabilities improve. We spoke with a mix of vehicle OEM-side teams, dealers and distribution-side experts, charging and service ecosystem participants, and independent industry specialists across APAC, EMEA, and the Americas, which helped fill gaps that desk sources do not explain well. Feedback also helped validate key assumptions such as premium take rates, performance trims sold as a share of total EV deliveries, and near-term production constraints.
Distribution of primary research fieldwork respondents
| Company type | Respondent position | Region |
|---|---|---|
| Top tier: 31% | CXOs: 20% | APAC: 42% |
| Mid tier: 47% | Functional/Unit leaders: 39% | EMEA: 32% |
| Smaller Players: 22% | Managers: 41% | Americas: 26% |
Market-Sizing & Forecasting
Sizing begins with a top-down reconstruction of the demand pool by region, where EV registrations and deliveries are filtered through a performance eligibility screen and then converted to value using region-specific average selling prices. The screen is informed by practical indicators, including minimum driving range expectations, power output and multi-motor adoption, and the presence of performance-oriented trims that command a visible price premium.
To corroborate totals, we run selective bottom-up approximations for reasonableness, including sampled model-level volume checks, channel checks on typical transaction price bands, and consistency checks against announced production capacity and delivery timing. When gaps appear, they are handled by using conservative adoption ranges agreed in primary discussions, then narrowed using observable signals such as model launch cadence and regional incentive design.
Forecasting uses scenario analysis supported by time-series smoothing for near-term demand, since volumes are sensitive to macro conditions and product cycles. Key inputs that are tracked and refreshed include battery cost direction, charging network coverage growth, premium vehicle mix, policy changes for EV subsidies and emission standards, and supply-side constraints for high-output motors and cells.
Data Validation & Update Cycle
Outputs are validated through triangulation across independent signals, and any large variances are flagged for review before they are accepted. Checks include region-by-region comparisons to EV delivery trends, pricing realism versus observed premium segments, and consistency with production and launch timing discussed in interviews.
A multi-step review is followed where the model, assumptions, and calculations are re-checked by another analyst, and outliers trigger a re-contact with selected primary respondents. The report is refreshed annually, and material events such as policy shifts, major platform launches, or supply disruptions can trigger interim updates. Before delivery, a fresh validation pass is completed so clients receive an updated view based on the latest available information.
Mordor Intelligence's Automotive High Performance Electric Vehicles Market Size Compared With Other Published Estimates
Published market sizes for this space can vary a lot because the term high-performance is not used the same way by every publisher, and the boundary between a premium EV and a true performance EV can shift by region. Differences also come from whether plug-in hybrids are counted, how vehicle pricing is handled, and whether figures reflect vehicle revenue only or a wider ecosystem.
By tracking EV delivery volumes, performance-trim mix, and region-level pricing updates, Mordor Intelligence places the high-performance boundary at the vehicle sale level (BEV and PHEV only) and then validates totals against launch timing and supply constraints, which can land far from estimates that use broad EV definitions or long-horizon growth assumptions.
Benchmark comparison
| Source | Market Size | Gaps in Research Methodology |
|---|---|---|
| Mordor Intelligence | USD 230.13 B (2026) | |
| Trade Publisher A | USD 16.92 B (2025) | Often reads closer to a narrow high-performance electric car subset, and the lower base can come from excluding plug-in hybrids and using a tighter vehicle-class definition rather than a broader automotive market view. |
| Industry Publisher B | USD 19.09 B (2025) | Commonly uses a different performance-tier filter and a longer forecast lens with aggressive volume expansion, and it may also mix in powertrain types beyond BEV and PHEV depending on how the category is labeled. |
The spread in the table is mainly explained by scope and classification, not by arithmetic. When the inclusion rules are clearly set (vehicle-only revenue, defined performance eligibility, and consistent currency timing), the model stays traceable to real delivery and pricing signals and can be repeated year after year without relying on hidden assumptions.


Key Questions Answered in the Report
What is the current size of the automotive high performance EVs market?
The automotive high performance EVs market size reached USD 230.13 billion in 2026 and is projected to climb to USD 405.99 billion by 2031.
Which region leads sales of high performance electric vehicles?
Asia-Pacific accounts for 46.32% of revenue, due to China’s manufacturing scale and domestic demand.
Which drivetrain dominates the segment?
Battery Electric Vehicles hold 70.87% share, favored for instant torque and simpler drivetrains.
What motor technology is most common in high performance EVs?
Permanent-magnet synchronous motors command 62.74% share due to their high power density and efficiency.
How fast is the tri/quad-motor architecture segment growing?
Tri- and quad-motor AWD systems are advancing at a 12.47% CAGR through 2031.
What is the biggest restraint facing the industry?
Thermal-management limits remain the primary short-term restraint, shaving 1.8% off projected CAGR until improved cooling solutions mature.
Page last updated on:





