North America Electric Vehicle Market Size and Share
Market Overview
| Study Period | 2019 - 2030 |
|---|---|
| Forecast Data Period | 2025 - 2030 |
| Historical Data Period | 2019 - 2023 |
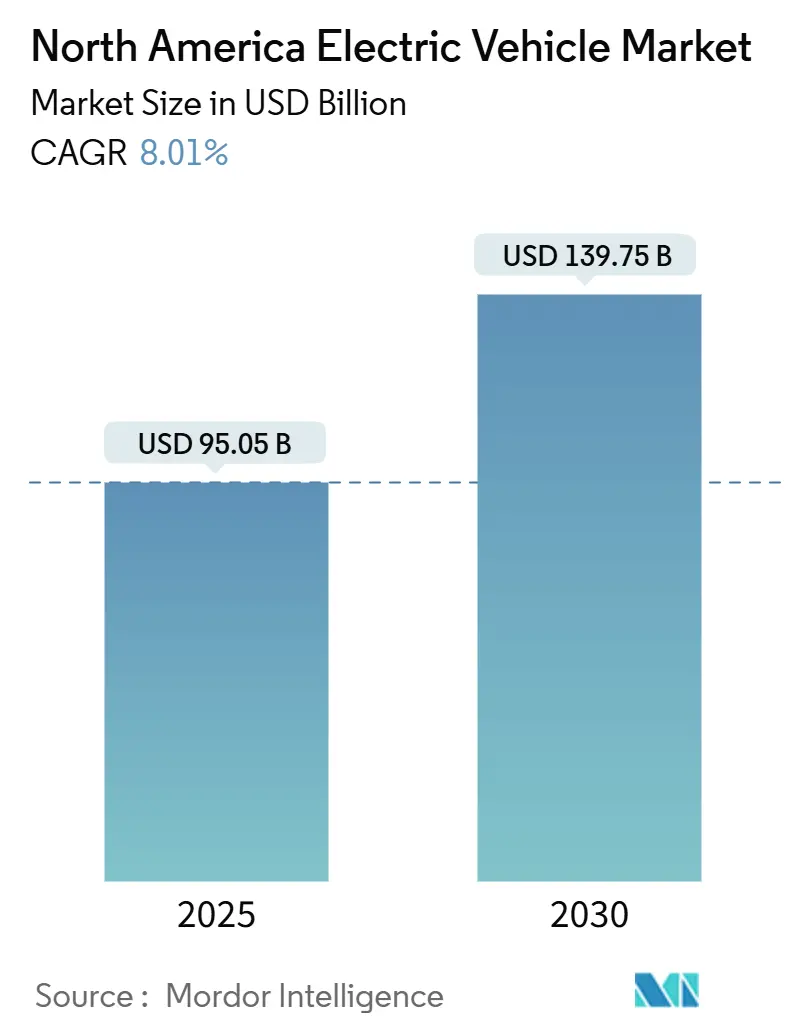
| Market Size (2025) | USD 95.05 Billion |
| Market Size (2030) | USD 139.75 Billion |
| Growth Rate (2025 - 2030) | 8.01% CAGR |
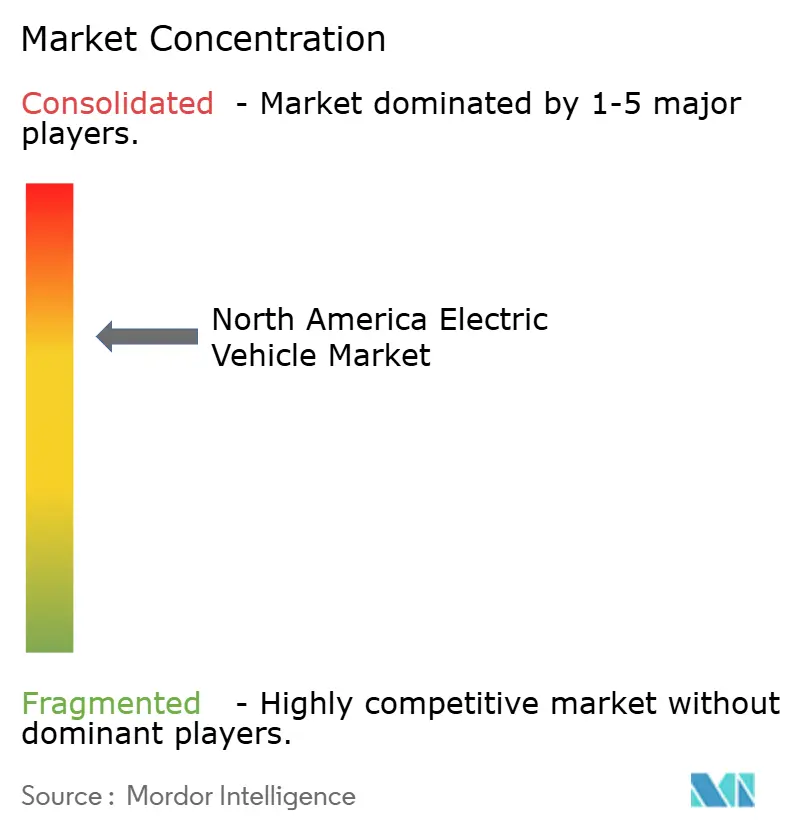
| Market Concentration | Medium |
Major Players *Disclaimer: Major Players sorted in no particular order Image © Mordor Intelligence. Reuse requires attribution under CC BY 4.0. | |
North America Electric Vehicle Market Analysis by Mordor Intelligence
The North American electric vehicle market size reached USD 95.05 billion in 2025 and is projected to advance at an 8.01% CAGR, lifting value to USD 139.75 billion by 2030. This trajectory shows how the North American electric vehicle market is shifting from early-adopter demand to scale economics and policy certainty. Federal incentives under the Inflation Reduction Act, maturing battery supply chains, and a broadening model mix are reinforcing consumer confidence. At the same time, fluctuating infrastructure funding and grid bottlenecks temper near-term momentum. Automakers are reallocating capital toward vertically integrated battery plants, while utilities expand pilots that turn vehicles into grid assets.
Key Report Takeaways
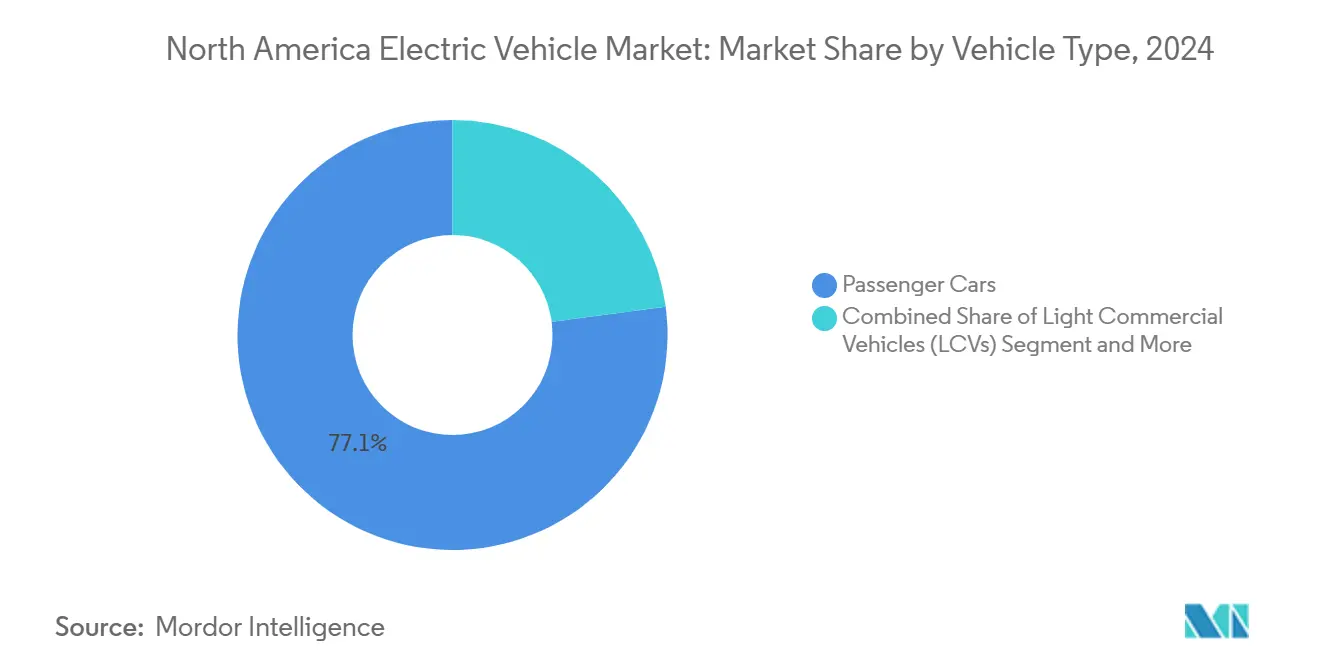
- By vehicle type, passenger cars held 77.13% of the North American electric vehicle market share in 2024, while light commercial vehicles are set to expand at a 9.04% CAGR to 2030.
- By propulsion type, battery electric vehicles led with 68.25% of the North American electric vehicle market share in 2024; fuel-cell electric vehicles recorded the fastest 11.24% CAGR through 2030.
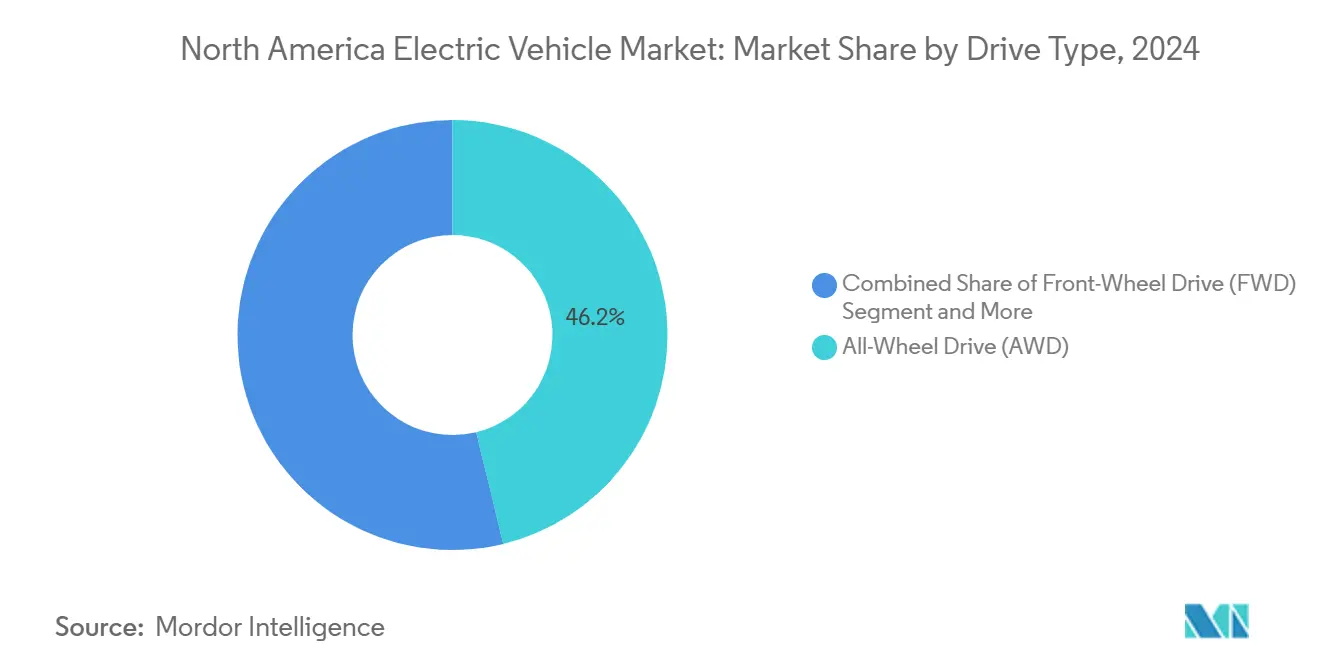
- By drive type, all-wheel drive accounted for 46.19% of the North American electric vehicle market share in 2024 and is advancing at an 8.45% CAGR.
- By power output, 100-250 kW systems captured 55.33% of the North American electric vehicle market share in 2024, while above 250 kW configurations grew at a 9.56% CAGR.
- By country, the United States dominated with 84.12% of the North American electric vehicle market share in 2024; Mexico posts the highest 8.72% CAGR through 2030.
North America Electric Vehicle Market Trends and Insights
Drivers Impact Analysis*
| Driver | (~) % Impact on CAGR Forecast | Geographic Relevance | Impact Timeline |
|---|---|---|---|
| Declining Battery Costs and Range | +2.1% | North America-wide, strongest in the United States and Canada | Long term (≥ 4 years) |
| Federal Tax and IRA Subsidies | +1.8% | United States with spillover to USMCA partners | Medium term (2-4 years) |
| Automaker Electrification Investments | +1.5% | United States and Mexico manufacturing hubs | Long term (≥ 4 years) |
| Domestic USMCA Battery Supply | +1.2% | United States-Mexico-Canada integrated supply chains | Long term (≥ 4 years) |
| Regional Vehicle-to-Grid Pilots | +0.7% | California, Massachusetts, Colorado | Medium term (2-4 years) |
| Integrated Battery-Recycling Ecosystems | +0.4% | Great Lakes region, Texas, Nevada | Long term (≥ 4 years) |
| Source: Mordor Intelligence | |||
Declining Battery Costs and Extended Range
Between 2023 and 2025 average pack cost faced a decline, pushing several crossover and sedan models to purchase-price parity with comparable internal-combustion cars. Industry forecasts suggest a significant reduction in lithium-ion costs in the coming years, although a substantial portion of global cell capacity continues to be concentrated in China, exposing North America's electric vehicle market participants to geopolitical risk. Range anxiety recedes as most 2025 launches top 300 miles on a single charge, though colder northern climates spotlight the trade-off between LFP chemistry and energy density. Eight-hundred-volt platforms slash 10-80% charging times below 20 minutes, reshaping travel behavior and rest-stop economics. Automakers balance nickel-rich chemistries for premium segments against cost-optimized LFP packs for mass-market models.
Federal Tax Incentives and IRA Subsidies
Treasury guidance issued in 2023 defined a split USD 7,500 credit, rewarding North American battery content and critical minerals sourced from free-trade partners [1]“Clean Vehicle Tax Credit Guidance,” Inflation Reduction Act, irs.gov. Eligibility dropped from more than 40 models in the second half of 2023 to around 27 by January 2024, proving that supply-chain rules shape showroom choice. A point-of-sale transfer mechanism moves the credit from a tax refund to an immediate price cut, widening access for moderate-income buyers. Automakers now treat the credit less as a demand lever and more as a compliance hurdle whose value depends on sourcing traceability. Dealer networks gain a new role in validating provenance data, tightening the link between retail operations and upstream mineral flows.
Automakers' Electrification Roadmaps and Investments
Since the IRA passed, North American producers and their cell partners announced significant investments for EV and battery plants. General Motors committed USD 7 billion to a Michigan battery campus, while Ford allocated USD 11.4 billion to a Tennessee mega-site that integrates cell production with assembly. Execution timetables differ: legacy OEMs navigate union talks and permitting, while EV-native companies scale vertically integrated lines in under three years. In one cross-border ecosystem, Honda’s Canadian hub leverages USMCA rules to knit mineral processing, cell fabrication, and vehicle assembly. Platform architectures let automakers reuse core software and power-electronics modules across multiple body styles, amplifying returns on R&D but raising the stakes of platform missteps.
Domestic Battery Supply-Chain Localization Under USMCA Incentives
Rules of origin ratcheting up through 2027 require 75% regional value in vehicle and battery content to qualify for tariff-free trade. Automakers map entire mineral flows from South American lithium brines to Canadian nickel sulphate to prove compliance. Mexican gigafactories benefit from lower labor costs while still scoring as North American under IRA content tests. Supply-chain integration mitigates currency risk and shortens logistics cycles. Mining concessions in Ontario and Quebec accelerate as provincial governments fast-track permits, while the United States offers property-tax abatements to lure cathode plants. The scramble for regional inputs realigns long-standing sourcing built around Asian refiners.
Restraints Impact Analysis*
| Restraint | (~) % Impact on CAGR Forecast | Geographic Relevance | Impact Timeline |
|---|---|---|---|
| Inadequate Public Charging Infrastructure | -1.4% | Rural areas, urban charging deserts | Short term (≤ 2 years) |
| High Upfront Purchase Price | -1.1% | North America-wide mid-market segments | Medium term (2-4 years) |
| BEV Resale Value Uncertainty | -0.8% | United States and Canada | Medium term (2-4 years) |
| Fast-Charging Grid Connection Delays | -0.6% | High-traffic corridors, constrained urban grids | Short term (≤ 2 years) |
| Source: Mordor Intelligence | |||
Inadequate Public Charging Infrastructure Density
Multi-unit dwellers, a major share of the population, face the steepest barrier because home charging is impractical. Charge-point operators chase utilization, concentrating assets in urban corridors and ignoring rural routes, which deepens geographic inequity. National Electric Vehicle Infrastructure grants mandate 150 kW minimum power and four-port sites every 50 miles along highways, yet those economics rarely pencil out for communities with fewer than 15,000 residents. Low-voltage curbside solutions could solve the gap, but current funding rules discourage smaller installations that would serve suburban neighborhoods.
High Upfront Purchase Price vs. ICE Alternatives
Average transaction price for new EVs and the light-vehicle median reflects battery and power-electronics costs that account for a notable share of the build. Federal credits offset part of the gap, but income and MSRP caps exclude many premium models and high-earning buyers. Automakers face a trade-off between volume growth and margin preservation, with some absorbing losses to meet corporate emission targets. Chinese brands entering Mexico with lower cost structures threaten to undercut domestic prices in value segments once the USMCA content rules permit. Inflation trends in nickel and lithium complicate cost-down roadmaps, even as cell-chemistry shifts to cheaper LFP.
*Our forecasts treat driver/restraint impacts as directional, not additive. The impact forecasts reflect baseline growth, mix effects, and variable interactions.
Segment Analysis
By Vehicle Type: Commercial Fleets Drive Electrification
Passenger cars controlled 77.13% of the North America electric vehicle market in 2024, anchoring early adoption yet masking a surge in fleet demand. Light commercial vehicles expand at a 9.04% CAGR thanks to predictable duty cycles, centralized depots, and growing corporate sustainability mandates. Amazon deployed more than 1,000 Rivian vans in 2025, while UPS targets a significant electric share by 2030 to cut fuel and maintenance spend. Municipal transit agencies leverage the Clean School Bus Program’s USD 5 billion funding to electrify routes; New York ordered 265 zero-emission buses, signaling confidence in heavy battery packs that meet 200-mile daily ranges. Medium and heavy trucks lag due to payload penalties but offer outsized revenue potential because average selling prices are rising. Solid-state batteries under development promise weight reductions that could accelerate adoption late in the decade.
Industry entrants tailor software for telematics and energy-management dashboards, enabling fleets to schedule charging when rates are low and even sell power back to the grid during peaks. Over-the-air updates cut downtime and align vehicle performance with route changes. These ecosystem services widen the business case beyond fuel savings, drawing logistic operators deeper into the North American electric vehicle market. As fleet penetration rises, residual-value risk falls because operators run structured replacement cycles that smooth resale volatility. Insurers respond by launching usage-based premiums tied to real-time battery health, further professionalizing the asset class.


By Propulsion Type: BEV Dominance Faces FCEV Challenge
Battery electric vehicles held 68.25% of the North America electric vehicle market in 2024, leveraging a mature charging network and lower drivetrain complexity. The North American electric vehicle market size for BEVs benefits from economies of scale in shared skateboard platforms that spread R&D cost across sedans, crossovers, and pickup trucks. Yet hydrogen fuel-cell electric vehicle post the fastest 11.24% CAGR as trucking firms test long-haul routes where 15-minute refueling and 450-mile range exceed current battery limits. Plug-in hybrids remain a transitional bridge for buyers wary of charging gaps, though shrinking incentive eligibility constrains their future role.
OEMs hedge bets: Toyota and Hyundai expand Class 8 fuel-cell trials, while Tesla and Daimler press on with giant battery packs and megawatt chargers. Policymakers avoid picking winners, instead setting technology-neutral ZEV mandates that push both chemistries. Over time, heavy-duty fleet economics will decide which propulsion leads each duty cycle, but competitive coexistence is likely through the decade.
By Drive Type: AWD Performance Drives Premium Adoption
All-wheel drive captured 46.19% of the North America electric vehicle market in 2024 and sustained the highest 8.45% CAGR, illustrating how dual-motor setups bring sports-car acceleration to mainstream SUVs. Tesla’s Model Y Performance and Ford’s F-150 Lightning normalized sub-4-second 0–60 mph times, and consumers now expect AWD even in compact crossovers. Front-wheel drive remains the budget choice for smaller hatchbacks where cost sensitivity outweighs traction gains. Rear-wheel drive is relegated to enthusiast coupes and select luxury sedans, as packaging demands of battery packs favor either dual-motor AWD or simplified FWD layouts.
Eight-hundred-volt electronics improve the efficiency of multi-motor systems, mitigating range penalties and supporting bidirectional power flow for vehicle-to-home backup. Regulators monitor efficiency differences among drive types, requiring standardized testing cycles highlighting improvements in inverter and e-axle technology. Suppliers race to deliver integrated motor-inverter-transmission units that shave weight and cost, making AWD more accessible.
By Power Output: High-Performance Systems Gain Traction
Systems rated between 100 and 250 kW held 55.33% of the North America electric vehicle market in 2024, balancing spirited acceleration with moderate battery drain. Automakers optimize this band for family crossovers, where 0–60 mph in under six seconds meets consumer expectations. Powertrains above 250 kW record a 9.56% CAGR, feeding a segment that spans electric pickups, luxury SUVs, and sports sedans. Lucid’s 400-kW Air Sapphire and Mercedes-EQ flagships showcase supercar capability, prompting infrastructure providers to deploy 350-kW chargers that fill 100 kWh packs in under 18 minutes. Sub-100 kW applications persist in urban-mobility pods and budget compacts, but declining silicon-carbide costs erode their pricing edge.
Next-generation inverters integrate gallium-nitride switches that elevate switching frequency, boosting drive efficiency at highway speed. Thermal-management advances, such as oil-cooled stators, sustain peak power longer, widening the appeal of high-output variants. Automakers see performance trims as profit drivers that justify subscription-based unlocks for additional horsepower, introducing recurring-revenue models.
Geography Analysis
The North American electric vehicle market draws 84.12% of sales from the United States, where state and federal incentives can stack above USD 10,000 per vehicle. California accounts for a significant share of the national registration of new light-vehicle sales, signaling maturity that lifts neighboring states through used-vehicle diffusion [2]“Zero-Emission Vehicle Sales Update 2024,” California Energy Commission, energy.ca.gov. Dense charging corridors align with I-5 and I-95, guiding vacation travel patterns and boosting tourism at sites where fast chargers encourage 30-minute dwell times. Policy uncertainty emerged in 2025 with a temporary pause in National Electric Vehicle Infrastructure disbursements, yet the statutory structure of the Inflation Reduction Act shields core tax credits.
Canada contributes a smaller slice to the North American electric vehicle market size yet boasts advanced policy tools, including a federal ZEV sales mandate that hits 20% in 2026. Quebec leads provinces with a significant adoption rate, driven by hydro-electricity that undercuts gasoline on an energy-equivalent basis. British Columbia follows closely through mandates that require charging points in new multifamily buildings. Honda’s USD 11 billion Canadian campus underlines how cross-border mineral flows from nickel sulfide mines in Ontario integrate with mid-continent cathode plants. Cold-weather testing hubs near Kapuskasing spur innovation in battery preconditioning and heat-pump HVAC technology, which is later exported to snow-belt markets of the United States.
Mexico shows the fastest 8.72% CAGR, reflecting large announced investments rather than domestic retail demand. Tesla’s planned Gigafactory in Nuevo León and multiple Chinese OEM projects rebrand Mexico from an export assembly base to a strategic EV cluster. USMCA rules let vehicles meeting 75% regional content move tariff-free into the United States, making Mexico a cost-competitive hedge against Asian supply disruption. Domestic adoption remains below the new sales because average household income limits EV affordability, and public charging is growing nationwide. Federal energy policy that favors fossil-fuel generation also dampens the environmental case. Over time, workplace and fleet programs may seed a used-vehicle pipeline that makes EVs attainable for Mexican consumers.
Competitive Landscape
Tesla’s share in the North America electric vehicle market slid by mid-2024 as model cycles aged and rivals launched price-competitive crossovers. General Motors paired its Equinox EV with Cadillac luxury variants that stretch Ultium-platform economics[3]“Ultium Platform Strategy Brief 2025,” General Motors, gm.com. Ford stumbled when battery-supplier issues forced an F-150 Lightning shutdown, yet the company recovered by prioritizing fleet variants that leverage commercial-services subscriptions. Hyundai-Kia exploited fast-charger compatibility across networks to punch above its weight, while Volkswagen folded its Scout brand relaunch into a broader pickup strategy.
Start-ups carve out niches where incumbents move slowly. Lion Electric secures school-bus deals bundling telematics and bidirectional charging, insulating margins through service contracts. Nikola turns to fuel-cell Class 8 leases bundled with a hydrogen supply, reducing operator capital risk. Meanwhile, global battery manufacturers scale plants in the United States under joint ventures that balance IP protection with incentive access. LG Energy Solution co-develops packs with GM in Ohio, while Panasonic’s Kansas facility extends long-term supply to Tesla and Mazda.
Software overlays emerge as the next battleground. Over-the-air feature unlocks, autonomous-driving subscriptions, and energy-trading platforms generate recurring revenue that may outpace hardware margins by 2030. Automakers race to patent thermal-event detection algorithms and cell-balancing routines. The easing of Tesla’s Supercharger exclusivity via NACS licensing removes a key moat, spurring infrastructure players like ChargePoint and Electrify America to differentiate on uptime guarantees and loyalty programs.
North America Electric Vehicle Industry Leaders
Tesla, Inc.
General Motors Company
Ford Motor Company
Hyundai Motor Company
Rivian Automotive, Inc.
- *Disclaimer: Major Players sorted in no particular order

Recent Industry Developments
- May 2025: Toyota confirmed production of two all-electric models in the United States starting 2026 as part of a plan to launch seven EVs by 2027.
- April 2025: Foxconn announced it will unveil an in-house designed passenger EV in North America during 2025 in partnership with an undisclosed automaker.
- January 2025: The Metropolitan Transportation Authority ordered 265 additional zero-emission buses, expanding its New York City fleet transition.
- January 2025: Honda revealed plans to sell a sub-USD 30,000 compact EV in North America by 2026, manufactured locally under its new Honda 0 Series platform.


North America Electric Vehicle Market Report Scope
| Passenger Cars |
| Light Commercial Vehicles (LCVs) |
| Medium and Heavy Commercial Vehicles (M&HCVs) |
| Buses and Coaches |
| Battery Electric Vehicles (BEV) |
| Plug-in Hybrid Electric Vehicles (PHEV) |
| Hybrid Electric Vehicles (HEV) |
| Fuel-Cell Electric Vehicles (FCEV) |
| Front-Wheel Drive (FWD) |
| Rear-Wheel Drive (RWD) |
| All-Wheel Drive (AWD) |
| Below 100 kW |
| 100-250 kW |
| Above 250 kW |
| United States |
| Canada |
| Mexico |
| By Vehicle Type | Passenger Cars |
| Light Commercial Vehicles (LCVs) | |
| Medium and Heavy Commercial Vehicles (M&HCVs) | |
| Buses and Coaches | |
| By Propulsion Type | Battery Electric Vehicles (BEV) |
| Plug-in Hybrid Electric Vehicles (PHEV) | |
| Hybrid Electric Vehicles (HEV) | |
| Fuel-Cell Electric Vehicles (FCEV) | |
| By Drive Type | Front-Wheel Drive (FWD) |
| Rear-Wheel Drive (RWD) | |
| All-Wheel Drive (AWD) | |
| By Power Output | Below 100 kW |
| 100-250 kW | |
| Above 250 kW | |
| By Country | United States |
| Canada | |
| Mexico |


Key Questions Answered in the Report
What is the 2025 value of the North America electric vehicle market?
The market reached USD 95.05 billion in 2025.
How fast is the North America electric vehicle market expected to grow?
It is forecast to post an 8.01% CAGR through 2030.
Which vehicle category leads North American EV sales today?
Passenger cars account for 77.13% of 2024 sales.
Which propulsion technology is growing quickest?
Fuel-cell electric vehicles show an 11.24% CAGR to 2030.
Page last updated on:


