Vehicle-to-Grid (V2G) Market Size and Share
Market Overview
| Study Period | 2021 - 2031 |
|---|---|
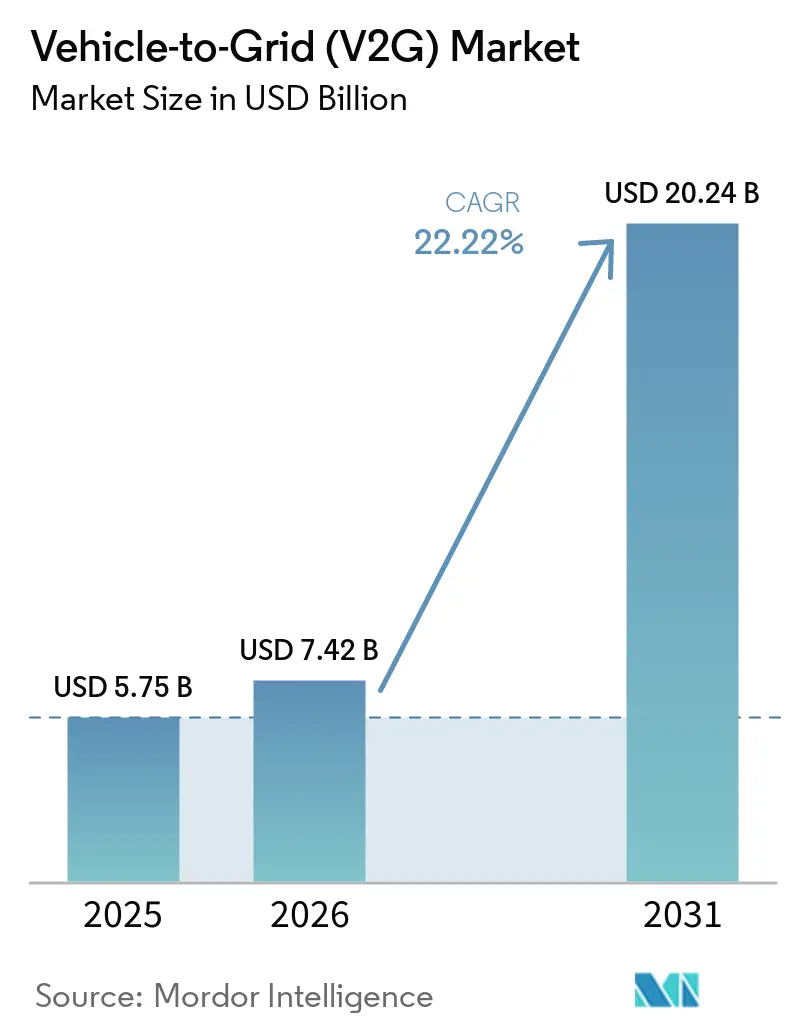
| Market Size (2026) | USD 7.42 Billion |
| Market Size (2031) | USD 20.24 Billion |
| Growth Rate (2026 - 2031) | 22.22% CAGR |
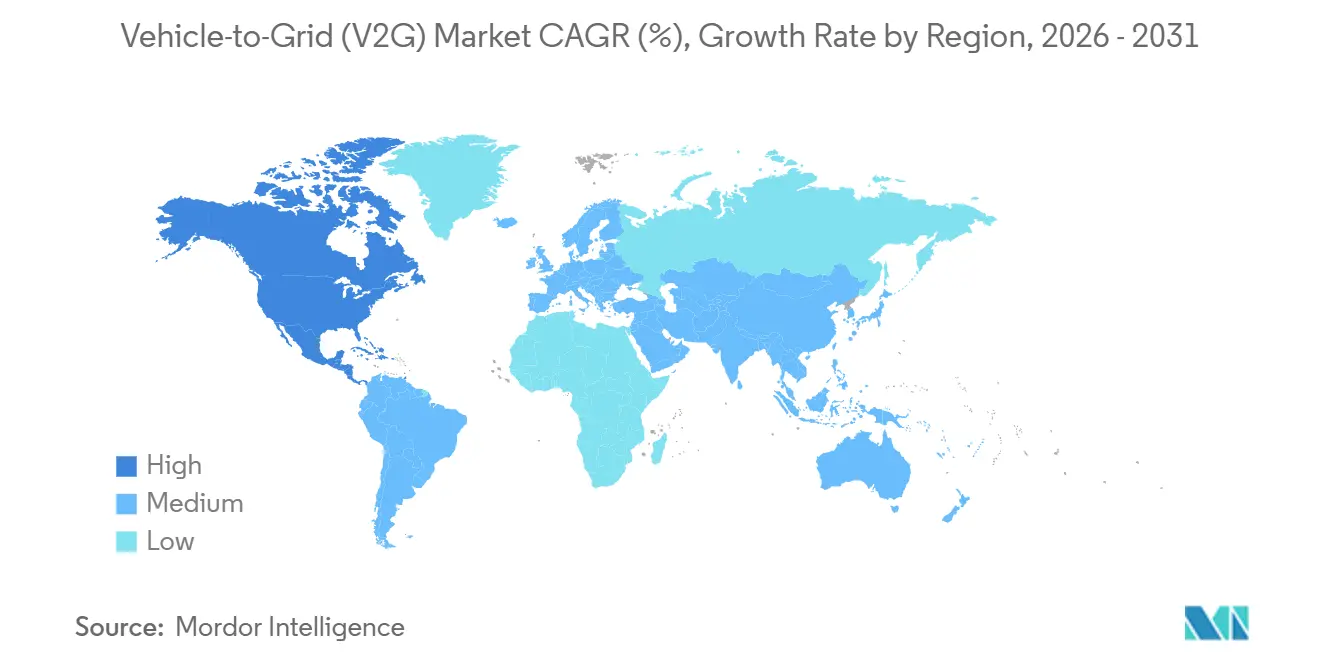
| Fastest Growing Market | North America |
| Largest Market | Europe |
| Market Concentration | Medium |
Major Players *Disclaimer: Major Players sorted in no particular order Image © Mordor Intelligence. Reuse requires attribution under CC BY 4.0. | |
Vehicle-to-Grid (V2G) Market Analysis by Mordor Intelligence
The Vehicle-to-Grid Market size was valued at USD 5.75 billion in 2025 and is estimated to grow from USD 7.42 billion in 2026 to reach USD 20.24 billion by 2031, at a CAGR of 22.22% during the forecast period (2026-2031). Surging recognition of distributed EV batteries as dispatchable grid assets, rapid incorporation of bidirectional inverters as standard OEM equipment, and regulator-mandated enrollment targets across Europe and North America are accelerating commercialization. Utilities increasingly treat mobile storage as a non-wires alternative, automakers expect recurring software revenue instead of one-time hardware margins, and regulators now provide the interconnection clarity that was missing before 2024. Europe retained 40.2% share in 2025, yet North America’s 25.1% CAGR through 2031 signals a regional inflection owing to California’s 150 MW V2G mandate and the surge of fleet-aggregator platforms. Market momentum is reinforced by falling bidirectional-charger capex, Wallbox’s Quasar 2 launched at roughly USD 4,000, down 43% from 2023, along with Germany’s move to cut ancillary-service bid thresholds from 5 MW to 1 MW, allowing mid-size fleets to earn grid revenue.
Key Report Takeaways
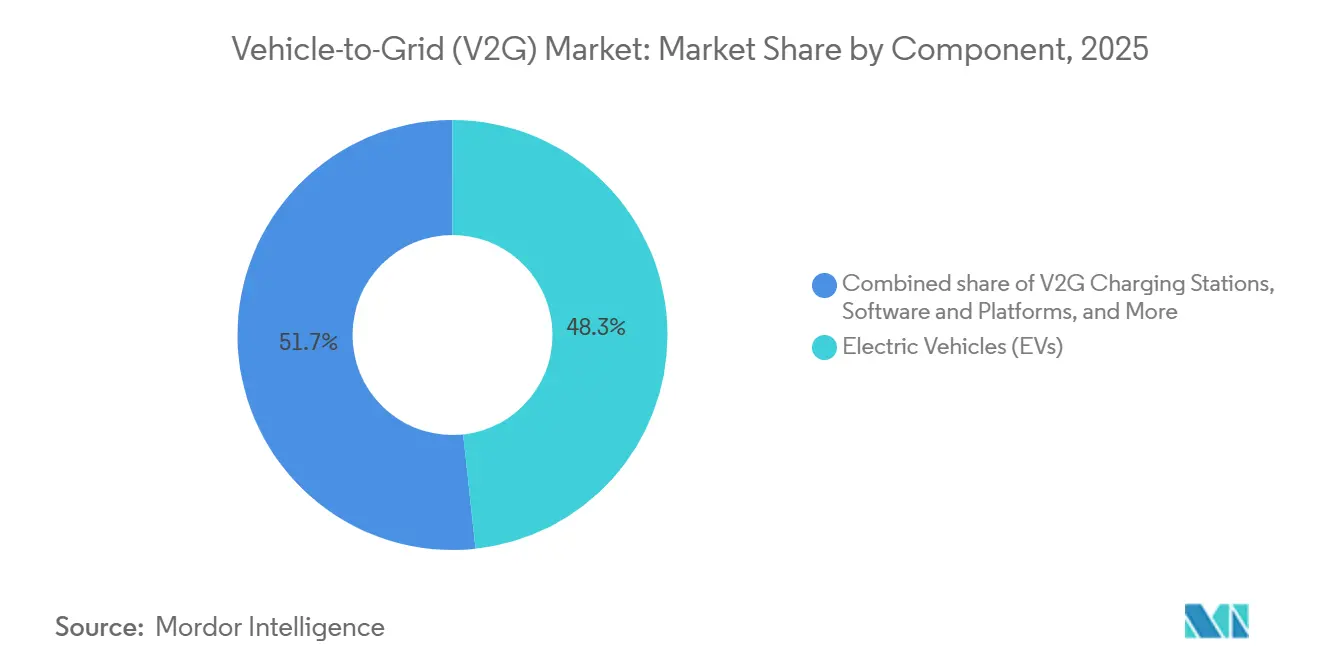
- By component, Electric Vehicles led with 48.3% of the Vehicle-to-Grid (V2G) market share in 2025, while V2G Charging Stations are projected to advance at a 25.8% CAGR through 2031.
- By charging infrastructure, AC chargers claimed 57.6% of 2025 revenue; hybrid AC-plus-DC systems are poised for the fastest growth, expanding at a 29.2% CAGR to 2031.
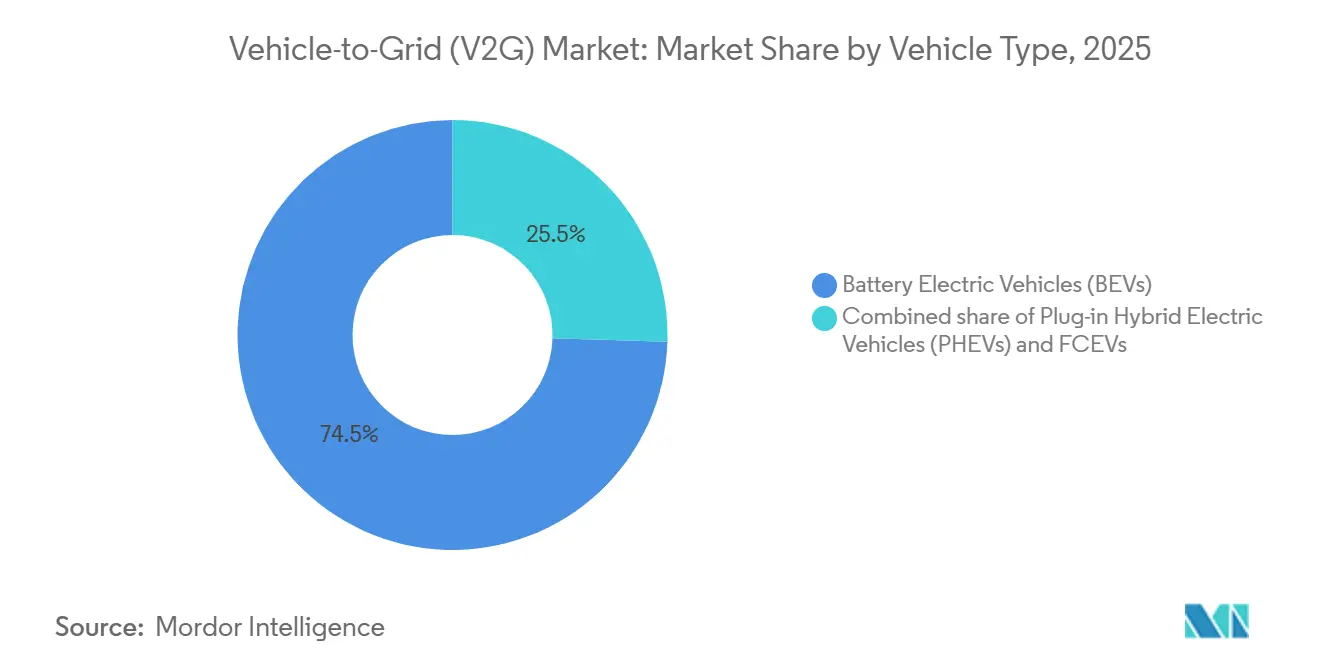
- By vehicle type, Battery Electric Vehicles dominated with a 74.5% share in 2025 and are forecast to grow at 23.7% CAGR through 2031.
- By application, commercial fleets held 74.1% of deployments in 2025, and the segment is expected to maintain a 23.5% CAGR on the back of school-bus and delivery-van aggregation programs.
- By geography, Europe led with 40.2% revenue share in 2025; North America is forecast to log the fastest regional CAGR at 25.1% through 2031.
Note: Market size and forecast figures in this report are generated using Mordor Intelligence’s proprietary estimation framework, updated with the latest available data and insights as of January 2026.
Global Vehicle-to-Grid (V2G) Market Trends and Insights
Drivers Impact Analysis*
| Driver | (~) % Impact on CAGR Forecast | Geographic Relevance | Impact Timeline |
|---|---|---|---|
| Rapid EV parc expansion & supportive incentives | +5.2% | Global, with concentration in China, Europe, North America | Medium to Long term (2-4+ years) |
| Accelerating renewables share driving grid-flexibility need | +4.8% | Global, particularly Europe, California, Australia | Medium to Long term (2-4+ years) |
| Aggregator-based business models gaining regulatory clarity | +3.5% | Europe, North America, select APAC markets | Short to Medium term (≤ 4 years) |
| Declining bidirectional charger CAPEX | +2.7% | Global | Short to Medium term (≤ 4 years) |
| Blockchain-enabled micro-settlements for V2G transactions | +1.8% | Global, with early adoption in Europe and select North American markets | Long term (≥ 4 years) |
| Second-life battery integration with V2G networks | +1.5% | Global, emerging in China, Europe, North America | Long term (≥ 4 years) |
| Source: Mordor Intelligence | |||
Rapid EV Parc Expansion & Supportive Incentives
Fleet electrification compresses payback periods because operators can layer time-of-use arbitrage, demand-charge reduction, and frequency-regulation income that residential owners cannot easily capture. Japan’s Ministry of Economy, Trade, and Industry paid JPY 750,000 (≈ USD 5,000) per V2H installation in 2025, spurring over 10,000 Nissan Leaf connections, a design that ties subsidies to measured grid services rather than hardware purchases [1]Ministry of Economy, Trade and Industry, “Subsidy Scheme for V2H,” meti.go.jp. California’s Public Utilities Commission ordered 150 MW of enrolled V2G capacity by 2027 and a 7 GW load-shift goal by 2030, eliminating policy ambiguity that suppressed projects before 2024 [2]California Public Utilities Commission, “Decision 25-01-020,” cpuc.ca.gov. China’s National Energy Administration started a 100-vehicle pilot in Suzhou in 2024, signaling future nationwide integration, though provincial interconnection rules remain uneven. Markets that impose binding enrollment or cost-recovery mechanisms attract disproportionate investment, while voluntary jurisdictions continue to lag.
Accelerating Renewables Share Driving Grid-Flexibility Need
Variable renewable penetration above 40% in several European grids during 2025 increases intraday volatility that EV batteries can arbitrage at minimal incremental cost. Germany’s Bundesnetzagentur opened frequency-containment reserves to aggregated EV fleets at 1 MW minimum bids in 2025, enabling mid-size depots to participate [3]Bundesnetzagentur, “Ancillary Services Reform,” bundesnetzagentur.de. Denmark’s eMabler users earned USD 38-76 per month from frequency-regulation contracts, rising to USD 152 for commercial fleets with optimized dispatch. Australia’s ARENA-funded REVS trial proved 150 vehicles could respond within 200 ms, outperforming spinning reserves. As curtailment events multiply, utilities prefer V2G over new peaker plants because distributed batteries avoid transmission upgrades and deliver sub-second ramp rates.
Aggregator-Based Business Models Gaining Regulatory Clarity
Unbundling of energy, capacity, and frequency products allows aggregators to switch revenue streams in real time, a flexibility individual drivers cannot attain. The EU’s Regulation 2025/656 mandates ISO 15118-20 compliance on all public chargers by 2027, removing the proprietary protocols that once forced aggregators into closed ecosystems. Nuvve’s USD 400 million New Mexico contract uses a 15-year availability fee plus performance bonuses, transferring residual-value risk to the utility. ChargeScape expects to enroll 6 million OEM-linked vehicles by 2028, showing that automakers aim to keep the entire software margin. Vertically integrated platforms will likely dominate household segments, leaving commercial fleets to specialist aggregators.
Declining Bidirectional Charger CAPEX
Hardware cost compression democratizes access, yet commercial operators accrue the greatest benefit because they can cycle chargers daily. Wallbox’s Quasar 2 retails at ≈ USD 4,000, a 43% drop from 2023, thanks to silicon-carbide inverters and modular enclosures [4]Wallbox, “Quasar 2 Product Sheet,” wallbox.com. Fermata Energy’s FE-15 sells for ≈ USD 5,000 installed, undercutting home battery systems priced above USD 10,000 for equivalent capacity. Academic modeling shows profitability at 3-5 years for depot-scale fleets but 10-17 years for single-family households unless time-variant export tariffs are adopted. Commercial adoption will therefore accelerate even as residential uptake waits for tariff reform.
Restraints Impact Analysis*
| Restraint | % Impact on CAGR Forecast | Geographic Relevance | Impact Timeline |
|---|---|---|---|
| Battery degradation & warranty concerns | -1.8% | Global | Medium term (2-4 years) |
| Interoperability & protocol fragmentation | -1.5% | Global, acute in North America and APAC | Short to Medium term (≤ 4 years) |
| EV-SE cyber-security vulnerabilities | -1.2% | Global, particularly critical in Europe and North America with stringent data protection regulations | Short to Medium term (≤ 4 years) |
| Distribution transformer stress from reverse power flows | -1.4% | North America and Europe, concentrated in residential neighborhoods with aging grid infrastructure | Medium term (2-4 years) |
| Source: Mordor Intelligence | |||
Battery Degradation & Warranty Concerns
Daily V2G cycles impose 9-14% state-of-health loss over 10 years, translating to roughly USD 140/MWh in make-whole payments by 2030. Most OEM warranties exclude grid discharge; Nissan’s Leaf warranty voids coverage if telemetry detects excessive export events. Tesla’s Cybertruck limits owners to 365 discharge cycles annually, effectively blocking daily V2G without voiding the 8-year battery warranty. Without tiered warranties that price grid duty, V2G remains a commercial-fleet proposition.
Interoperability & Protocol Fragmentation
Legacy CHAdeMO, CCS, and Tesla’s North American Charging Standard force depots to over-provision chargers by 30-50%, inflating capex. ISO 15118-20 becomes mandatory in the EU on 1 Jan 2027, yet older CHAdeMO hardware lacks upgrade paths. Japan’s CHAdeMO 3.0 enables 500 kW bidirectional power but remains incompatible with CCS systems elsewhere. Tesla opened its connector design in 2024 but withheld crucial software APIs, making genuine interoperability elusive.
*Our forecasts treat driver/restraint impacts as directional, not additive. The impact forecasts reflect baseline growth, mix effects, and variable interactions.
Segment Analysis
By Component: Margin Migration From Hardware to Software
Electric Vehicles supplied 48.3% revenue in 2025, yet V2G Charging Stations are forecast to climb at 25.8% CAGR because infrastructure players now package energy-management software that earns monthly fees rather than one-time hardware profits. Energy-management platforms charge fleets USD 15-30 per vehicle monthly and earn 60-70% gross margins, dwarfing the 20-30% typical for chargers.
Software’s emergence is reshaping the Vehicle-to-Grid (V2G) market; component suppliers that once thrived on metal-and-plastic margins must now master telemetry, ISO 15118-20 compliance, and real-time dispatch. The Vehicle-to-Grid (V2G) market size attributable to software is consequently expanding faster than aggregate growth, while commoditized smart meters and communication devices are bundled into utility upgrades with limited standalone revenue potential.


By Charging Infrastructure: Hybrid Systems Balance Capital and Speed
AC equipment captured 57.6% of 2025 revenue because overnight dwell times allow 7-11 kW charging at low cost. Still, hybrid AC-plus-DC solutions are projected to deliver the highest 29.2% CAGR, blending cheap AC overnight charging with 50-150 kW DC discharge for ancillary-service contracts.
Hybrid platforms thus strike a pragmatic balance: installed at ≈ USD 12,000, they undercut standalone DC hardware by one-third and shorten payback for school-bus depots to four years on frequency-regulation income. This versatility underpins the Vehicle-to-Grid (V2G) market’s shift toward infrastructure that supports both commuting energy and grid-service monetization without duplicating assets.
By Vehicle Type: Battery Capacity Drives Monetization
Battery Electric Vehicles held 74.5% share in 2025 and show a 23.7% CAGR outlook because 60-100 kWh packs sustain 2-4 hour discharges required for frequency regulation. Plug-in hybrids’ 10-20 kWh batteries limit participation to niche peak-shaving roles.
Tesla’s Cybertruck, packing 123 kWh, and Nissan’s Leaf, with 62 kWh, illustrate why larger packs dominate. As battery prices fell to ≈ USD 100/kWh in 2025, the Vehicle-to-Grid (V2G) market unlocked new profitability bands, reinforcing the preference for BEVs over PHEVs and fuel-cell vehicles in grid-service applications.
By Application: Commercial Fleets Aggregate Scale
Commercial fleets represented 74.1% of deployments in 2025 and are projected to compound at 23.5% CAGR as operators monetize idle dwell time across thousands of buses, vans, and municipal vehicles. School-bus programs earn up to USD 200,000 per vehicle over 15 years through availability plus performance contracts, offsetting nearly half of lifetime operating costs.
Individual prosumers face transformer-upgrade fees of USD 500-2,000 per vehicle and rarely access frequency-response markets without an aggregator, dampening residential traction. Unless utilities introduce dynamic export tariffs nationwide, the Vehicle-to-Grid (V2G) market will continue to be weighted toward fleet aggregation.
Geography Analysis
Europe retained 40.2% share in 2025, propelled by Germany’s 1 MW bid threshold and the EU-wide ISO 15118-20 mandate. The United Kingdom’s dynamic export tariffs triple peak-hour prices, halving residential payback times, and French automaker Renault Group's 500-vehicle Utrecht trial proved passenger cars can satisfy RTE’s balancing requirements.
North America is the fastest-growing region, expanding at 25.1% CAGR through 2031, with California’s 150 MW enrollment target and ChargeScape’s 6 million-vehicle platform providing scale. Canadian pilots in Ontario and Quebec demonstrate technical readiness, yet the absence of export tariffs delays commercial rollouts. Mexico remains nascent, though cross-border utility contracts hint at future uptake.
Asia-Pacific growth hinges on China’s State Grid pilots in Suzhou and Shanghai, Japan’s USD 4716 V2H subsidy, and South Korea’s 500-vehicle frequency-regulation test. Protocol fragmentation between CHAdeMO and CCS still inflates costs, and ASEAN markets await higher EV penetration before committing to large deployments. Australia’s ARENA-funded REVS project confirms technical viability but must navigate fragmented National Electricity Market rules.

Competitive Landscape
The Vehicle-to-Grid (V2G) market is moderately fragmented. Companies such as Nissan, Tesla, and BYD are integrating software solutions to capture a significant share of grid-service margins. For instance, Nissan has taken a major stake in ChargeScape, aiming to enroll 6 million vehicles by 2028. Meanwhile, specialist aggregators like Nuvve and Fermata Energy continue to secure municipal and school bus contracts valued at hundreds of millions of dollars, indicating that there is still space for niche players in the market.
Hardware suppliers ABB, Siemens, and Wallbox race to the bottom on charger pricing; Wallbox’s USD 4,000 Quasar 2 underscores ongoing commoditization. Disruptors such as Hitachi Energy’s AI-driven e-mesh and blockchain micro-settlement start-ups promise 30-70% transaction-cost reductions, challenging legacy aggregator fee structures. Compliance with IEC 62443 cybersecurity norms is emerging as a key purchasing criterion for critical-infrastructure fleets.
Vehicle-to-Grid (V2G) Industry Leaders
Nissan Motor Corporation
Enel X
Tesla Inc.
Nuvve Holding Corp.
Denso Corporation
- *Disclaimer: Major Players sorted in no particular order

Recent Industry Developments
- July 2025: Eaton signed an agreement to acquire Resilient Power Systems Inc., a developer of solid-state transformers for high-power DC applications in the EV market, enhancing power distribution efficiency for V2G applications.
- April 2025: ChargePoint announced a maximum-speed bidirectional AC architecture featuring charging speeds up to 19.2 kW in North America and 22 kW in Europe, with dynamic load balancing and smart-home integration capabilities.
- April 2025: Nuvve acquired most of Fermata Energy's assets for USD 659,000, forming the Fermata Energy II subsidiary to scale bidirectional-energy solutions and develop integrated forecasting and optimization software.
- January 2025: Wallbox and Bidirectional Energy received USD 2.2 million in funding from the California Energy Commission for their Bidirectional Residential V2X Demonstration Project, installing Quasar 2 bidirectional chargers in 120 homes to enhance energy-management capabilities.


Global Vehicle-to-Grid (V2G) Market Report Scope
Vehicle-to-Grid (V2G) technology allows electric vehicles (EVs) to both consume electricity from the grid and return power to it through bidirectional charging. This capability transforms EVs into mobile energy storage systems, aiding in balancing supply and demand, supporting renewable energy integration, enhancing grid stability, and offering economic advantages to EV owners. V2G plays a significant role in advancing smarter and more sustainable energy systems.
The global Vehicle-to-Grid (V2G) market is segmented by component, charging infrastructure, vehicle type, application, and geography. By component, the market is segmented into electric vehicles, V2G charging stations, smart meters and communication devices, energy management systems, and software and platforms. By charging infrastructure, the market is segmented into AC charging, DC charging, and hybrid systems. By vehicle type, the market is segmented into battery electric vehicles (BEVs), plug-in hybrid electric vehicles (PHEVs), and fuel cell electric vehicles (FCEVs). By application, the market is segmented into commercial and individual users. By geography, the market is analyzed across North America, Europe, Asia-Pacific, South America, the Middle East, and Africa. The report also covers market size and forecasts for the global V2G market across major countries within these regions, with all segment values presented in USD.
| Electric Vehicles (EVs) |
| V2G Charging Stations |
| Smart Meters and Communication Devices |
| Energy Management Systems (EMS) |
| Software and Platforms |
| AC Charging |
| DC Charging |
| Hybrid |
| Battery Electric Vehicles (BEVs) |
| Plug-in Hybrid Electric Vehicles (PHEVs) |
| Fuel Cell Electric Vehicles (FCEVs) |
| Commercial |
| Individual |
| North America | United States |
| Canada | |
| Mexico | |
| Europe | Germany |
| United Kingdom | |
| France | |
| Italy | |
| NORDIC Countries | |
| Russia | |
| Rest of Europe | |
| Asia-Pacific | China |
| India | |
| Japan | |
| South Korea | |
| ASEAN Countries | |
| Rest of Asia-Pacific | |
| South America | Brazil |
| Argentina | |
| Rest of South America | |
| Middle East and Africa | Saudi Arabia |
| United Arab Emirates | |
| South Africa | |
| Egypt | |
| Rest of Middle East and Africa |
| By Component | Electric Vehicles (EVs) | |
| V2G Charging Stations | ||
| Smart Meters and Communication Devices | ||
| Energy Management Systems (EMS) | ||
| Software and Platforms | ||
| By Charging Infrastructure | AC Charging | |
| DC Charging | ||
| Hybrid | ||
| By Vehicle Type | Battery Electric Vehicles (BEVs) | |
| Plug-in Hybrid Electric Vehicles (PHEVs) | ||
| Fuel Cell Electric Vehicles (FCEVs) | ||
| By Application | Commercial | |
| Individual | ||
| By Geography | North America | United States |
| Canada | ||
| Mexico | ||
| Europe | Germany | |
| United Kingdom | ||
| France | ||
| Italy | ||
| NORDIC Countries | ||
| Russia | ||
| Rest of Europe | ||
| Asia-Pacific | China | |
| India | ||
| Japan | ||
| South Korea | ||
| ASEAN Countries | ||
| Rest of Asia-Pacific | ||
| South America | Brazil | |
| Argentina | ||
| Rest of South America | ||
| Middle East and Africa | Saudi Arabia | |
| United Arab Emirates | ||
| South Africa | ||
| Egypt | ||
| Rest of Middle East and Africa | ||


Key Questions Answered in the Report
What is the projected value of the Vehicle-to-Grid (V2G) market in 2031?
The market is forecast to reach USD 20.24 billion by 2031.
Which region is expected to grow fastest in V2G adoption?
North America shows the highest growth, expanding at a 25.1% CAGR through 2031, led by California’s enrollment mandates.
Why do commercial fleets dominate current V2G deployments?
Fleets aggregate hundreds of vehicles, meeting 1-5 MW bid thresholds and accessing multiple revenue streams that individual owners cannot.
How are hardware costs trending for bidirectional chargers?
Prices are falling rapidly; Wallbox’s Quasar 2 launched at USD 4,000, down 43% from the prior generation, shrinking payback times, especially for fleets.
What technical standard underpins interoperability in Europe from 2027?
ISO 15118-20 becomes mandatory for all public chargers in the European Union starting 1 January 2027, ensuring plug-and-charge authentication and bidirectional power flow.
Page last updated on:


