Driver Safety Market Size and Share
Market Overview
| Study Period | 2019 - 2030 |
|---|---|
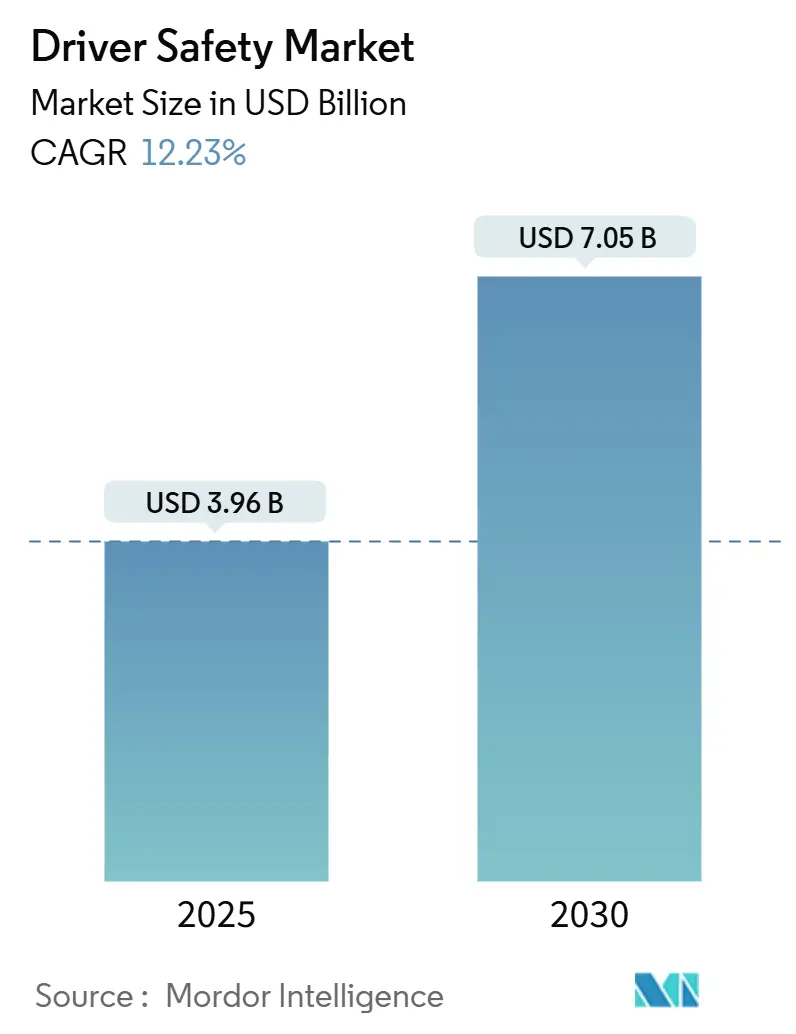
| Market Size (2025) | USD 3.96 Billion |
| Market Size (2030) | USD 7.05 Billion |
| Growth Rate (2025 - 2030) | 12.23% CAGR |
| Fastest Growing Market | Middle East and Africa |
| Largest Market | Asia Pacific |
| Market Concentration | Medium |
Major Players *Disclaimer: Major Players sorted in no particular order Image © Mordor Intelligence. Reuse requires attribution under CC BY 4.0. | |
Driver Safety Market Analysis by Mordor Intelligence
The driver safety market size is valued at USD 3.96 billion in 2025 and is forecasted to reach USD 7.05 billion by 2030 with a 12.23% CAGR during the forecast period (2025-2030). Consistent regulatory pressure, falling sensor prices, and the economics of fleet liability reduction sustain this growth trajectory. Vision-based driver monitoring systems (DMS) have moved from optional add-ons to compliance necessities as Euro NCAP’s 2025 protocol and the United States’ FMVSS No. 127 finalize mandatory requirements[1]“2025 Assessment Protocol – Driver Monitoring,” Euro NCAP, euroncap.com. Commercial operators accelerate uptake because the technology directly lowers insurance premiums, while software-defined vehicles create recurring revenue through over-the-air feature upgrades. Hardware costs keep falling as smartphone-grade imagers migrate to automotive quality, making single-camera interior sensing viable even in budget segments. Meanwhile, privacy frameworks such as GDPR and CCPA force suppliers to embed robust data-handling safeguards without diluting detection accuracy.
Key Report Takeaways
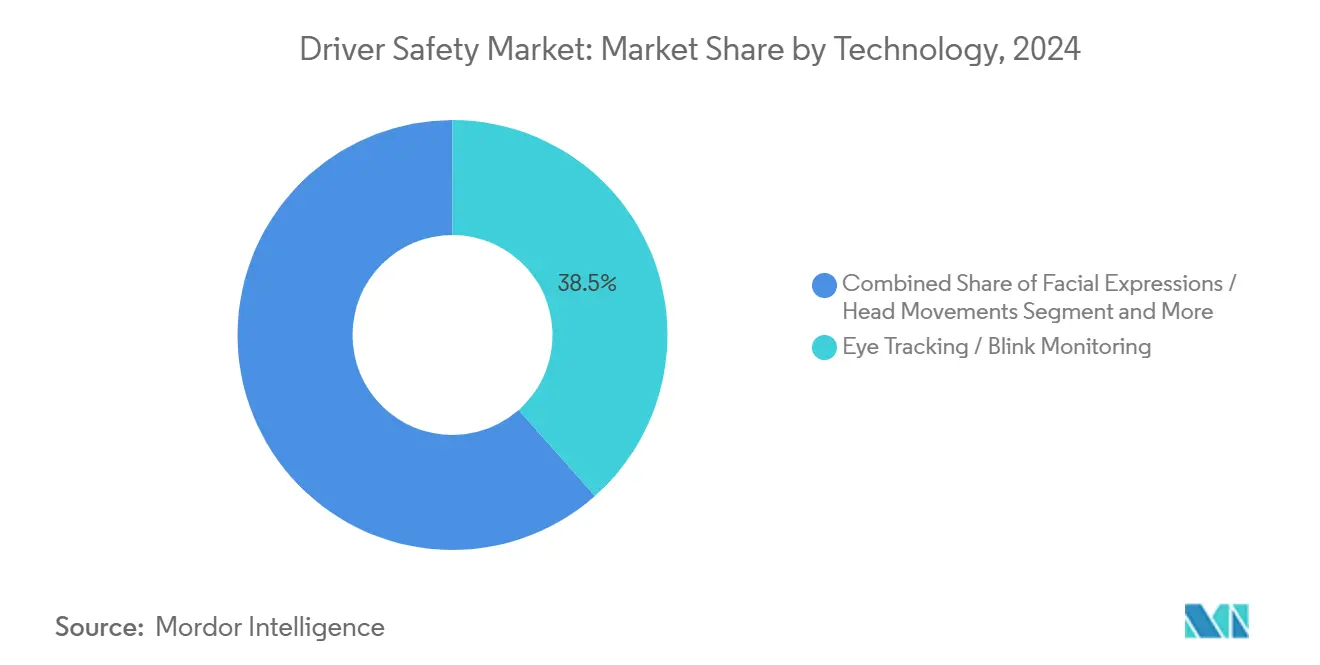
- By technology, eye tracking and blink monitoring captured 38.47% of the driver safety market share in 2024, whereas off-highway vehicle safety systems are projected to grow at a 12.75% CAGR during the forecast period (2025-2030).
- By end use, commercial applications held 46.57% revenue share in 2024; government applications are forecasted to advance at a 13.34% CAGR during the forecast period (2025-2030).
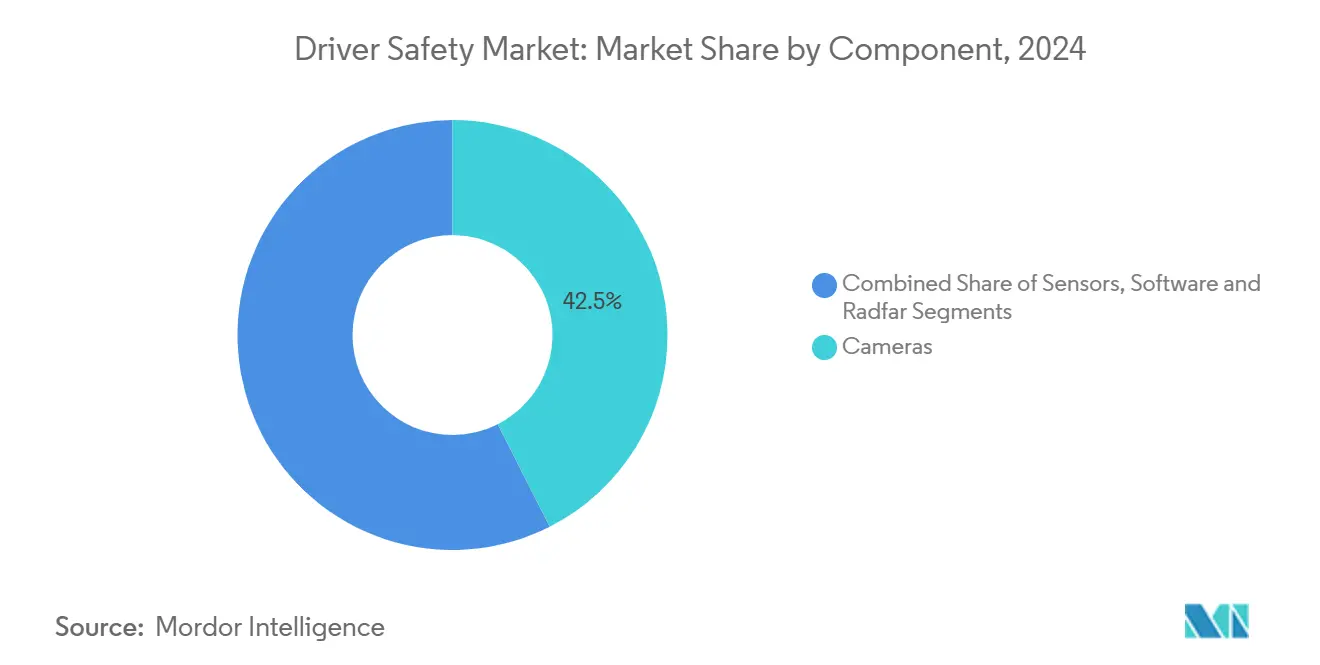
- By component, cameras accounted for a 42.52% share of the driver safety market size in 2024, while software is expected to grow at a 13.83% CAGR during the forecast period (2025-2030).
- By vehicle type, passenger cars represented 54.67% of the driver safety market share in 2024; buses and coaches are projected to grow at a 14.19% CAGR during the forecast period (2025-2030).
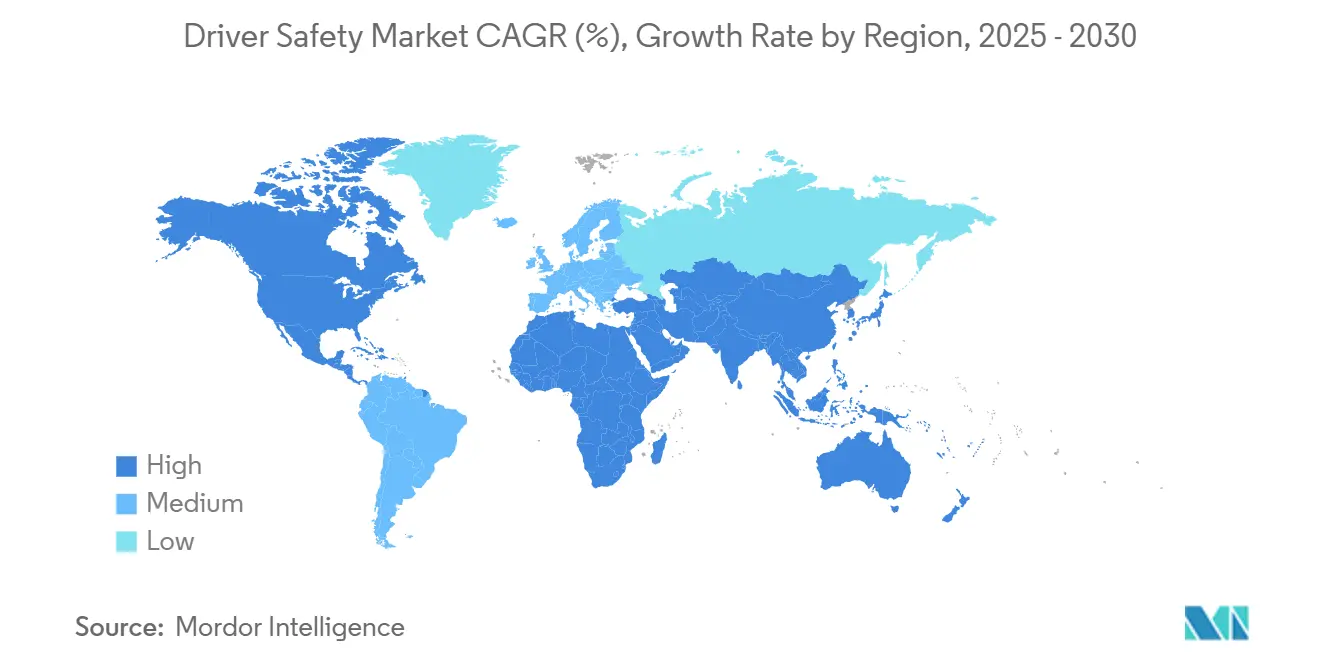
- By geography, Asia-Pacific led with 37.46% of the driver safety market share in 2024, whereas the Middle East and Africa region is expected to record the fastest 12.76% CAGR during the forecast period (2025-2030).
Global Driver Safety Market Trends and Insights
Drivers Impact Analysis*
| Driver | (~) % Impact on CAGR Forecast | Geographic Relevance | Impact Timeline |
|---|---|---|---|
| Vision-Based DMS Mandates | +3.20% | Global, with EU and North America leading | Medium term (2-4 years) |
| ADAS and Autonomous-Level Adoption | +2.80% | Global, concentrated in developed markets | Long term (≥ 4 years) |
| Falling Camera / Sensor ASPs | +1.90% | Global, with Asia-Pacific manufacturing benefits | Short term (≤ 2 years) |
| Usage-Based Insurance Incentives | +1.40% | North America & EU, expanding to APAC | Medium term (2-4 years) |
| Fleet Analytics | +1.10% | Global, commercial fleet focus | Medium term (2-4 years) |
| Combined DMS + OMS | +0.80% | Global, premium segment first | Long term (≥ 4 years) |
| Source: Mordor Intelligence | |||
Regulatory Mandates for Vision-Based DMS
Regulators treat driver attentiveness as a prerequisite for advanced vehicle safety. Euro NCAP’s 5-star rating rules, effective 2025, require vision-based DMS, and the European General Safety Regulation demands drowsiness warnings on new vehicle types from July 2024. In the United States, FMVSS No. 127 mandates automatic emergency braking with pedestrian detection by September 2029, implicitly driving cockpit camera adoption[2]“Final Rule: Automatic Emergency Braking Systems for Light Vehicles,” National Highway Traffic Safety Administration, nhtsa.gov. Because global OEMs share platforms, compliance in one region becomes standard worldwide. Suppliers consequently embed DMS across model ranges rather than confining it to premium trims.
Surge in ADAS and Autonomous Adoption
L2+ and planned L3 implementations demand continuous driver supervision hand-off readiness. Integrating DMS with sensor fusion architectures minimizes incremental compute overhead and enables redundancy. Automakers increasingly specify interior-facing cameras within domain controllers that already handle lane-keeping, adaptive cruise, and automatic braking. As autonomy levels rise, the value of accurate gaze-tracking grows because hands-off driving still requires eyes-on-road confirmation during fallback.
Falling Camera/Sensor ASPs
The cost of automotive cameras and sensors is dropping rapidly, thanks to economies of scale from the smartphone industry and advancements in automotive-specific designs. Companies like OmniVision are leveraging consumer electronics expertise to deliver reliable, cost-effective solutions for vehicles. Emerging players such as Emberion and Obsidian Sensors are pushing prices down further with innovative low-cost technologies, making advanced features like multi-modal driver monitoring more affordable. This trend mirrors the typical automotive electronics lifecycle, where premium applications pave the way for mass-market adoption. Falling near-infrared camera costs now enable single-camera setups for both driver and occupant monitoring, reducing complexity without sacrificing functionality.
Usage-Based Insurance Incentives
Driver monitoring is evolving from a safety feature into a financial advantage through usage-based insurance models. By integrating telematics, insurers can reward safe driving with lower premiums, creating strong incentives for adoption. Companies like Cambridge Mobile Telematics are leading this shift, showing how behavioral data can reduce risk and justify discounts. Fleet operators increasingly view these systems as tools for cutting insurance costs rather than just safety investments, improving the total cost of ownership. Government procurement programs are also mandating driver monitoring, ensuring steady demand and encouraging further innovation in this space.
Restraints Impact Analysis*
| Restraint | (~) % Impact on CAGR Forecast | Geographic Relevance | Impact Timeline |
|---|---|---|---|
| High System Cost | -2.10% | Global, acute in emerging markets | Short term (≤ 2 years) |
| Driver Acceptance Issues | -1.60% | Global, cultural variations in acceptance | Medium term (2-4 years) |
| Supply-Chain Crunch | -1.40% | Global, concentrated in Asia-Pacific manufacturing | Short term (≤ 2 years) |
| Tightening Privacy Rules | -1.20% | EU, North America, expanding globally | Long term (≥ 4 years) |
| Source: Mordor Intelligence | |||
High System Cost for Mass-Market Vehicles
Camera-based driver monitoring systems, despite gradually declining costs, still account for a significant chunk of a small vehicle's production budget. This financial weight curtails their adoption in markets sensitive to costs. Automakers often debut these systems in premium vehicle variants, where profit margins can better accommodate the added expense. Meanwhile, government incentives, like India's proposed safety credits and Brazil's financing programs, alleviate some of the initial financial strain. Suppliers, aiming to strike a balance between affordability and safety, are innovating by developing lower-resolution modules and optimizing computing needs. This approach not only broadens market access but also ensures adherence to functional safety standards.
False Positives and Driver Acceptance Issues
Driver-assistance algorithms must strike a delicate balance between issuing timely alerts and minimizing false positives. Field data indicates that an overabundance of false warnings can prompt drivers to disable these systems, thereby diminishing their intended effectiveness. Cultural nuances play a pivotal role in shaping alert designs: for instance, while regions like Japan show a preference for audible cues, United States fleets lean towards tactile feedback, such as seat vibrations. In response to these regional differences, suppliers are training AI models on localized datasets and setting adaptive thresholds that evolve based on individual driver behavior. Yet, despite these strides, lingering liability concerns persist, especially when drivers opt to disengage from systems after repeatedly ignoring prompts.
*Our forecasts treat driver/restraint impacts as directional, not additive. The impact forecasts reflect baseline growth, mix effects, and variable interactions.
Segment Analysis
By Technology: Vision-Based Solutions Drive Market Evolution
Vision-based eye-tracking and blink-monitoring claimed 38.47% of the driver safety market share in 2024, underlining regulatory trust in non-contact cameras. Their leadership is reinforced by Euro NCAP certification pathways that explicitly validate gaze classifiers. Sensor fusion combining facial-landmark analysis with steering-wheel angle refines drowsiness detection and brings false positives below the 1.5% fleet threshold. Off-highway vehicle safety systems, though representing a smaller revenue base, are poised to grow at a 12.75% CAGR as mines and construction sites mandate fatigue alerts to minimize costly downtime incidents.
Competition among imaging pipelines favors near-infrared illumination over intrusive wearables, preserving cabin lighting aesthetics while operating day and night. Parallel R&D in machine vision for occupant monitoring creates economies of scope; a single imager now handles seat-belt checks, child-presence detection, and driver attentiveness. Hardware abstraction layers allow over-the-air recalibration, paving a subscription path where OEMs unlock premium analytics post-sale. The driver safety market thus shifts from one-off hardware transactions to recurring data services, broadening revenue per vehicle.


By End Use: Commercial Applications Lead Market Adoption
Commercial operators controlled 46.57% of the driver safety market's 2024 revenue because liability and fuel-efficiency savings tied directly to the bottom lines. Trucking fleets deploy cabin cameras paired with cloud scoring dashboards, achieving insurance discounts that repay hardware outlays in under 18 months. Government use, while smaller today, is on track for a 13.34% CAGR to 2030 as public-sector tenders bundle DMS with body cameras and telematics, creating integrated safety ecosystems.
Private-use penetration accelerates as regulatory mandates eliminate consumer opt-outs. Base trims in Europe already ship with standard driver monitoring to secure 5-star NCAP ratings, and U.S. automakers align similarly to satisfy federal safety credits. Fleet roll-outs provide invaluable field data that fine-tunes algorithms before mass-market dissemination. As unit economics improve, aftermarket retrofits join OEM fitment, especially for independent owner-operators seeking compliance without buying new vehicles.
By Component: Cameras Enable System Integration
Cameras generated 42.52% of the component revenue of the driver safety system market size in 2024, cementing them as the anchor of driver-state analytics. Image sensors integrate global-shutter pixel architectures, eliminating motion blur during rapid head turns. Software is poised for a 13.83% CAGR across 2025–2030, reflecting OEM moves toward software-defined vehicles that monetize updates and personalized interventions. The shift transforms the driver safety industry from hardware-centric to code-centric, with margins migrating up the stack.
Radar retains niche adoption in harsh weather or off-highway applications where dust and glare degrade optics. Yet most manufacturers increasingly favor multi-spectral cameras combining RGB and near-infrared layers to simplify the bill of materials. Edge AI accelerators built into domain controllers run gaze-classification neural networks within a 3-Watt power budget, meeting stringent automotive thermal envelopes. Over-the-air pipelines push quarterly inference-engine enhancements, compounding performance post-sale and reinforcing customer lock-in.
By Vehicle Type: Passenger Cars Anchor Market Volume
Passenger cars captured 54.67% of the driver safety market share in 2024 and will continue to underpin volume-driven cost reduction. Compact SUVs in China and Europe integrate interior cameras as part of broader ADAS suites, aligning with young consumers’ tech expectations. In parallel, buses and coaches exhibit a 14.19% CAGR to 2030 because public transit agencies face accountability for high-occupancy safety. High-placement windshields and driver seating positions make camera mounting straightforward, boosting retrofit feasibility.
Light commercial vehicles leverage passenger-car component commonality, while medium and heavy trucks demand vibration-tolerant housings and wider field-of-view optics. Suppliers, therefore, adopt modular lens barrels that swap easily between segments. Cross-segment economies of scale push driver safety market size efficiencies: volume car production pays for ASIC R&D, while ruggedized variants capture higher margins in trucking and mining.
Geography Analysis
Asia-Pacific commanded 37.46% of global revenue in 2024, propelled by China’s autonomous-testing approvals and Japan’s early adoption within kei car platforms. Supply-chain proximity lowers sensor costs, and robust domestic semiconductor ecosystems shield OEMs from geopolitical disruptions. Government subsidies under China’s Intelligent & Connected Vehicle roadmap make DMS part of broader smart-mobility projects, keeping the region on an 11.54% CAGR trajectory to 2030.
North America maintains momentum with an 11.19% CAGR, thanks to the Federal Motor Carrier Safety Administration’s pilot programs and state-level insurance rebates. Upcoming FMVSS pedestrian-braking mandates indirectly boost cockpit camera fitment by making driver attentiveness data a logical adjunct to forward-collision sensors. Privacy statutes such as California’s CCPA demand explicit consent dialogs, but OEMs are embedding secure enclaves that store biometric hashes locally, satisfying compliance without degrading user experience.
While smaller today, the Middle East and Africa are forecasted to post the strongest 12.76% CAGR through 2030. Governments in the Gulf Cooperation Council are modernizing public fleets under Vision 2030 initiatives, specifying advanced safety kits that include driver monitoring. Extreme heat requires components rated to 105 °C ambient, fostering demand for ruggedized optics. Mining transport in South Africa and iron-ore haulage in Mauritania further extend off-road use cases for fatigue detection.

Competitive Landscape
The driver safety market exhibits moderate fragmentation, indicating significant consolidation opportunities as regulatory compliance requirements favor suppliers with global scale and technical depth. Continental AG leverages vertically integrated camera modules and perception software. Robert Bosch GmbH capitalizes on bundling DMS within its established ADAS stack. Mid-tier players such as Denso and ZF compete on modularity, while software specialists license gaze-tracking algorithms to tier-1 hardware vendors.
Competitive differentiation is migrating from sensor count to AI accuracy. Continental’s spin-off of its cockpit electronics arm lets the new entity focus on GPU-rich domain controllers optimized for neural-network inference. Smaller suppliers either partner for silicon access or pivot to specialized niches like alcohol-impairment detection. Intellectual-property portfolios around eyelid-closure detection and driver gesture libraries become strategic bargaining chips in joint ventures with Asian automakers.
Regulatory certification cycles require multi-year data sets, favoring incumbents with fleet-scale deployments. Yet open-source machine-learning frameworks lower entry barriers, enabling startups to prototype quickly. M&A activity is therefore expected as OEMs seek end-to-end solutions covering occupant monitoring, driver identification, and personalization. Over the forecast horizon, suppliers able to package hardware, firmware, and data-analytics services in a single contract stand to capture incremental margin.
Driver Safety Industry Leaders
Continental AG
Robert Bosch GmbH
Denso Corporation
Seeing Machines
Smart Eye AB
- *Disclaimer: Major Players sorted in no particular order

Recent Industry Developments
- September 2025: Netradyne launched its Driver•i platform in Japan, extending its AI-enabled fleet safety analytics globally.
- July 2025: Pioneer India unveiled a 360° surround-view camera kit that enhances driver situational awareness in dense traffic.
- June 2025: Hyundai Mobis introduced rear safety control that automatically maintains safe distance when trailing vehicles approach.
- June 2025: Smart Eye upgraded its AIS system with real-time alcohol-intoxication detection delivered over-the-air, helping automakers meet emerging mandates.


Global Driver Safety Market Report Scope
| Eye Tracking / Blink Monitoring |
| Facial Expressions / Head Movements |
| Heart-Rate Monitoring |
| Pressure / Angle Steering Sensor |
| Lane Departure Warning |
| Off-Highway Vehicle Safety Systems |
| Private Use |
| Commercial Use |
| Government Use |
| Cameras |
| Sensors |
| Software |
| Radar |
| Passenger Cars |
| Light Commercial Vehicles (LCVs) |
| Medium and Heavy Commercial Vehicles (MHCVs) |
| Buses and Coaches |
| North America | United States |
| Canada | |
| Rest of North America | |
| South America | Brazil |
| Argentina | |
| Rest of South America | |
| Europe | United Kingdom |
| Germany | |
| Spain | |
| Italy | |
| France | |
| Russia | |
| Rest of Europe | |
| Asia-Pacific | India |
| China | |
| Japan | |
| South Korea | |
| Rest of Asia-Pacific | |
| Middle East and Africa | United Arab Emirates |
| Saudi Arabia | |
| Turkey | |
| Egypt | |
| South Africa | |
| Rest of Middle-East and Africa |
| By Technology | Eye Tracking / Blink Monitoring | |
| Facial Expressions / Head Movements | ||
| Heart-Rate Monitoring | ||
| Pressure / Angle Steering Sensor | ||
| Lane Departure Warning | ||
| Off-Highway Vehicle Safety Systems | ||
| By End Use | Private Use | |
| Commercial Use | ||
| Government Use | ||
| By Component | Cameras | |
| Sensors | ||
| Software | ||
| Radar | ||
| By Vehicle Type | Passenger Cars | |
| Light Commercial Vehicles (LCVs) | ||
| Medium and Heavy Commercial Vehicles (MHCVs) | ||
| Buses and Coaches | ||
| By Region | North America | United States |
| Canada | ||
| Rest of North America | ||
| South America | Brazil | |
| Argentina | ||
| Rest of South America | ||
| Europe | United Kingdom | |
| Germany | ||
| Spain | ||
| Italy | ||
| France | ||
| Russia | ||
| Rest of Europe | ||
| Asia-Pacific | India | |
| China | ||
| Japan | ||
| South Korea | ||
| Rest of Asia-Pacific | ||
| Middle East and Africa | United Arab Emirates | |
| Saudi Arabia | ||
| Turkey | ||
| Egypt | ||
| South Africa | ||
| Rest of Middle-East and Africa | ||


Key Questions Answered in the Report
How big is the driver safety market in 2025?
The driver safety market size reached USD 3.96 billion in 2025 and is projected to climb to USD 7.05 billion by 2030.
What CAGR is expected for driver monitoring systems through 2030?
Aggregate revenue is forecasted to register a 12.23% CAGR between 2025 and 2030 under current regulatory and cost-reduction trends.
Which technology leads current adoption?
Eye-tracking and blink-monitoring systems hold the largest 38.47% share because they meet Euro NCAP’s vision-based compliance criteria.
Which region shows the fastest growth?
The Middle East and Africa region is projected to be the fastest, expanding at a 12.76% CAGR as government fleets modernize.
Why are commercial fleets early adopters?
Fleet operators realize quick insurance savings, turning driver monitoring from a cost center into a profit lever that improves claim ratios.
Page last updated on:


