Direct Carrier Billing Market Size and Share
Market Overview
| Study Period | 2020 - 2031 |
|---|---|
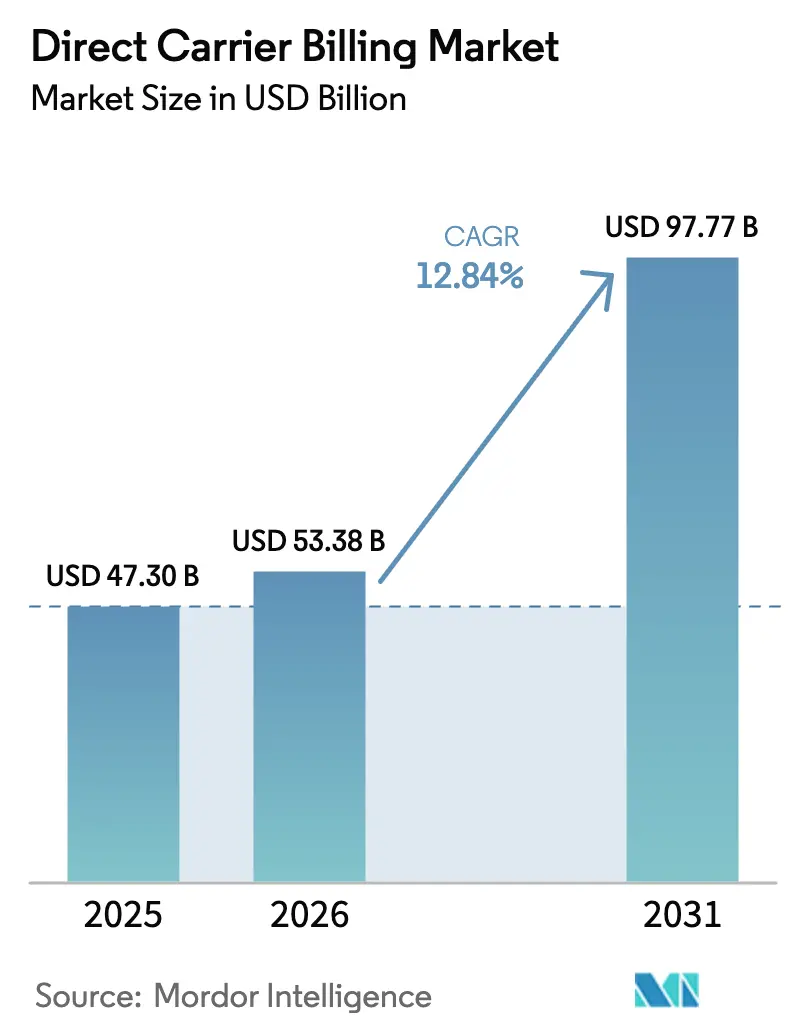
| Market Size (2026) | USD 53.38 Billion |
| Market Size (2031) | USD 97.77 Billion |
| Growth Rate (2026 - 2031) | 12.84% CAGR |
| Fastest Growing Market | Asia Pacific |
| Largest Market | North America |
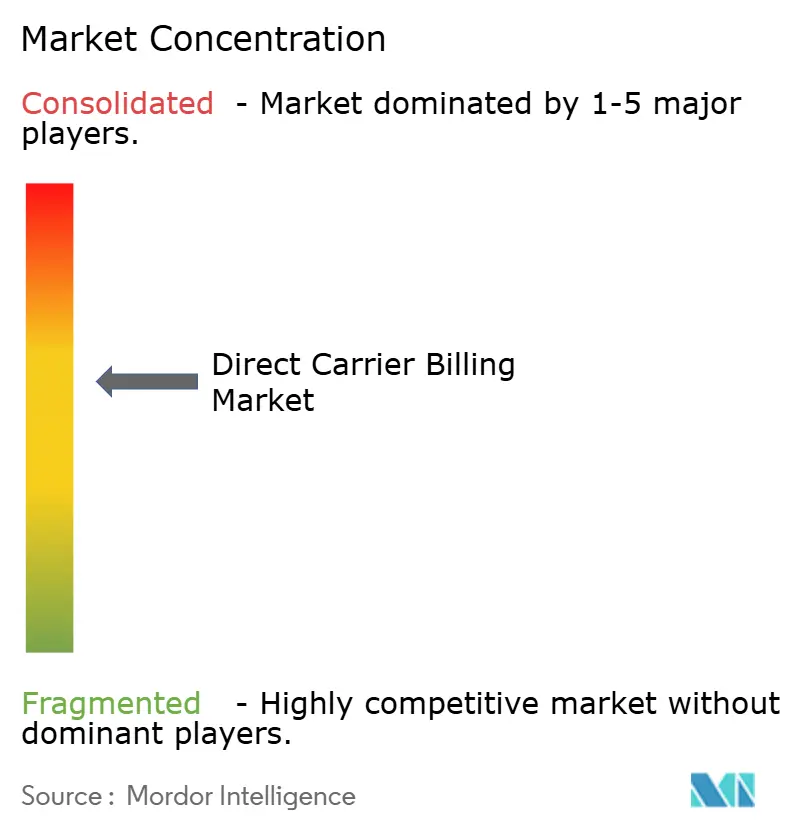
| Market Concentration | Medium |
Major Players *Disclaimer: Major Players sorted in no particular order Image © Mordor Intelligence. Reuse requires attribution under CC BY 4.0. | |
Direct Carrier Billing Market Analysis by Mordor Intelligence
The direct carrier billing market size in 2026 is estimated at USD 53.38 billion, growing from 2025 value of USD 47.3 billion with 2031 projections showing USD 97.77 billion, growing at 12.84% CAGR over 2026-2031. Smartphone ubiquity, regulatory encouragement of alternative payments, and rapid growth in digital content-especially gaming and cloud software-are combining to keep the direct carrier billing market on a steep upward curve. Operators, fintechs, and content publishers are intensifying partnerships to monetize micro-transactions, improve checkout conversion, and reach unbanked users. Meanwhile, platform diversification toward connected TVs and enterprise IoT is widening the addressable base for the direct carrier billing market. Heightened focus on fraud mitigation APIs and modular billing interfaces is reinforcing investor confidence in the direct carrier billing market’s scalability.
Key Report Takeaways
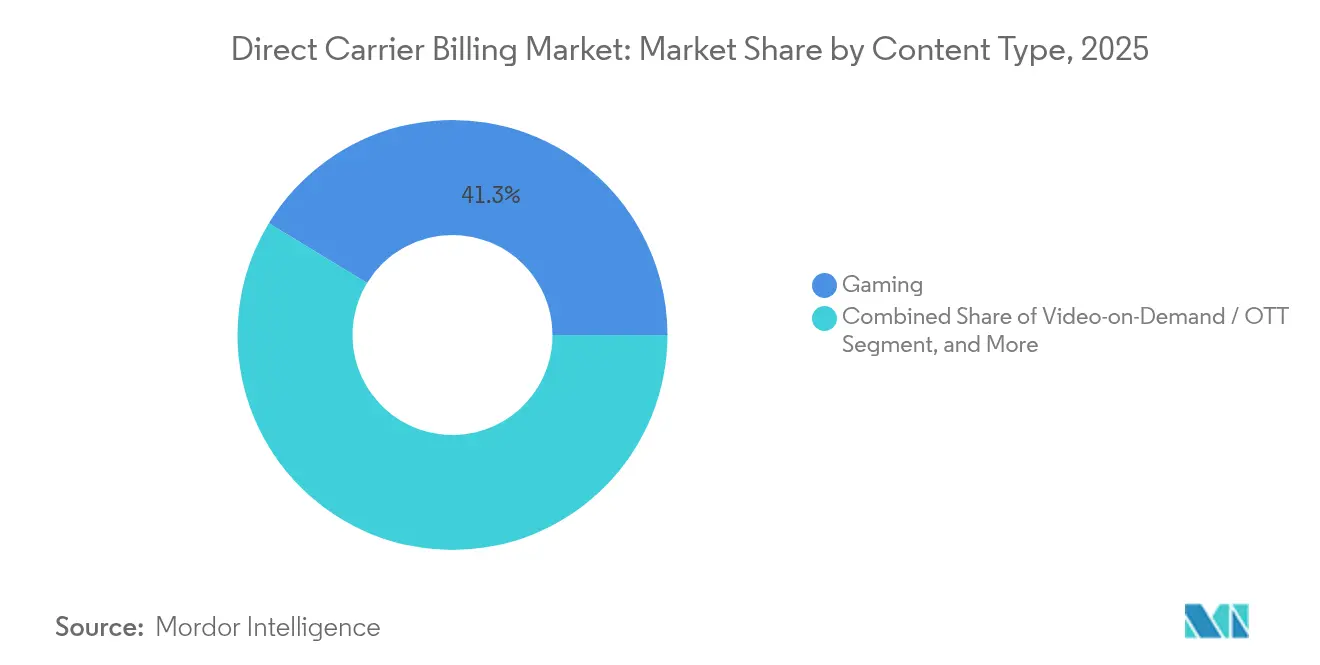
- By content type, gaming led with 41.30% revenue share in 2025; cloud & utility software is forecast to expand at a 15.45% CAGR to 2031.
- By device platform, Android smartphones captured 71.20% of the direct carrier billing market share in 2025, while connected TVs are advancing at a 14.25% CAGR through 2031.
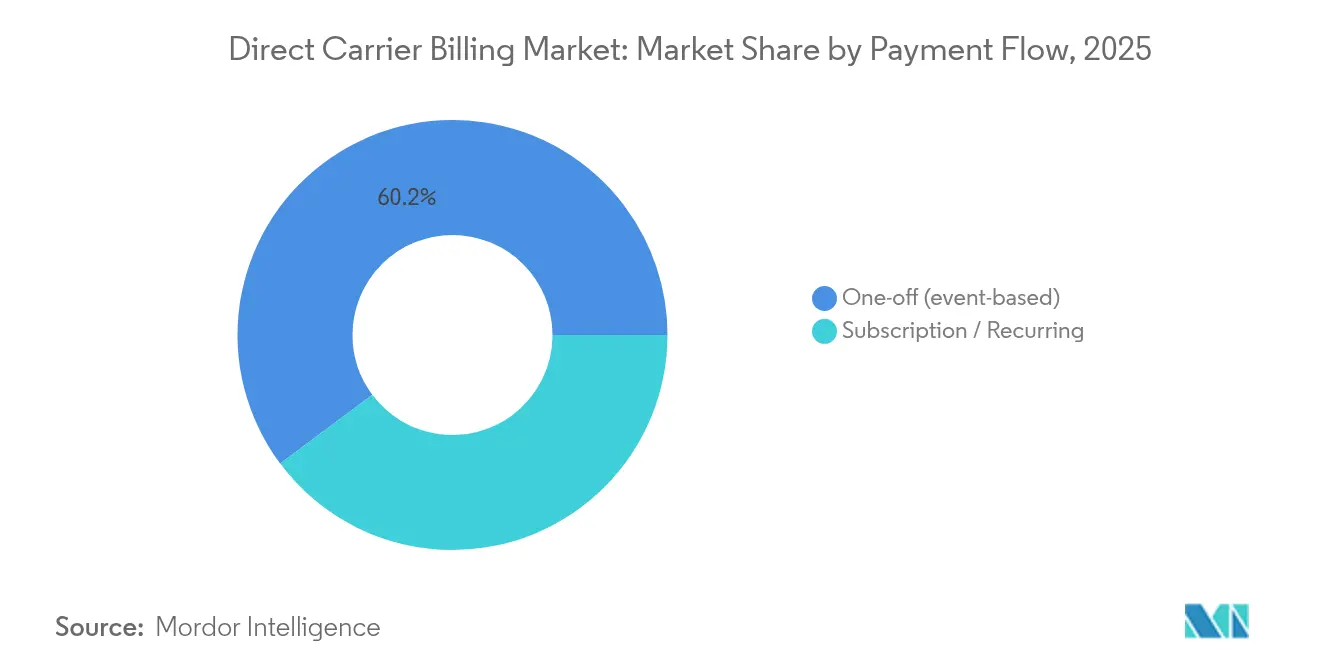
- By payment flow, one-off transactions accounted for 60.20% share of the direct carrier billing market size in 2025; subscriptions are growing at a 14.96% CAGR to 2031.
- By operator type, mobile network operators held 82.30% share in 2025, whereas MVNOs are forecast to post a 15.28% CAGR by 2031.
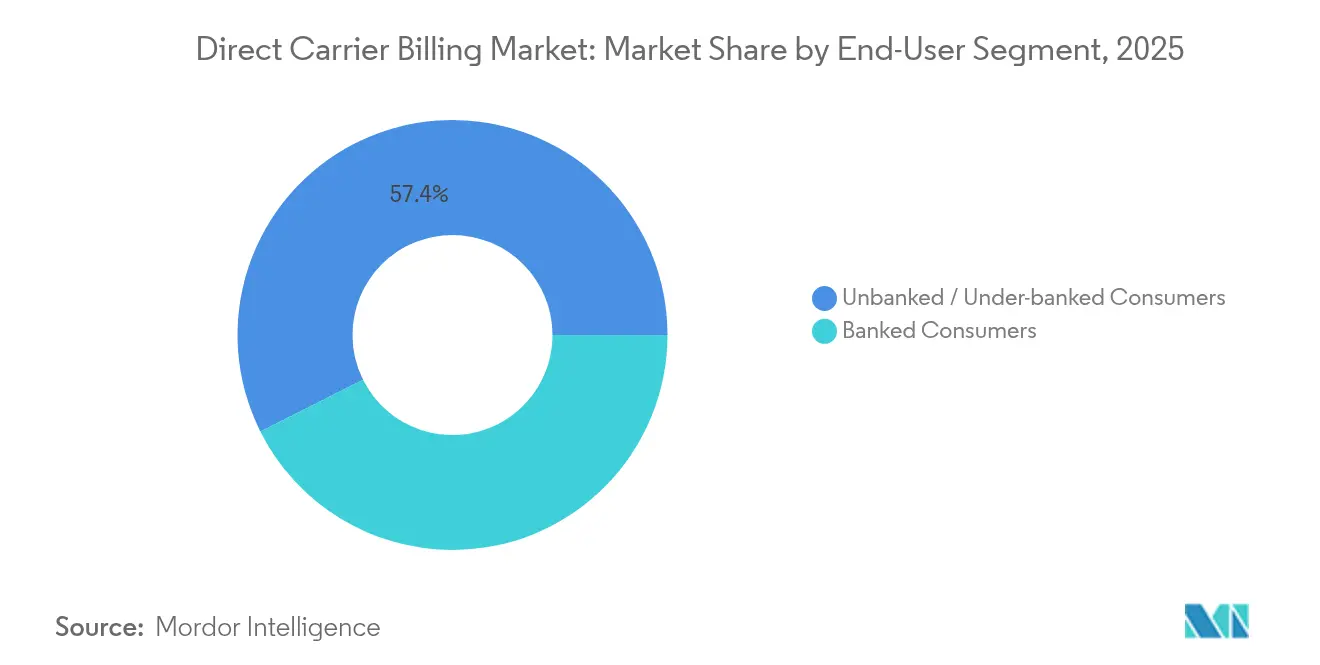
- By end-user segment, unbanked consumers represented 57.40% usage in 2025 and are expanding at a 15.12% CAGR through 2031.
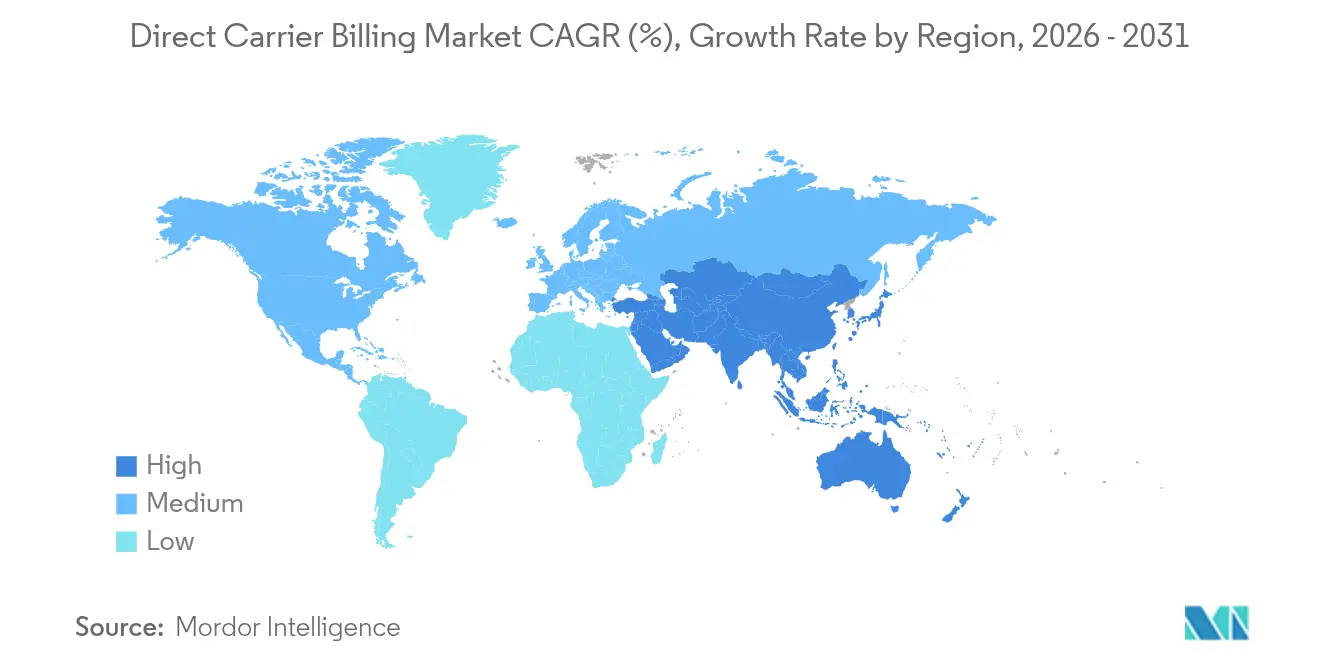
- By geography, North America led with 33.90% share in 2025 and Asia-Pacific is the fastest-growing region with 15.95% CAGR to 2031.
Note: Market size and forecast figures in this report are generated using Mordor Intelligence’s proprietary estimation framework, updated with the latest available data and insights as of 2026.
Global Direct Carrier Billing Market Trends and Insights
Drivers Impact Analysis*
| Driver | (~) % Impact on CAGR Forecast | Geographic Relevance | Impact Timeline |
|---|---|---|---|
| Rising smartphone & mobile-data penetration | +2.80% | APAC, Africa, global spill-over | Medium term (2-4 years) |
| Explosive demand for digital gaming & entertainment | +3.20% | North America, Europe, global platforms | Short term (≤ 2 years) |
| Convenience for unbanked & under-banked consumers | +2.10% | APAC, Latin America, Africa | Long term (≥ 4 years) |
| Superior checkout conversion for micro-transactions | +1.90% | Global, weighted to developed markets | Short term (≤ 2 years) |
| EU and other regulations lowering app-store barriers | +1.40% | Europe with global follow-on | Medium term (2-4 years) |
| Telco-edge bundling unlocking new B2B pools | +1.10% | North America, Europe | Long term (≥ 4 years) |
| Source: Mordor Intelligence | |||
Rising Smartphone & Mobile-Data Penetration
Affordable 5G devices and aggressive data-bundle pricing continue to extend mobile internet access, especially in India, Indonesia, and Nigeria, creating fertile ground for the direct carrier billing market [1]Staff Writers, “Aduna, AT&T, T-Mobile, Verizon deliver on US 5G network APIs,” Ericsson, ericsson.com. Malaysian operator Digital Nasional Berhad’s enterprise-grade 5G rollout with carrier-integrated billing APIs illustrates how network upgrades are hard-wiring DCB into both consumer and enterprise channels [2]Staff Writers, “DNB Malaysia partners with Ericsson for 5G workspace,” Ericsson, ericsson.com. With mobile now the first—and often only—digital touchpoint for millions, carrier billing gains a structural advantage over card-based methods that depend on formal banking rails.
Explosive Demand for Digital Gaming & Entertainment
Global publishers viewed DCB revenue from gaming titles as a top-five monetization lever in 2024, a stance reinforced by Boku’s report showing disproportionately high attach rates in free-to-play ecosystems [3]Research Team, “2024 Global Ecommerce Report,” Boku, boku.com. Streaming platforms mirror this pattern by bundling data and subscription payments into a single mobile invoice, driving down churn in North America and Europe. The result is sustained top-line lift for content owners and incremental average revenue per user (ARPU) for carriers—dynamics that keep the direct carrier billing market in an expansionary phase.
Convenience for Unbanked & Under-banked Consumers
Roughly 1.2 billion adults remain outside formal banking, yet most maintain prepaid mobile accounts. Recent deployments in Bangladesh and Pakistan allow users to buy cloud storage, productivity apps, or learning modules by adding charges to airtime—demonstrating how the direct carrier billing market supports social inclusion goals while unlocking new revenue for operators [4]Editorial Team, “Telefónica Open Gateway,” Telefónica, telefonica.com.
Superior Checkout Conversion for Micro-transactions
Platform data from leading DCB aggregators show that single-click carrier billing consistently converts impulse buys at more than twice the rate of card-based flows for tickets under USD 10. Operators in the United States are preparing to expose Number Verification and SIM-Swap APIs to merchants, enabling one-tap pathways that further widen this conversion gap.
Restraints Impact Analysis*
| Restraint | % Impact on CAGR Forecast | Geographic Relevance | Impact Timeline |
|---|---|---|---|
| High revenue-share costs for content providers | -1.8% | Global, with highest impact in competitive markets | Short term (≤ 2 years) |
| Fraud, refund & charge-back exposure | -1.2% | Global, concentrated in emerging markets | Medium term (2-4 years) |
| Telco consolidation squeezing DCB aggregator margins | -0.9% | North America and Europe, spillover to APAC | Medium term (2-4 years) |
| Rise of super-app wallets diverting payment traffic | -1.1% | APAC and Latin America, expanding globally | Long term (≥ 4 years) |
| Source: Mordor Intelligence | |||
High Revenue-Share Costs for Content Owners
Standard splits of 30–50% between carriers, aggregators, and publishers compress margins for subscription video or productivity-suite providers. Telefónica’s Open Gateway initiative signals a transition toward API-based models that compress fee layers and could improve unit economics for merchants [5]Editorial Team, “Telefónica Open Gateway,” Telefónica, telefonica.com.
Fraud, Refund & Charge-back Exposure
SIM-swap and account-takeover incidents are growing alongside transaction volumes, prompting technology vendors such as Neural Technologies to launch AI-based anomaly detection offering real-time blocks on suspect traffic [6]Editorial Team, “Mobile money payment fraud on the rise,” Neural Technologies, neuralt.com. A tighter security posture is vital for sustaining trust and protecting the direct carrier billing market’s growth trajectory.
*Our forecasts treat driver/restraint impacts as directional, not additive. The impact forecasts reflect baseline growth, mix effects, and variable interactions.
Segment Analysis
By Content Type: Gaming Dominance Drives Cloud Transformation
Gaming accounted for 41.30% of 2025 revenue, cementing its role as volume anchor for the direct carrier billing market. One-tap payments for skins, power-ups, and season passes align perfectly with DCB’s micro-ticket strengths, keeping purchase friction low and frequency high. Cloud & utility software, while smaller today, is expanding at a 15.45% CAGR, adding meaningful incremental value to the direct carrier billing market size as workplace SaaS and security suites embrace mobile-first billing.
Video-on-demand follows as the second-largest vertical, where seamless renewal via carrier invoice curbs churn for global streamers. Music and audio services are using localized carrier promotions to penetrate mobile-only demographics. Ticketing and transit operators integrate DCB into QR-based fare systems, widening day-to-day payment relevance. Collectively, these adjacencies diversify revenue and soften dependency on gaming cycles, enhancing resilience within the direct carrier billing market.


By Device Platform: Android Leadership Meets Connected-TV Innovation
Android smartphones held a commanding 71.20% share in 2025, reflecting the OS’s prevalence in emerging markets and Google’s late-2024 liberalization of billing rules. The direct carrier billing market size within Android ecosystems is set to expand further as more app categories unlock external billing choices.
Connected TVs form the fastest-rising platform, tracking a 14.25% CAGR through 2031 as smart-screen penetration spreads in Latin America and Southeast Asia. Carrier-level settlement on a living-room device moves DCB beyond the handset and into home entertainment hubs, reinforcing omnichannel reach for the direct carrier billing industry.
By Payment Flow: Subscription Growth Transforms One-Off Dominance
One-off purchases still contributed 60.20% of value in 2025, but recurring plans are accelerating at 14.96% CAGR. Enterprise SaaS firms such as those profiled by Ratio Tech are embedding carrier-based renewal to capture emerging-market users lacking cards, thereby lifting the direct carrier billing market share of subscriptions .
This structural pivot necessitates richer billing logic-proration, plan swaps, and dunning workflows-yet operators view the predictable revenue stream as an incentive to upgrade backend systems. The evolution underlines DCB’s maturation from impulse engine to subscription backbone.
By Operator Type: MVNO Agility Challenges MNO Scale
Traditional MNOs processed 82.30% of the 2025 transaction value thanks to established subscriber bases and regulatory capital. Even so, MVNOs are compounding at 15.28% because their lighter operating model allows rapid rollout of promotional pricing and niche service bundles that lean on DCB for settlement.
Regulators in markets from Canada to Singapore are easing wholesale access terms, further lowering MVNO entry barriers. Competitive intensity is expected to stimulate service innovation and could narrow fee spreads, a net positive for users and content partners active in the direct carrier billing market.
By End-User Segment: Unbanked Consumers Drive Inclusive Growth
Unbanked users made up 57.40% of all carrier-billed transactions in 2025, and their 15.12% CAGR underscores DCB’s status as a financial-inclusion catalyst. Younger cohorts in India, the Philippines, and sub-Saharan Africa are skipping cards altogether, relying on airtime or post-paid invoices for digital spending.
Banked segments rely on DCB mainly for privacy and speed benefits, especially in gaming and live-stream tipping. Merchants therefore see a bifurcated opportunity: scale via unbanked volumes while upselling premium content to banked users, all within the same direct carrier billing market framework.
Geography Analysis
North America led with a 33.90% share in 2025 as carriers and aggregators capitalized on high ARPU bases and liberalized API frameworks. The upcoming launch of standardized 5G network APIs by AT&T, T-Mobile, and Verizon promises stronger security and richer metadata, advantages likely to sustain regional weight in the direct carrier billing market.
Asia-Pacific is the fastest-growing region, propelled by financial-inclusion programs and near-ubiquitous mobile data coverage. Digital wallets have become mainstream for 70% of online purchases, yet DCB remains the default for micro-transactions among the unbanked, reinforcing dual adoption paths and boosting the direct carrier billing market size across India, Indonesia, and Vietnam .
Europe’s trajectory is steady rather than spectacular, but policy-driven openness is broadening use cases-from gig-economy payouts to connected-car infotainment subscriptions-keeping the direct carrier billing market relevant despite card saturation. Latin America and Africa are emerging hotspots where carrier billing complements QR and wallet schemes, offering global merchants a turnkey route into high-growth, low-card environments.

Competitive Landscape
The direct carrier billing market features mid-level concentration, with Boku, Bango, and DIMOCO servicing global operators while regional specialists carve out local niches. Boku posted 24% revenue growth in H1 2024, buoyed by wallet integrations that extend its reach beyond pure carrier billing. Bango capitalized on its reseller-hub strategy, onboarding OTT brands to multi-country carrier links in late 2024.
Technology investments focus on API standardization, AI fraud scrubbing, and cloud-native scaling. Ericsson’s Aduna venture, launched in 2025, exemplifies this push by exposing telco network functions—including billing triggers—directly to developers, threatening to bypass legacy aggregators. MVNOs are also entering the platform space, white-labeling billing engines for niche OTT services.
Consolidation pressures persist: cash-rich operators are scouting aggregator takeovers to lock in volumes, while fintechs see cross-border DCB corridors as a hedge against interchange-fee caps. The result is a dynamic yet disciplined ecosystem where technology differentiation and regulatory agility define success.
Direct Carrier Billing Industry Leaders
Boku Inc.
Bango plc
DIMOCO Payments GmbH
Digital Virgo SA
Fortumo OÜ (an ROKU company)
- *Disclaimer: Major Players sorted in no particular order

Recent Industry Developments
- March 2025: Ericsson’s Aduna platform partnered with Bridge Alliance to accelerate CAMARA-based network API adoption across Asia-Pacific telecommunications operators.
- February 2025: AT&T, T-Mobile, and Verizon announced collaboration through Aduna to deliver the first standardized 5G network APIs in the United States, including Number Verification and SIM Swap APIs that will enhance DCB fraud prevention and enable seamless cross-carrier billing integration.
- February 2025: ModernTV Group partnered with Solidgate to integrate Apple Pay and Google Pay alongside DCB options for IPTV services.
- January 2025: dLocal acquired a UK payment-institution license from the Financial Conduct Authority, enabling the company to expand cross-border DCB capabilities for emerging-market merchants.


Global Direct Carrier Billing Market Report Scope
| Gaming |
| Video-on-Demand / OTT |
| Music and Audio Streaming |
| ePublishing (e-books, comics, news) |
| Ticketing and Transit |
| Cloud & Utility Software |
| Android Smartphones |
| iOS /iPadOS Devices |
| Feature-phones |
| Connected TVs & Game Consoles |
| One-off (event-based) |
| Subscription / Recurring |
| Mobile Network Operators (MNOs) |
| Mobile Virtual Network Operators (MVNOs) |
| Banked Consumers |
| Unbanked / Under-banked Consumers |
| North America | United States |
| Canada | |
| Mexico | |
| South America | Brazil |
| Argentina | |
| Chile | |
| Rest of South America | |
| Europe | Germany |
| United Kingdom | |
| France | |
| Italy | |
| Spain | |
| Russia | |
| Rest of Europe | |
| Asia Pacific | China |
| India | |
| Japan | |
| South Korea | |
| Australia | |
| Indonesia | |
| Rest of Asia Pacific | |
| Middle East | Turkey |
| Saudi Arabia | |
| United Arab Emirates | |
| Israel | |
| Qatar | |
| Rest of Middle East | |
| Africa | South Africa |
| Nigeria | |
| Egypt | |
| Kenya | |
| Morocco | |
| Rest of Africa |
| By Content Type | Gaming | |
| Video-on-Demand / OTT | ||
| Music and Audio Streaming | ||
| ePublishing (e-books, comics, news) | ||
| Ticketing and Transit | ||
| Cloud & Utility Software | ||
| By Device Platform | Android Smartphones | |
| iOS /iPadOS Devices | ||
| Feature-phones | ||
| Connected TVs & Game Consoles | ||
| By Payment Flow | One-off (event-based) | |
| Subscription / Recurring | ||
| By Operator Type | Mobile Network Operators (MNOs) | |
| Mobile Virtual Network Operators (MVNOs) | ||
| By End-User Segment | Banked Consumers | |
| Unbanked / Under-banked Consumers | ||
| By Geography | North America | United States |
| Canada | ||
| Mexico | ||
| South America | Brazil | |
| Argentina | ||
| Chile | ||
| Rest of South America | ||
| Europe | Germany | |
| United Kingdom | ||
| France | ||
| Italy | ||
| Spain | ||
| Russia | ||
| Rest of Europe | ||
| Asia Pacific | China | |
| India | ||
| Japan | ||
| South Korea | ||
| Australia | ||
| Indonesia | ||
| Rest of Asia Pacific | ||
| Middle East | Turkey | |
| Saudi Arabia | ||
| United Arab Emirates | ||
| Israel | ||
| Qatar | ||
| Rest of Middle East | ||
| Africa | South Africa | |
| Nigeria | ||
| Egypt | ||
| Kenya | ||
| Morocco | ||
| Rest of Africa | ||


Key Questions Answered in the Report
What is driving the rapid growth of the direct carrier billing market?
Surging smartphone usage, regulatory mandates for alternative payments, and high conversion rates for micro-transactions collectively fuel a 12.84% CAGR through 2031.
How large will the direct carrier billing market be by 2031?
Estimates indicate the direct carrier billing market size will reach about USD 97.77 billion by 2031.
Which content segment generates the most carrier-billed revenue?
Gaming leads, accounting for 41.30% of 2025 spend, thanks to micro-payments for in-game items and passes.
Why are MVNOs gaining share in direct carrier billing?
Their lean cost structures and niche targeting support a projected 15.28% CAGR, outpacing traditional MNOs.
How does direct carrier billing support financial inclusion?
It enables unbanked users—57.40% of 2025 transactions—to buy digital services by charging purchases to mobile airtime or post-paid bills without needing cards or bank accounts.
What are the main risks limiting wider adoption of carrier billing?
High revenue-share fees and rising fraud incidents pose the biggest near-term challenges, trimming the CAGR by an estimated 3% in aggregate.
Page last updated on:


