Carrier Aggregation Solutions Market Size and Share
Market Overview
| Study Period | 2019 - 2030 |
|---|---|
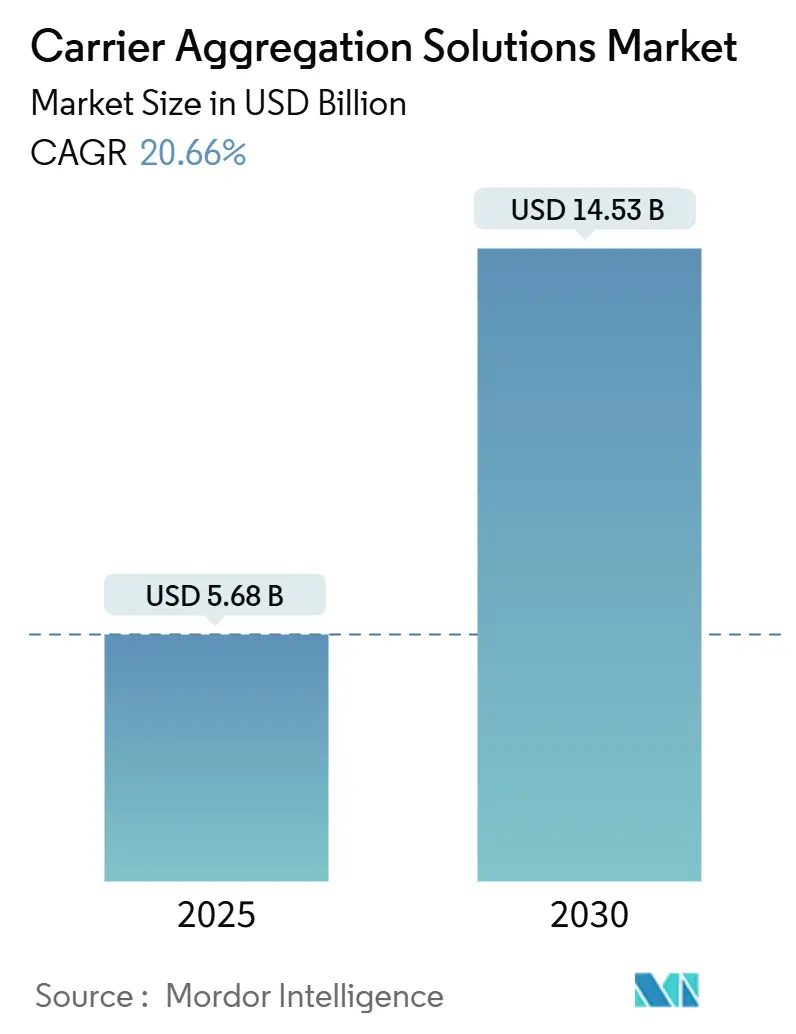
| Market Size (2025) | USD 5.68 Billion |
| Market Size (2030) | USD 14.53 Billion |
| Growth Rate (2025 - 2030) | 20.66% CAGR |
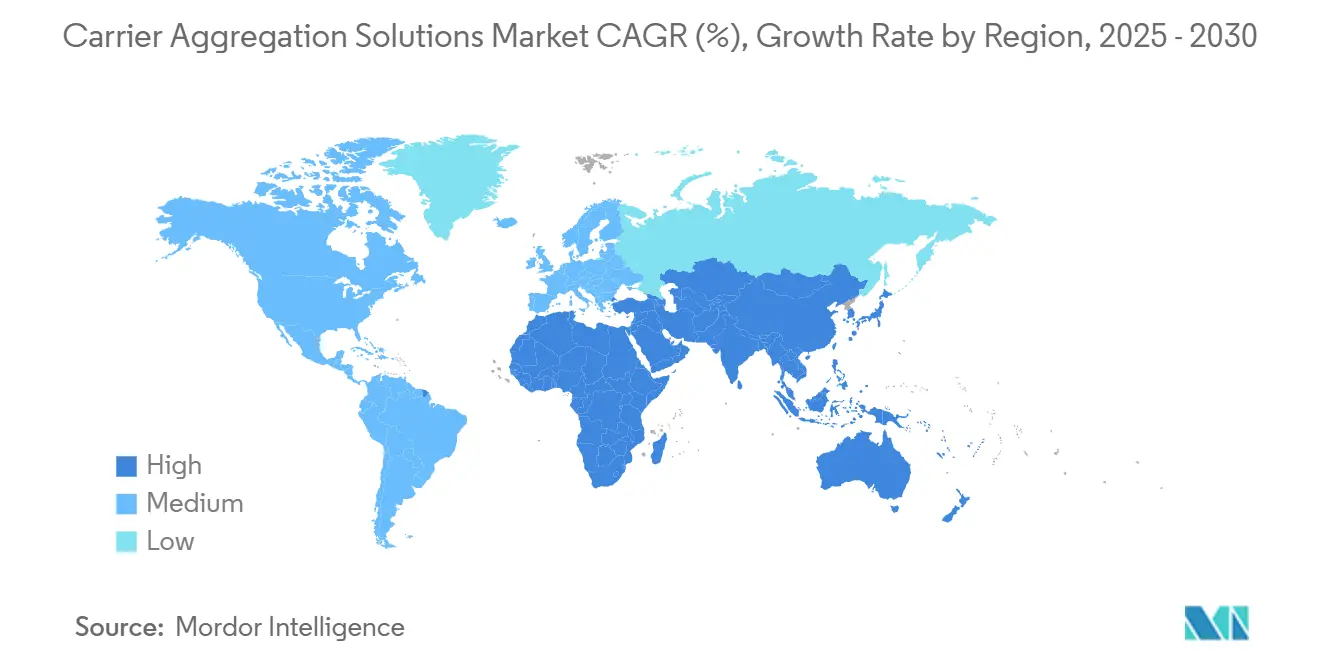
| Fastest Growing Market | Middle East and Africa |
| Largest Market | Asia Pacific |
| Market Concentration | Medium |
Major Players *Disclaimer: Major Players sorted in no particular order Image © Mordor Intelligence. Reuse requires attribution under CC BY 4.0. | |
Carrier Aggregation Solutions Market Analysis by Mordor Intelligence
The Carrier Aggregation Solutions market size is USD 5.68 billion in 2025 and is forecast to reach USD 14.53 billion in 2030 at a 20.66% CAGR. This rapid expansion reflects operator urgency to squeeze higher spectral efficiency from fragmented holdings, evolve beyond dual-carrier setups, and commercialize multi-band architectures that sustain enhanced mobile broadband. Hardware remains the dominant revenue generator because sophisticated RF front-ends and advanced antenna arrays are indispensable for combining up to six component carriers, yet software-defined intelligence is steadily absorbing complexity, trimming energy costs, and hastening time-to-market. Asia-Pacific leads adoption on the back of cohesive policy frameworks and unprecedented 5G roll-outs, while North America and Europe focus on optimizing legacy spectrum through algorithmic refarming. Neutral-host providers are gaining traction as enterprises demand private networks that circumvent traditional operator lock-ins, and dynamic spectrum-sharing algorithms are sharpening the return on investment for carrier aggregation by orchestrating real-time resource allocation.
Key Report Takeaways
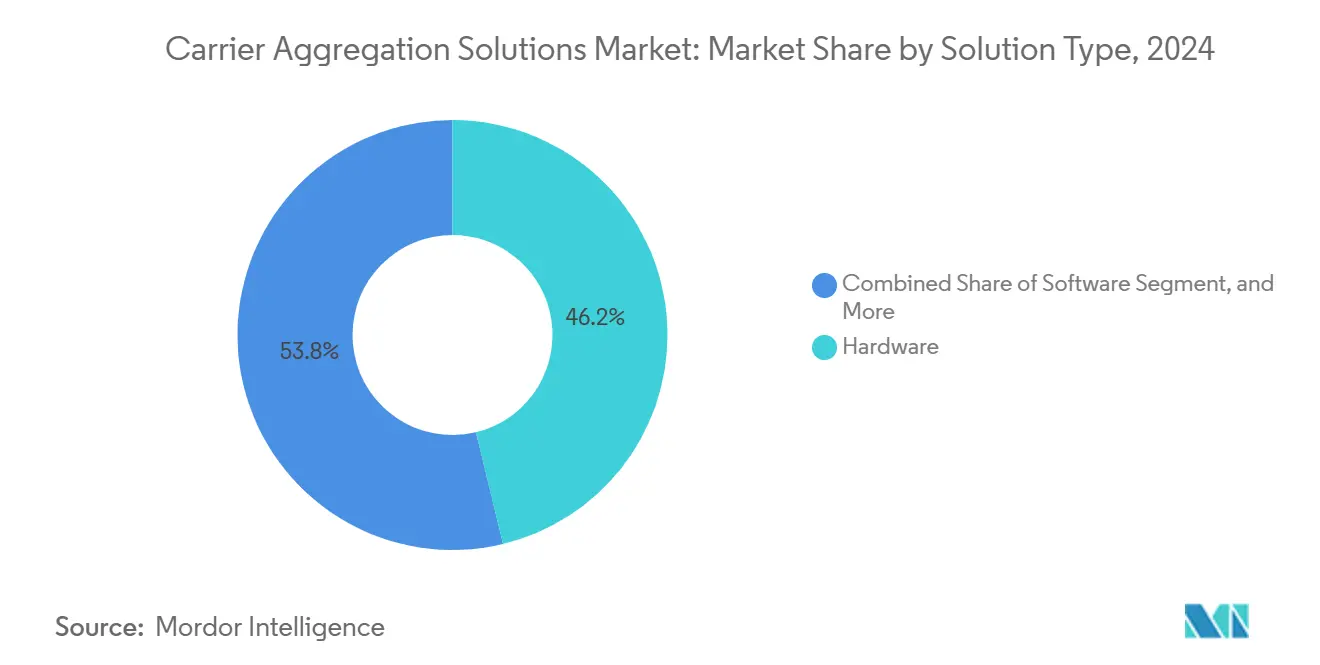
- By solution type, hardware led with 46.23% revenue share in 2024 while software is projected to record a 22.68% CAGR through 2030.
- By deployment mode, macro cells accounted for 39.31% of the 2024 total, whereas small cells are forecast to expand fastest at a 20.87% CAGR to 2030.
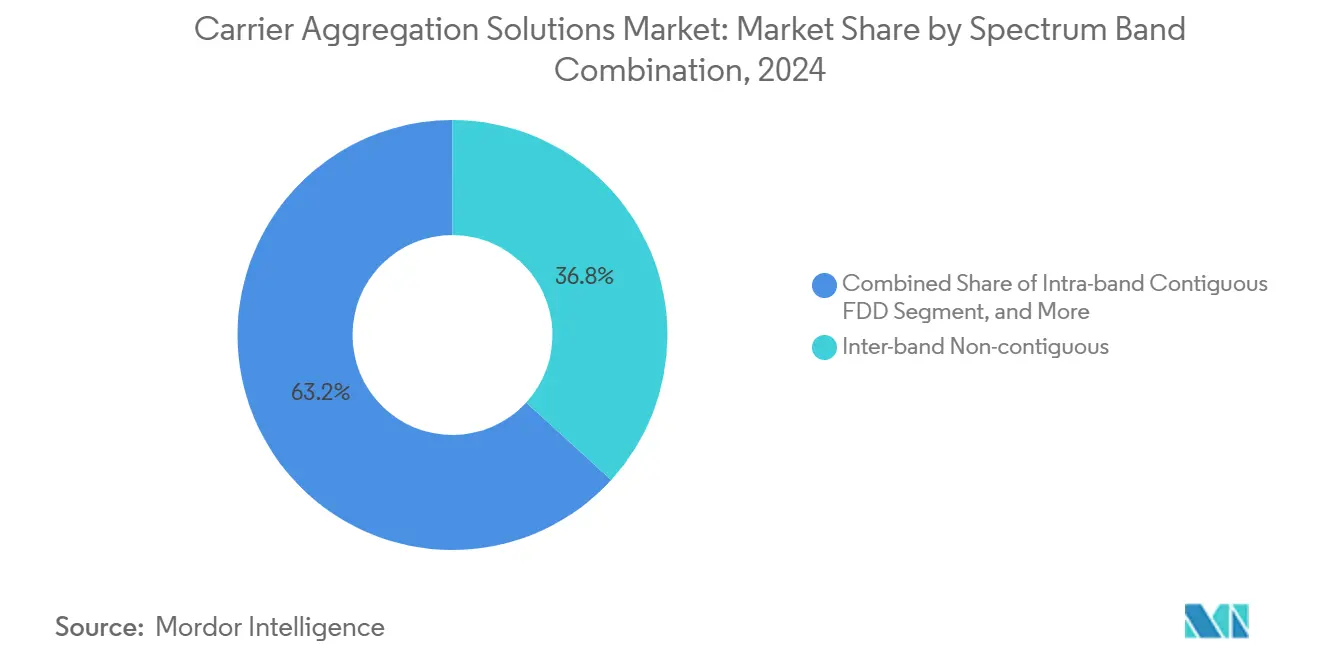
- By spectrum band combination, inter-band non-contiguous configurations held 36.78% share in 2024 and are advancing at a 21.13% CAGR through 2030.
- By network technology, 5G NR captured 55.42% share in 2024, and 5G NR-Advanced Pro shows the highest projected CAGR at 22.94% to 2030.
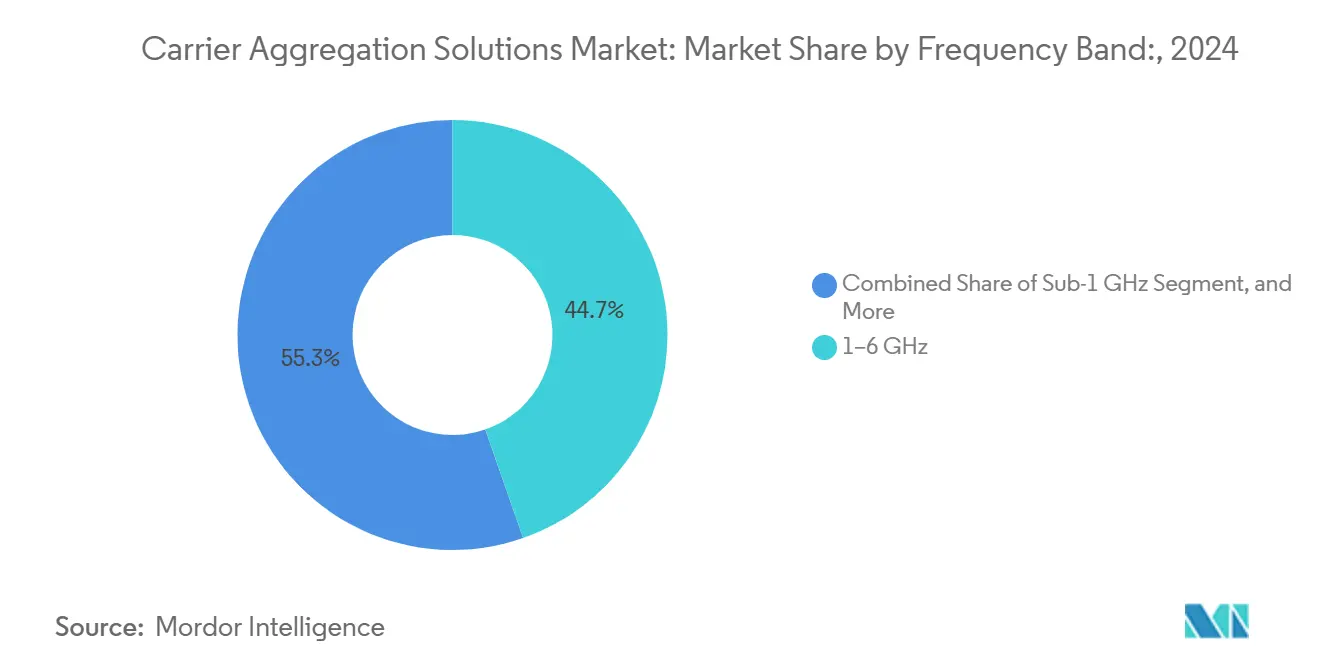
- By frequency band, the 1–6 GHz range dominated with 44.67% share in 2024, while >6 GHz/mmWave is growing quickest at 22.43% CAGR.
- By end-user, Tier-1 mobile network operators commanded 51.83% share in 2024 as neutral-host providers emerge with the strongest 21.73% CAGR outlook.
- By geography, Asia-Pacific commanded 33.47% share in 2024, while Middle East and Africa is growing quickest at 21.39% CAGR.
Global Carrier Aggregation Solutions Market Trends and Insights
Drivers Impact Analysis*
| Driver | (~) % Impact on CAGR Forecast | Geographic Relevance | Impact Timeline |
|---|---|---|---|
| Rapid 5G NR roll-outs | +4.2% | Global, with Asia-Pacific leading | Medium term (2-4 years) |
| Spectrum refarming to FDD-TDD combos | +3.8% | North America and Europe | Short term (≤ 2 years) |
| Need for peak-throughput for e-MBB | +3.5% | Global urban centers | Long term (≥ 4 years) |
| Dynamic spectrum sharing algorithms boost CA ROI | +2.9% | Asia-Pacific core, spill-over to MEA | Medium term (2-4 years) |
| Rise of neutral-host private networks | +2.7% | North America and EU | Long term (≥ 4 years) |
| AI-driven RAN optimisation cuts CA OPEX | +2.4% | Global | Medium term (2-4 years) |
| Source: Mordor Intelligence | |||
Rapid 5G NR Roll-outs Drive Infrastructure Modernization
Operators deploying standalone 5G are migrating from LTE-Advanced toward six-component aggregation that melds low, mid, and high-band channels for multigigabit rates. T-Mobile exceeded 3.6 Gbps on live spectrum after integrating six sub-6 GHz carriers, underscoring how the Carrier Aggregation Solutions market enables peak throughput without extra spectrum auctions. Artificial-intelligence-based–based RAN software refines carrier selection in real time, cutting energy consumption per site by 14% and lifting heavy-user throughput by 11.6%, proof that intelligence, not brute-force hardware, now drives network modernization. [1]Fierce Network Staff, “Optimizing RAN Energy Efficiency With AI,” Fierce Network, fierce-network.com The proliferation of standalone 5G among 305 operators gives vendors a broad canvas to monetize modernization cycles with advanced aggregation portfolios.
Spectrum Refarming Unlocks Fragmented Assets
Flexible licensing regimes let operators re-purpose underused FDD holdings and overlay them with mid-band TDD channels, creating 20 MHz paired spectra without fresh auctions. EE’s 2100 MHz refarm using dual-band RRUs demonstrated tangible capacity gains while avoiding costly green-field roll-outs, validating the Carrier Aggregation Solutions market proposition for asset optimization. [2]Huawei Technologies Co., “Refarming Service Revolutionizes Network Spectrum Efficiency,” huawei.comVendors supplying turnkey refarming tools now control 45% of deployments across more than 100 networks, signalling robust demand for solutions that monetize stranded spectrum. Regulators are endorsing such policies because they deliver economic efficiency and wider 5G coverage.
Enhanced Mobile Broadband Demands Drive Peak Throughput Requirements
Exploding video streaming, cloud gaming, and industrial IoT workloads compel carriers to guarantee consistent gigabit-class speeds, especially in dense metros where single-carrier performance saturates. MediaTek’s 3.2 Gbps downlink using three aggregated carriers with Nokia AirScale proved that combining 210 MHz of mixed FDD/TDD channels multiplies user experience without additional towers [3]MediaTek Inc., “MediaTek & Nokia Achieve 5G 3CC Carrier Aggregation First,” mediatek.com. Operators leverage this capability to launch premium service tiers, boosting average revenue per user and differentiating against rivals. By aggregating dissimilar bands, networks sustain high throughput during congestion, a decisive advantage in competitive urban markets.
Dynamic Spectrum-Sharing Algorithms Enhance ROI
Dynamic spectrum sharing permits simultaneous LTE and 5G operation in a common band, deferring spectrum clearing while preserving aggregation gains. Rohde & Schwarz reports that algorithmic scheduling preserves throughput and spectral efficiency, letting carriers phase in 5G radio heads at lower CAPEX. AI-infused optimisation at Rakuten Mobile cuts RAN power by up to 20% through adaptive carrier activation, further evidencing that smart software magnifies aggregation economics. Predictive allocation models pre-empt congestion, maintaining quality of service and extending hardware life spans.
Restraints Impact Analysis*
| Restraint | (~) % Impact on CAGR Forecast | Geographic Relevance | Impact Timeline |
|---|---|---|---|
| Fragmented spectrum allocations | -2.8% | Global, particularly emerging markets | Long term (≥ 4 years) |
| High CAPEX for multi-band RF front-ends | -3.2% | Global | Short term (≤ 2 years) |
| Certification delays for CA chipsets | -1.9% | Global | Medium term (2-4 years) |
| Thermal limits in UE at >4-component CA | -2.1% | Global | Medium term (2-4 years) |
| Source: Mordor Intelligence | |||
Fragmented Spectrum Allocations Constrain Deployment Efficiency
Non-contiguous licences oblige operators to engineer complex RF chains and inter-band filters, driving up device costs and complicating roll-outs in emerging markets. Harmonization gaps force bespoke network tuning, eroding economies of scale and slowing adoption of the Carrier Aggregation Solutions market, especially where regulators auctioned narrow, scattered blocks. The engineering burden increases interference-mitigation overhead, extending deployment timelines and limiting standardization benefits.
High CAPEX Requirements for Multi-band RF Front-ends
Supporting six simultaneous carriers demands high-linearity power amplifiers, intricate multiplexers, and advanced thermal solutions, inflating radio-unit costs just as operators manage flat revenue growth. Component suppliers are introducing quadplexers and envelope-tracking amplifiers, yet premium pricing persists, and telecom CAPEX contracted 10% in 2024, evidencing budget pressure. The expense profile discourages smaller carriers from fully exploiting carrier aggregation, restraining the near-term growth of the Carrier Aggregation Solutions market.
*Our forecasts treat driver/restraint impacts as directional, not additive. The impact forecasts reflect baseline growth, mix effects, and variable interactions.
Segment Analysis
By Solution Type: Software Gains Momentum Amid Hardware Dominance
Hardware captured 46.23% of the Carrier Aggregation Solutions market in 2024 thanks to indispensable RF front-ends that manage multiple concurrent bands. This share translates into the largest slice of the Carrier Aggregation Solutions market size, underscoring vendors’ leverage in supplying high-performance amplifiers and antenna arrays. Demand is reinforced by 5G NR releases, allowing 6-component aggregation, which requires precision filters and duplexers to prevent inter-modulation. Services complement hardware because operators outsource performance audits, spectrum planning, and acceptance testing to experts who can unlock aggregation benefits quickly. Meanwhile, software-centric innovation accelerates as AI-driven analytics orchestrate dynamic carrier selection, slashing energy use and reducing on-site visits.
Software, advancing at a 22.68% CAGR, embeds self-optimizing network functions into cloud platforms, allowing CSPs to pilot new spectrum configurations overnight. The shift mirrors the broader industrial pivot toward virtualization, where compute-intensive decisions migrate to edge clouds. Automating spectrum refarming through software narrows OPEX and elevates the Carrier Aggregation Solutions market value proposition for mid-tier operators lacking deep RF engineering teams. Services maintain steady single-digit gains, mainly from design, integration, and continuous monitoring contracts. As Release 18 moves toward 10-component aggregation, demand for vendor-agnostic orchestration tools is set to broaden, intensifying competition among cloud-native suppliers.


By Deployment Mode: Small Cells Accelerate Urban Densification
Macro sites delivered 39.31% of 2024 revenue, benefiting from pre-existing towers and broad coverage layers that readily accommodate additional component carriers. Operators pair low-band 700 MHz with mid-band 3.5 GHz on macro sectors to achieve contiguous coverage while elevating capacity, assisting them in protecting Carrier Aggregation Solutions market share. These installations exploit high-power radios, but they encounter spectral crowding in city cores, triggering the need for densification.
Small cells, scaling at a 20.87% CAGR, inject localized bandwidth into venues, campuses, and transit hubs where macro signal quality dips. Cloud-RAN architectures pool base-band processing in centralized data centers, enabling coordinated carrier aggregation across clusters of small cells with lower overall hardware overhead. Heterogeneous networks integrate macro and small cells to balance reach with capacity, and their cloud-native underpinnings facilitate flash-deployment of new component carriers. Virtualized networks thus future-proof operator footprints against surging data demand while containing site-level costs, amplifying the attractiveness of the Carrier Aggregation Solutions market.
By Spectrum Band Combination: Inter-band Non-contiguous Holds the Advantage
Inter-band non-contiguous aggregation dominated at 36.78% share in 2024 as operators knitted together low-band coverage with mid-band capacity and mmWave burst speed, maximizing the Carrier Aggregation Solutions market size across geographies. This configuration demands intricate RF scheduling to overcome disparate propagation profiles, yet its flexibility unlocks unmatched spectral efficiency. Regulatory endorsement of FDD/TDD coexistence accelerates adoption, and advanced schedulers now optimize guard bands automatically, reducing manual tuning.
With a 21.13% CAGR, inter-band non-contiguous will remain the growth engine because few operators enjoy contiguous 100 MHz blocks. Aggregating dispersed holdings draws higher net throughput without new auctions, cementing the economic argument for investment. Meanwhile, intra-band contiguous solutions serve rural corridors where contiguous 20 MHz slices remain common, offering lower RF complexity. As multi-band 5G NR-Advanced matures, expect algorithms to predictively allocate carriers based on user velocity and QoS levels, sustaining the dynamism of the Carrier Aggregation Solutions market.
By Network Technology: 5G NR Defines the New Baseline
The 5G NR segment commanded a 55.42% share in 2024, translating into the largest chunk of the Carrier Aggregation Solutions market size, as Release 16 standardized multi-gigabit downlink using up to eight carriers. Native support for slot aggregation and low-latency scheduling makes 5G the default canvas for future enhancements. LTE-A and LTE-A Pro still underpin rural coverage and low-ARPU markets because of existing device ecosystems, but their spectral efficiency ceiling is nearing.
5G NR-Advanced Pro, projected at a 22.94% CAGR, integrates AI for interference prediction and component-carrier pre-selection, shrinking signaling overhead. Demonstrations of 6 Gbps using six aggregated carriers exemplify the upper bound achievable with commercial chipsets, validating the technical headroom to support traffic surges foreseen in XR and industrial automation. Backward compatibility protects investment as operators smoothly refarm LTE carriers into 5G service, reinforcing confidence in the Carrier Aggregation Solutions market.
By Frequency Band: Mid-band Spectrum Balances Coverage and Capacity
Mid-band 1–6 GHz frequencies delivered 44.67% of 2024 revenue, reflecting their sweet-spot propagation combined with ample bandwidth that underpins Carrier Aggregation Solutions market share leadership. Integrating 2.5 GHz and 3.5 GHz channels yields city-wide gigabit peaks without the attenuation challenges of mmWave, making mid-band the workhorse for nationwide 5G. Low-band sub-1 GHz augments coverage inside buildings and along highways, giving aggregated sessions a reliable anchor.
The >6 GHz/mmWave segment will rise at 22.43% CAGR as regulators free up 26 GHz and 39 GHz tranches and as device thermal designs mature to handle wide bandwidth bursts. Aggregating mmWave with sub-6 GHz anchors yields blended links that sustain 5 Gbps downtown while maintaining session continuity in cell-edge scenarios. This evolution solidifies the importance of frequency diversity in propelling the Carrier Aggregation Solutions market forward.
By End-user: Tier-1 Operators Set the Pace while Neutral-host Gains Ground
Tier-1 operators held 51.83% of 2024 spend, leveraging diversified spectrum portfolios to craft sophisticated six-carrier matrices that fortify their Carrier Aggregation Solutions market share. Their scale enables nationwide roll-outs, and proprietary device certification channels hasten velocity to market. They also spearhead early trials of AI-based spectrum management that trim OPEX by automating channel assignments.
Neutral-host providers, accelerating at 21.73% CAGR, cater to enterprises that prefer owning private connectivity cycles, especially across manufacturing campuses and logistics hubs. CBRS adoption in the United States demonstrates how shared spectrum plus targeted carrier aggregation yields bespoke coverage without the cost structure of public mobile services. Tier-2/3 operators and private-network enterprises round out demand, frequently sourcing managed services to offset scarce RF expertise. Their aggregated consumption nonetheless widens the total addressable Carrier Aggregation Solutions market as hardware prices moderate.
Geography Analysis
Asia-Pacific’s 33.47% 2024 revenue share translates into the largest regional slice of the Carrier Aggregation Solutions market, powered by China’s 5G uptake, South Korea’s 133.3 Mbps average download speeds, and Japan’s nationwide spectrum allocations that enable early 4-carrier deployments. The region’s 21.39% CAGR stems from spectrum-friendly policies and persistent infrastructure funding that extend multi-band roll-outs into India and emerging ASEAN economies. Operators there prioritize inter-band non-contiguous aggregation across 700 MHz/2.3 GHz/3.5 GHz, delivering broad coverage and urban capacity.
North America leverages extensive refarming to combine 600 MHz and 2.5 GHz in macro layers, preserving customer experience while mmWave augments stadiums and downtown cores. The big three carriers dedicated USD 49 billion CAPEX in 2024, anchoring demand for high-order carrier aggregation that underpins premium unlimited plans. Europe follows with harmonized 3.4–3.8 GHz assignments but battles fragmented legacy bands; operators mitigate gaps through spectrum-sharing algorithms to protect Carrier Aggregation Solutions market position.
Middle East and Africa, the fastest-growing region, leapfrogs directly to 5G NR, exploiting green-field opportunities and government incentives. Aggregating 800 MHz with newly auctioned 3.5 GHz allows countries like Saudi Arabia to blanket urban corridors rapidly, while emerging African markets rely on neutral-host consortia to deploy private industrial networks. Latin America records steady growth as operators upgrade LTE-A sites into 5G stand-alone mode, aggregating AWS-3 and 3.5 GHz to bridge urban capacity voids.

Competitive Landscape
The Carrier Aggregation Solutions industry exhibits moderate consolidation as Nokia, Ericsson, and Huawei bundle multi-band radios with AI-optimised software suites to secure operator lock-ins. Nokia’s collaboration with Samsung yielded a 6 Gbps six-carrier demo that validates commercial viability and underscores how joint R&D accelerates product roadmaps. Ericsson’s programmable network revenues rose to SEK 55 billion in Q1 2025, reflecting operator appetite for software-defined spectrum orchestrators that curtail operational waste.
Qualcomm, MediaTek, and Samsung LSI vie within the chipset layer, filing patents on receiver architectures that certify higher-order aggregation without excessive power draw. Their roadmap alignment with 3GPP releases determines device readiness, influencing operator deployment timing. Specialized firms such as AirHopAI supply predictive energy-savings algorithms that shave 20% power use, appealing to carriers pressed by sustainability mandates.
Neutral-host pioneers Celona and Federated Wireless target enterprise verticals by packaging CBRS-based private networks with out-of-the-box carrier aggregation, bypassing public operator cycles. This niche gains regulatory support as spectrum-as-a-service models promote industrial digitization. Overall, competition pivots on the ability to harmonize hardware, cloud software, and automation, ensuring the Carrier Aggregation Solutions market remains dynamic and innovation-driven.
Carrier Aggregation Solutions Industry Leaders
Nokia Oyj
Telefonaktiebolaget LM Ericsson
Huawei Technologies Co., Ltd.
ZTE Corporation
Samsung Electronics Co., Ltd.
- *Disclaimer: Major Players sorted in no particular order


Recent Industry Developments
- July 2025: Nokia and Samsung achieved 6 Gbps downlink using 6-component carrier aggregation.
- July 2025: Nokia, BT Group, and Qualcomm completed Europe’s first 5G stand-alone 5-component aggregation at 1.85 Gbps.
- April 2025: Ericsson posted SEK 55.0 billion Q1 sales with a 12.6% adjusted EBITA margin
- March 2025: MediaTek reached 3.2 Gbps peak throughput via 3-carrier aggregation with Nokia equipment.


Global Carrier Aggregation Solutions Market Report Scope
| Hardware |
| Software |
| Services |
| Macro Cell |
| Small Cell |
| Heterogeneous Networks (HetNet) |
| Virtualised/Cloud RAN |
| Intra-band Contiguous FDD |
| Intra-band Contiguous TDD |
| Intra-band Non-contiguous |
| Inter-band Non-contiguous (FDD+TDD) |
| LTE-Advanced and LTE-A Pro |
| 5G NR |
| 5G NR-Advanced Pro |
| Sub-1 GHz |
| 1–6 GHz |
| >6 GHz / mmWave |
| Tier-1 Mobile Network Operators |
| Tier-2/3 Mobile Network Operators |
| Neutral-Host Providers |
| Private Network Enterprises |
| North America | United States | |
| Canada | ||
| Mexico | ||
| Europe | Germany | |
| United Kingdom | ||
| France | ||
| Russia | ||
| Rest of Europe | ||
| Asia-Pacific | China | |
| Japan | ||
| India | ||
| South Korea | ||
| Australia | ||
| Rest of Asia-Pacific | ||
| Middle East and Africa | Middle East | Saudi Arabia |
| United Arab Emirates | ||
| Rest of Middle East | ||
| Africa | South Africa | |
| Egypt | ||
| Rest of Africa | ||
| South America | Brazil | |
| Argentina | ||
| Rest of South America | ||
| By Solution Type | Hardware | ||
| Software | |||
| Services | |||
| By Deployment Mode | Macro Cell | ||
| Small Cell | |||
| Heterogeneous Networks (HetNet) | |||
| Virtualised/Cloud RAN | |||
| By Spectrum Band Combination | Intra-band Contiguous FDD | ||
| Intra-band Contiguous TDD | |||
| Intra-band Non-contiguous | |||
| Inter-band Non-contiguous (FDD+TDD) | |||
| By Network Technology | LTE-Advanced and LTE-A Pro | ||
| 5G NR | |||
| 5G NR-Advanced Pro | |||
| By Frequency Band | Sub-1 GHz | ||
| 1–6 GHz | |||
| >6 GHz / mmWave | |||
| By End-user | Tier-1 Mobile Network Operators | ||
| Tier-2/3 Mobile Network Operators | |||
| Neutral-Host Providers | |||
| Private Network Enterprises | |||
| By Geography | North America | United States | |
| Canada | |||
| Mexico | |||
| Europe | Germany | ||
| United Kingdom | |||
| France | |||
| Russia | |||
| Rest of Europe | |||
| Asia-Pacific | China | ||
| Japan | |||
| India | |||
| South Korea | |||
| Australia | |||
| Rest of Asia-Pacific | |||
| Middle East and Africa | Middle East | Saudi Arabia | |
| United Arab Emirates | |||
| Rest of Middle East | |||
| Africa | South Africa | ||
| Egypt | |||
| Rest of Africa | |||
| South America | Brazil | ||
| Argentina | |||
| Rest of South America | |||


Key Questions Answered in the Report
What is the size of the Carrier Aggregation Solutions market in 2025, and how fast is it growing?
The Carrier Aggregation Solutions market size stands at USD 5.68 billion in 2025 and is forecast to expand at a 20.66% CAGR to USD 14.53 billion by 2030.
Which region contributes the largest revenue share to carrier aggregation solutions?
Asia-Pacific leads with a 33.47% share in 2024, supported by rapid 5G deployments and coordinated spectrum policies.
Which solution category is expanding fastest within carrier aggregation?
Software-based solutions grow at a 22.68% CAGR because AI-driven RAN optimisation reduces energy use and operational complexity.
Why is inter-band non-contiguous aggregation so dominant?
It lets operators combine disparate low-, mid-, and high-band holdings, maximizing throughput without purchasing new contiguous spectrum blocks.
Who are the major vendors in carrier aggregation solutions?
Nokia, Ericsson, Huawei, Qualcomm, and Samsung dominate, while neutral-host players such as Celona and Federated Wireless are emerging challengers.
How do dynamic spectrum-sharing algorithms impact carrier aggregation ROI?
They enable simultaneous LTE and 5G in the same band, reducing spectrum-clearing costs and improving utilization, thereby lifting the return on carrier aggregation investments.
Page last updated on:


