Convergent Billing Market Size and Share
Market Overview
| Study Period | 2020 - 2031 |
|---|---|
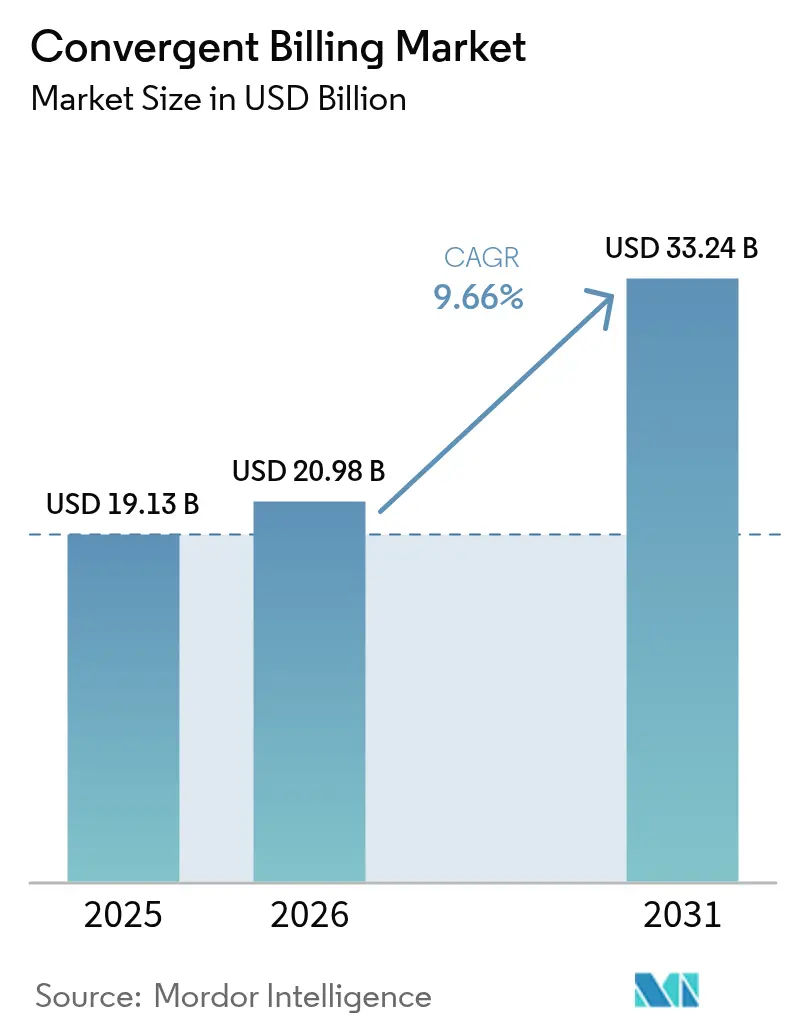
| Market Size (2026) | USD 20.98 Billion |
| Market Size (2031) | USD 33.24 Billion |
| Growth Rate (2026 - 2031) | 9.66% CAGR |
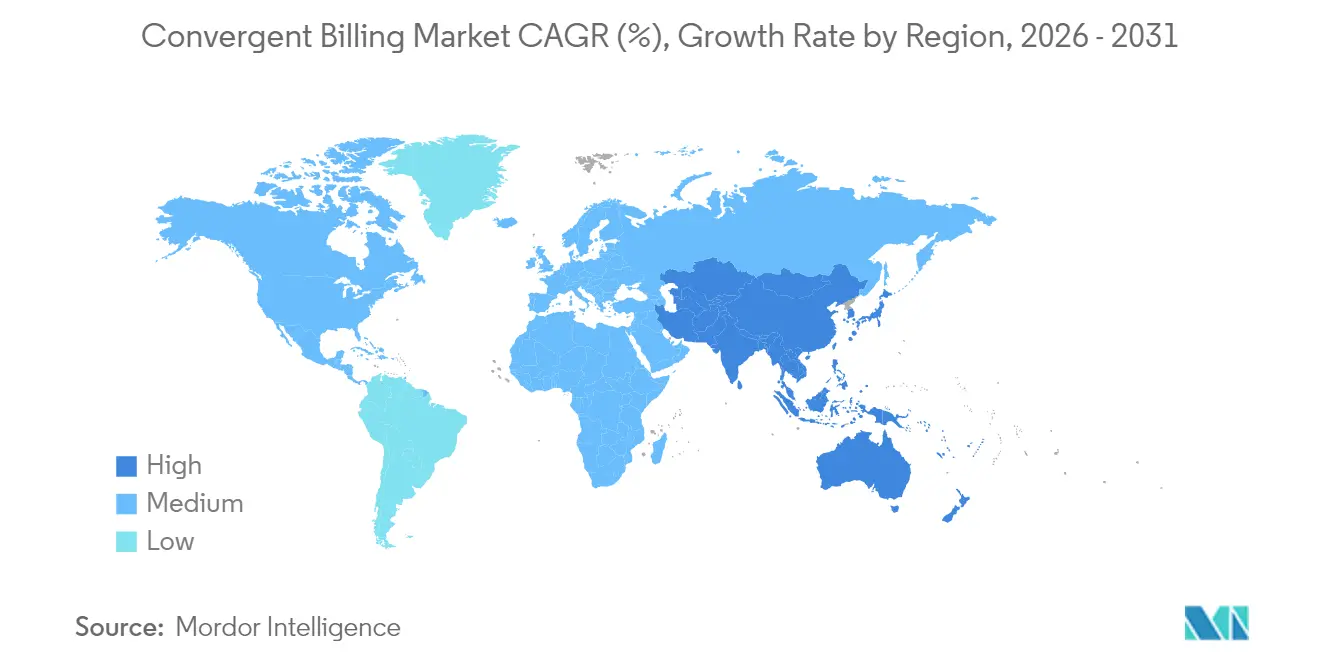
| Fastest Growing Market | Asia Pacific |
| Largest Market | North America |
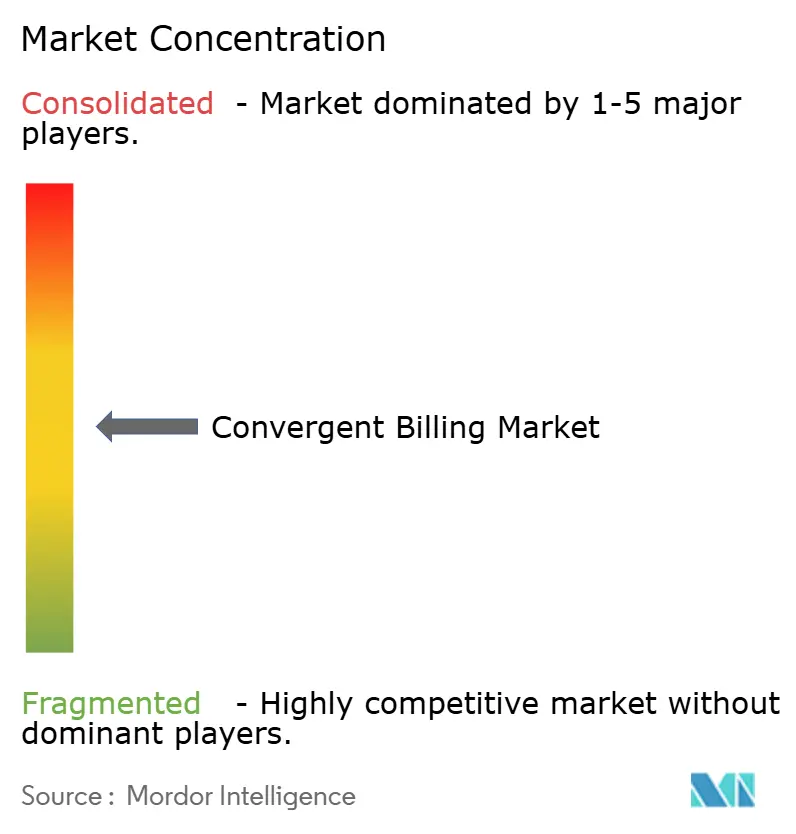
| Market Concentration | Medium |
Major Players *Disclaimer: Major Players sorted in no particular order Image © Mordor Intelligence. Reuse requires attribution under CC BY 4.0. | |
Convergent Billing Market Analysis by Mordor Intelligence
The convergent billing market size is expected to grow from USD 19.13 billion in 2025 to USD 20.98 billion in 2026 and is forecast to reach USD 33.24 billion by 2031 at 9.66% CAGR over 2026-2031. Operators are scaling unified monetization platforms so that a single engine can rate 5G network slices, bundled over-the-top (OTT) content, Internet of Things (IoT) fleets, and prepaid wallets in real-time. Revenue protection demands policy-controlled charging that works within milliseconds, a requirement that pushed Ericsson to commercialize its cloud-native Charging System in 2024 and led AT&T to renew its five-year platform partnership with Amdocs.[1]Amdocs, “Amdocs and AT&T Extend Strategic Partnership,” amdocs.com Services, spanning integration, consulting, and managed operations, are accelerating faster than software as operators outsource multi-year legacy migrations. Cloud deployment is rapidly overtaking on-premise installations because elastic scaling keeps billing infrastructure aligned with spiky data traffic and saves capital spending. Geographically, North America currently commands the highest revenue, yet the Asia-Pacific region is growing the fastest, as Indian and Chinese operators bundle fintech, commerce, and media into super-app ecosystems. Competitive intensity is rising as hyperscalers enter the convergent billing market with software-as-a-service (SaaS) modules, but most communication-service providers (CSPs) still cite skills gaps in cloud-native business-support systems (BSS) as the main barrier to wholesale platform shifts.
Key Report Takeaways
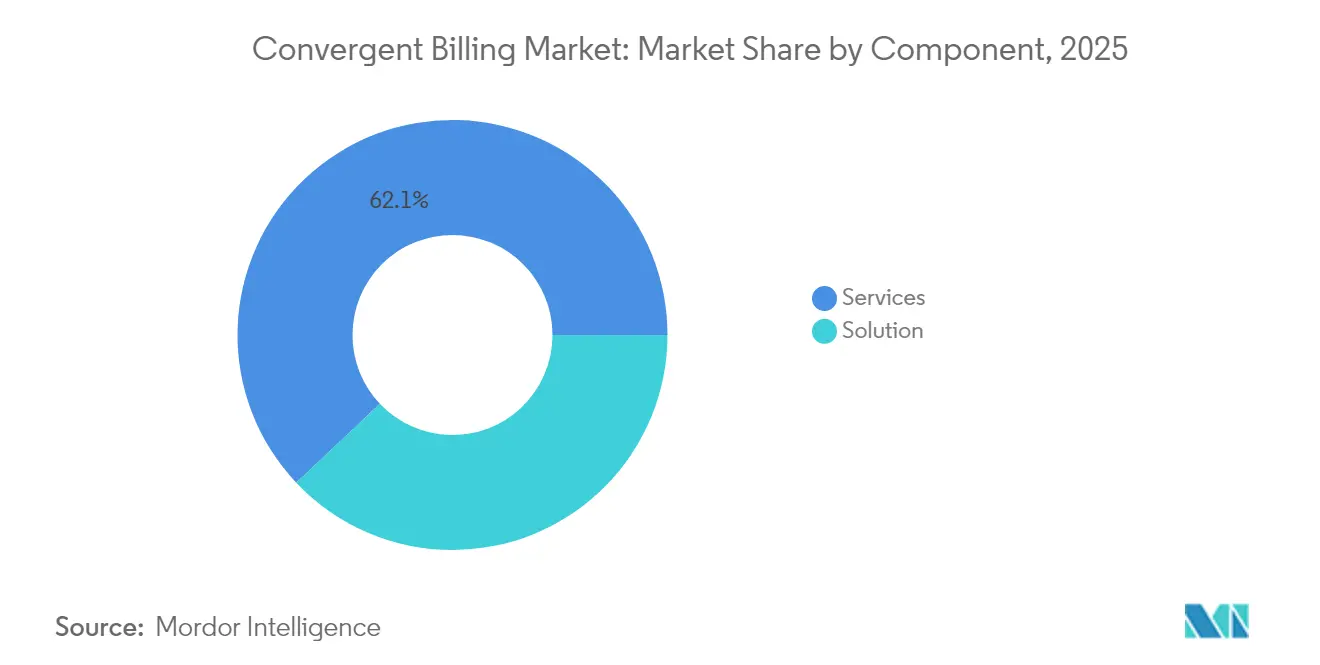
- By component, services captured 62.05% of the convergent billing market share in 2025, while services revenue is projected to expand at a 10.78% CAGR through 2031.
- By deployment model, the cloud segment accounted for 45.78% of the convergent billing market size in 2025, and it is forecast to record a 10.47% CAGR to 2031.
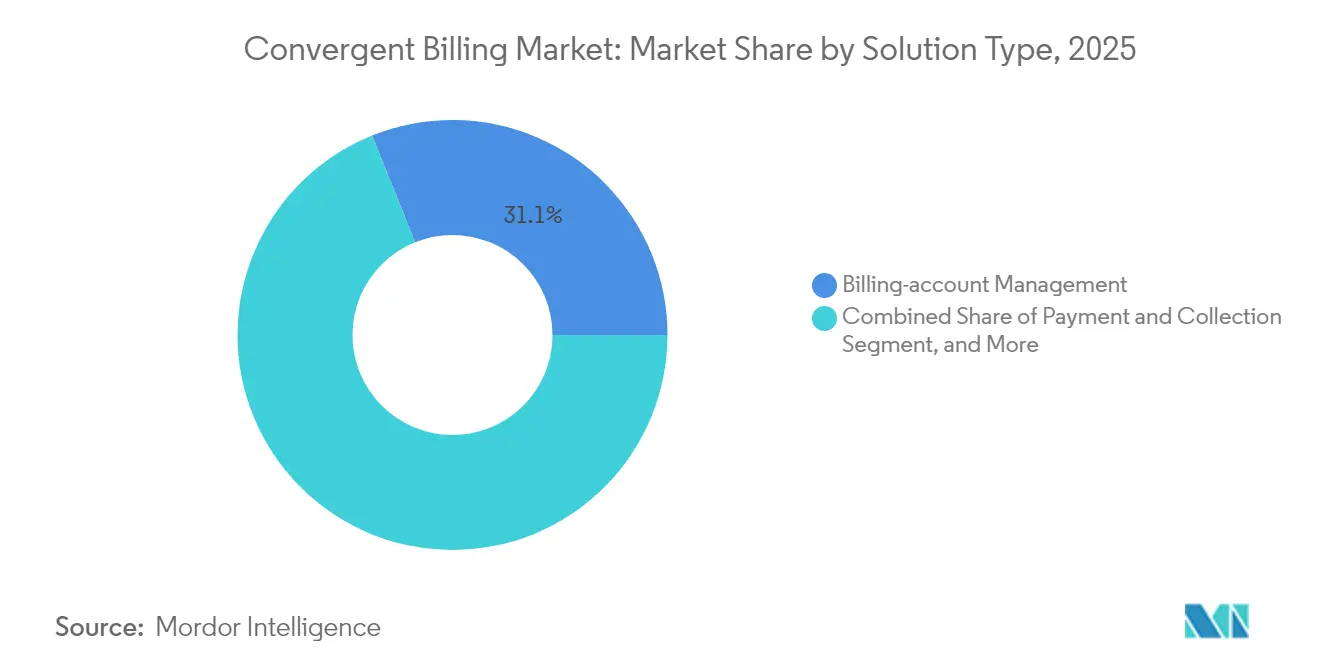
- By solution type, customer-relationship-management modules will post the fastest 9.86% CAGR even though billing-account-management retained the largest 31.10% share of the convergent billing market size in 2025.
- By operator type, fixed-line held 35.10% of the convergent billing market share in 2025, and mobile applications are projected to expand at a 10.23% CAGR through 2031.
- By region, North America contributed 32.30% of the convergent billing market size in 2025, whereas Asia-Pacific is forecast to achieve a 10.19% CAGR to 2031.
Note: Market size and forecast figures in this report are generated using Mordor Intelligence’s proprietary estimation framework, updated with the latest available data and insights as of 2026.
Global Convergent Billing Market Trends and Insights
Drivers Impact Analysis*
| Driver | (~) % Impact on CAGR Forecast | Geographic Relevance | Impact Timeline |
|---|---|---|---|
| Real-time 5G network-slicing monetization | +2.1% | Global, with early traction in South Korea, Japan, North America | Medium term (2-4 years) |
| Bundling of telco + OTT/IoT services | +1.8% | North America, Europe, Asia-Pacific urban clusters | Short term (≤ 2 years) |
| Cloud-native micro-services billing adoption | +1.6% | Global, led by Tier-1 operators in North America, Europe, Asia-Pacific | Long term (≥ 4 years) |
| AI-driven revenue-assurance and fraud analytics | +1.3% | Global, with higher ROI in prepaid-heavy MEA and South Asia | Medium term (2-4 years) |
| Rapid growth of prepaid digital wallets in MEA | +1.5% | Middle East and Africa, South Asia | Short term (≤ 2 years) |
| Emerging B2B private-network billing demand | +1.5% | North America, Europe, Japan, South Korea | Medium term (2-4 years) |
| Source: Mordor Intelligence | |||
Real-Time 5G Network-Slicing Monetization
Commercial slices remain scarce, fewer than 15% of CSPs had monetized slicing by mid-2024, but early projects prove that premium pricing is viable. TIM Brasil and Ericsson launched the first Brazilian standalone slice for agribusiness IoT, charging a 30% premium over standard mobile broadband.[2]Ericsson, “Ericsson Charging System Enables Real-Time Monetization of 5G Services,” ericsson.com ETSI’s OpenSlice APIs, ratified in 2024, shorten multi-vendor integration timelines to under six months. Legacy mediation systems that batch usage every 15 minutes leak revenue because slices scale dynamically, so CSPs are shifting to event-driven charging that triggers invoices within 200 milliseconds. Vodafone’s private-5G offer for factories blends connectivity, edge computing, and applications, demanding convergent billing that apportions costs across each layer.
Bundling of Telco, OTT, and IoT Services
Verizon’s myPlan allows subscribers to toggle Netflix, Max, and Disney+ on a monthly basis, forcing billing stacks to reconcile third-party entitlements in real-time. T-Mobile’s “Netflix On Us” promotion reduced churn by 18 percentage points among bundled lines. China Mobile managed 2.5 billion IoT connections in 2024, each generating micro-transactions that strain legacy billing engines. Ericsson’s IoT Accelerator aggregates device events into monthly invoices and cuts per-transaction costs by 60%. EU interoperability rules now compel operators to expose subscription APIs, slightly eroding margin control but widening addressable revenue for the convergent billing market.[3]European Commission, “EU Data Act Implementation 2024,” europa.eu
Cloud-Native Micro-Services Billing Adoption
Rakuten Mobile’s greenfield cloud stack delivered a 40% lower total cost of ownership and scaled to support 6 million subscribers by 2024, demonstrating that containerized components can effectively replace monolithic BSS. Vodafone moved its European billing to Oracle Cloud Infrastructure in 2024 to reduce peak infrastructure load by 35%. The TM Forum’s Open Digital Architecture standardizes more than 50 APIs, enabling CSPs to switch vendors without needing to rewrite interfaces. Yet Deutsche Telekom’s three-year migration reveals the resource drain: parallel runs added USD 131 million per year to operating expense. Engineers fluent in Kubernetes networking remain scarce, reinforcing demand for vendor-led managed services in the convergent billing market.
AI-Powered Revenue Assurance and Fraud Analytics
Neural Technologies’ AI engine recovered USD 47 million in annual leakage for a Middle Eastern Tier-1 operator by flagging unrated roaming events within five minutes. HCLTech embedded machine-learning models into a European CSP’s billing layer and detected abnormal IoT traffic 24 hours faster than legacy systems. Comviva’s fraud suite cut prepaid top-up fraud by 32% for a South Asian operator in six months. Real-time detection has become critical in prepaid-heavy regions, where 58% of connections in the Middle East and Africa remained prepaid as of 2024. The TM Forum’s Autonomous Networks project aims to achieve self-healing billing flows that automatically suspend suspicious SIMs, eliminating the need for human intervention and protecting revenue while enhancing platform stickiness.
Restraints Impact Analysis*
| Restraint | (~) % Impact on CAGR Forecast | Geographic Relevance | Impact Timeline |
|---|---|---|---|
| High legacy-system migration costs | -1.2% | Global, acute in Europe and North America with aging infrastructure | Long term (≥ 4 years) |
| Data-sovereignty and cross-border privacy rules | -0.9% | Europe (GDPR), China (data localization), Brazil (LGPD) | Medium term (2-4 years) |
| Shortage of OSS/BSS skilled talent | -0.8% | Global, most severe in Asia-Pacific and MEA | Medium term (2-4 years) |
| Vendor lock-in risk with cloud hyperscalers | -0.7% | Global, concentrated in North America and Europe | Long term (≥ 4 years) |
| Source: Mordor Intelligence | |||
High Legacy-System Migration Costs
Vodafone’s seven-year EUR 1 billion modernization covers 21 national markets and more than 200 applications, an outlay that smaller operators cannot match. Deutsche Telekom’s parallel run added USD 131 million per year until the final cutover, illustrating the double-spend that drags down the return on investment. BT Group has set aside GBP 500 million to decouple consumer billing from wholesale, a mandatory step under U.K. functional separation rules. The TM Forum found that 58% of CSPs underestimate the importance of data cleansing and spend up to 14 months reconciling duplicate customer records before migration. Many South American and African operators, therefore, extend the life of legacy stacks, even though patch-based maintenance grows technical debt and stifles innovation in the convergent billing market.
Data-Sovereignty and Cross-Border Privacy Rules
The EU Data Act, effective January 2024, requires in-state storage of telecom billing records unless explicit user consent is obtained, forcing operators such as Vodafone to run 18 discrete database instances across Europe and inflating hosting costs by up to 40%. China obliges international vendors to install domestic data centers, adding USD 50–80 million in capital expenditure per provider. Brazil’s LGPD fines reach 2% of revenue for non-compliant cross-border transfers; TIM Brasil relocated its workloads to a sovereign cloud partner in 2024. GSMA estimates that fragmented sovereignty regimes add USD 2–3 billion in annual compliance costs across the global telecom sector, burdening multi-regional players disproportionately.
*Our forecasts treat driver/restraint impacts as directional, not additive. The impact forecasts reflect baseline growth, mix effects, and variable interactions.
Segment Analysis
By Component: Services Surge as Migration Complexity Deepens
Services represented 62.05% of the convergent billing market share in 2025, driven by integration, consulting, and managed operations that accompany multi-year platform upgrades. Vodafone’s seven-year, EUR 1 billion transformation employed more than 400 consultants and exemplifies why service revenue will climb at a 10.78% CAGR to 2031. Deutsche Telekom’s policy of running legacy and cloud stacks in parallel for 18 months added USD 131 million to service fees, reinforcing demand for external expertise.
Solution licenses stay dominant, but face pricing pressure as TM Forum standard APIs enable vendor mixing. Managed services are rising fastest among Tier-2 operators that lack in-house DevOps. Comarch’s 2024 fixed-fee contract in Central Europe converts capital expense into predictable operating expense. Amdocs bundled a USD 500 million managed-services layer into its 2024 AT&T renewal, locking in five more years of recurring revenue. Training services are an under-appreciated growth lever because 67% of CSPs need vendor-run upskilling to operate cloud-native billing. The convergent billing market, therefore, rewards vendors that pair software with long-term service engagement.


By Deployment Model: Cloud Gains as CapEx Pressures Mount
Cloud deployment held 45.78% of the convergent billing market size in 2025 and will outgrow on-premise at a 10.47% CAGR through 2031. Rakuten Mobile validated the economics by cutting the total cost of ownership by 40% relative to traditional BSS for 6 million subscribers. Oracle’s USD 100 million annual deal with Vodafone migrates European billing workloads to Oracle Cloud Infrastructure, retiring multiple data centers. Airtel adopted Ericsson Charging on Amazon Web Services to burst capacity during Diwali traffic peaks without permanent over-provisioning.
On-premise persists where localization or latency constraints apply. China Mobile maintains in-country installations for 2.5 billion IoT connections to satisfy national data rules. BT Group’s hybrid model keeps core billing on-site while analytics run in the cloud. Security worries curb public-cloud adoption in several MEA markets, 42% of operators surveyed by GSMA cite breach risk as a barrier. Yet, vendor-agnostic microservices reduce perceived lock-in by allowing CSPs to redeploy workloads across clouds, supporting the long-term ascendancy of cloud in the convergent billing market.
By Solution Type: CRM Modules Accelerate as Churn Pressures Intensify
Billing-account-management held 31.10% of convergent billing market size in 2025, but CRM modules will grow fastest at a 9.86% CAGR through 2031. T-Mobile credits AI-driven CRM alerts with 2.1 million postpaid net adds in Q3 2024, as the system flags high-value subscribers at risk of churn. Comviva predicts churn 45 days in advance, improving retention by 18 percentage points in pilot deployments.
Automated invoice generation is modernizing with event-driven usage records. Ericsson’s Charging System issues invoices within 200 milliseconds, enabling on-demand pricing for 5G slices. Payment modules now integrate instant payment rails; Vodafone embedded Mastercard real-time transfers and reduced days-sales-outstanding by 12 days. Bill-cycle optimization and fraud detection combine AI and real-time metering to quickly recover lost revenue, solidifying vendor value within the convergent billing industry.
By Operator/Application: Mobile Segment Leads Growth Despite Fixed Dominance
Fixed-line services still commanded 35.10% of convergent billing market share in 2025 because fiber and pay-TV bundle margins remain higher, but mobile billing will expand at a 10.23% CAGR to 2031. GSMA reported that 58% of connections in the Middle East and Africa were prepaid in 2024, so mobile operators are monetizing migrations to postpaid plans and digital wallets. Pyypl’s wallet enables users to convert prepaid airtime into merchant payments, integrating telecom usage with financial services within a single ledger.
Fixed operators face margin pressure from overbuilds and therefore bundle fiber, streaming, and hardware. AT&T’s fiber plus streaming bundle needs real-time reconciliation between telco and content catalogs. Sky Glass consolidates broadband, OTT subscriptions, and device financing into a single monthly bill, requiring convergent billing that accommodates mid-cycle changes. Regulatory mandates, such as the EU’s Digital Markets Act, require open APIs, which reduce lock-in while expanding ecosystem revenue for vendors that can orchestrate multiple content partners in the convergent billing market.
Geography Analysis
North America produced 32.30% of convergent billing market size in 2025. Verizon and T-Mobile continue bundling fiber, wireless, and premium video, pushing billing platforms toward sub-second entitlement reconciliation. AT&T signed a USD 500 million annual renewal with Amdocs to keep proven systems in place. CSG won USD 75 million from Dish Network to stand up postpaid 5G billing for more than 8 million lines. Rogers adopted Oracle Cloud to support Canada’s standalone 5G core. América Móvil started migrating Mexican billing to Ericsson Charging ahead of its 2026 completion target.
Asia-Pacific will post a 10.19% CAGR through 2031, the fastest regional growth in the convergent billing market. Bharti Airtel’s Ericsson Charging rollout spans 18 circles and 350 million subscribers. Jio integrates commerce, music, and cinema under a single wallet, illustrating super-app billing complexity. China Mobile’s 2.5 billion IoT connections demand micro-transaction billing at petabyte scale. KDDI in Japan and SK Telecom in South Korea launched network-slicing tariffs that require policy-based real-time charging. Southeast Asian wallets grew 41% year over year, and telecom brands captured 72% of transaction volume, embedding billing deeper into daily life.
Europe confronts cost inflation from data residency. Vodafone runs 18 distinct instances to comply with the Data Act. Orange partners with Oracle to consolidate billing across France, Spain, and Poland, but each country still needs its own database. BT Group decouples wholesale from consumer BSS under U.K. functional separation. Telecom Italia spends EUR 1,500 per consultant day to plug skills gaps, extending timelines. In the Middle East, e& earmarked USD 200 million for cloud-native BSS to power its fintech pivot. Africa’s USD 1.4 trillion mobile-money throughput makes unified wallets essential, and MTN plus Vodacom integrate airtime, data, and merchant payments under one bill. South America’s TIM Brasil monetizes 5G agribusiness slices at a 30% premium, underscoring revenue upside from real-time convergent billing.

Competitive Landscape
The convergent billing market is moderately concentrated. The five largest vendors, Amdocs, Oracle, Ericsson, Huawei, and CSG Systems, collectively captured roughly 58% of 2024 revenue. Amdocs deepened its AT&T foothold by absorbing USD 100 million-plus switching costs inside a fresh five-year commitment. Oracle bought a billing-analytics startup in 2024 to embed AI-driven revenue assurance, advancing vertical integration. Ericsson broadened its ecosystem by certifying 50 third-party applications on TM Forum Open APIs, positioning its Charging System as an orchestration hub. Huawei retains strength in China’s carrier base, while CSG expanded into U.S. satellite-mobile convergence via Dish Network.
Disruptors are taking greenfield share. Matrixx signed a Tier-1 North American cable operator by offering micro-services that bypass legacy code. Cerillion’s Kubernetes-native stack runs on any cloud or on-premise, appealing to operators wary of hyperscaler lock-in. BillingPlatform raised USD 90 million to expand a usage-based engine for IoT and private networks. Zuora and Chargebee specialize in OTT subscription management, providing telcos faster time-to-market for media bundles. Patent filings confirm industry focus on real-time policy control and machine-learning fraud; Nokia registered 12 billing-related patents, and Subex secured three for IoT anomaly detection in 2024.
Vendor strategy clusters around three vectors: embedding analytics engines to raise switching costs, localizing deployments to meet sovereignty rules, and orchestrating multi-partner ecosystems through open APIs. Skills shortages and data-privacy regulations remain defensive moats for incumbents, even as hyperscalers threaten traditional license streams.
Convergent Billing Industry Leaders
IBM Corporation
Amdocs, Inc.
Oracle Corporation
CSG Systems International, Inc.
Telefonaktiebolaget LM Ericsson
- *Disclaimer: Major Players sorted in no particular order

Recent Industry Developments
- May 2025: Ericsson and Telstra announced the commercial launch of a cloud-native Charging System that enables real-time monetization of 5G network slicing across Australia, supporting differentiated latency-tier pricing for enterprise private-network customers
- April 2025: Oracle completed the acquisition of AI-billing analytics firm RevCurate, integrating its anomaly-detection engine into Oracle Cloud Infrastructure BSS to cut revenue-assurance investigation time by 60% for Tier-1 communication-service providers
- March 2025: Amazon Web Services released AWS Telco Billing Hub, a fully managed, event-driven platform that processes up to 25 million usage records per second and offers pre-built connectors for TM Forum Open APIs, targeting mid-market mobile virtual-network operators
- February 2025: Amdocs introduced a Kubernetes-native Convergent Billing Software-as-a-Service offering that runs on any public cloud or on-premise cluster, allowing operators to complete greenfield deployments in under 90 days with continuous delivery pipelines pre-configured for PCI DSS compliance


Global Convergent Billing Market Report Scope
The convergent billing market report is segmented by Component (Solution, and Services), Deployment Model (Cloud, and On-premise), Solution Type (Bill-cycle Optimisation, Billing-account Management, Automated Invoice and Bill Generation, Payment and Collection, Customer-relationship Management), Operator/Application (Mobile, Fixed, Broadband, TV/Streaming), and Geography (North America, South America, Europe, Asia-Pacific, Middle East and Africa). The Market Forecasts are Provided in Terms of Value (USD).
| Solution |
| Services |
| Cloud |
| On-premise |
| Bill-cycle Optimisation |
| Billing-account Management |
| Automated Invoice and Bill Generation |
| Payment and Collection |
| Customer-relationship Management |
| Mobile |
| Fixed |
| Broadband |
| TV / Streaming |
| North America | United States | |
| Canada | ||
| Mexico | ||
| South America | Brazil | |
| Argentina | ||
| Rest of South America | ||
| Europe | Germany | |
| United Kingdom | ||
| France | ||
| Italy | ||
| Spain | ||
| Rest of Europe | ||
| Asia-Pacific | China | |
| India | ||
| Japan | ||
| South Korea | ||
| Rest of Asia-Pacific | ||
| Middle East and Africa | Middle East | United Arab Emirates |
| Saudi Arabia | ||
| Rest of Middle East | ||
| Africa | South Africa | |
| Nigeria | ||
| Rest of Africa | ||
| By Component | Solution | ||
| Services | |||
| By Deployment Model | Cloud | ||
| On-premise | |||
| By Solution Type | Bill-cycle Optimisation | ||
| Billing-account Management | |||
| Automated Invoice and Bill Generation | |||
| Payment and Collection | |||
| Customer-relationship Management | |||
| By Operator / Application | Mobile | ||
| Fixed | |||
| Broadband | |||
| TV / Streaming | |||
| By Geography | North America | United States | |
| Canada | |||
| Mexico | |||
| South America | Brazil | ||
| Argentina | |||
| Rest of South America | |||
| Europe | Germany | ||
| United Kingdom | |||
| France | |||
| Italy | |||
| Spain | |||
| Rest of Europe | |||
| Asia-Pacific | China | ||
| India | |||
| Japan | |||
| South Korea | |||
| Rest of Asia-Pacific | |||
| Middle East and Africa | Middle East | United Arab Emirates | |
| Saudi Arabia | |||
| Rest of Middle East | |||
| Africa | South Africa | ||
| Nigeria | |||
| Rest of Africa | |||


Key Questions Answered in the Report
What is the current value of the convergent billing market?
The convergent billing market size stands at USD 20.98 billion in 2026 and is projected to reach USD 33.24 billion by 2031.
Which component segment is growing the fastest?
Services, including integration and managed operations, will grow at a 10.78% CAGR due to complex legacy migrations.
Why are telecom operators moving billing to the cloud?
Cloud deployment offers elastic scaling that matches demand spikes and eliminates data-center capital expense while supporting new 5G and IoT monetization models.
How will 5G network slicing influence convergent billing?
Slicing requires sub-second policy control and rating, so operators are adopting event-driven billing engines that can monetize differentiated quality-of-service tiers in real time.
Which region will experience the highest growth through 2031?
Asia-Pacific will achieve the fastest 10.19% CAGR as operators bundle telecom, fintech, and media inside super-app ecosystems requiring unified billing.
Page last updated on:


