Digital Business Card Market Size and Share
Market Overview
| Study Period | 2020 - 2031 |
|---|---|
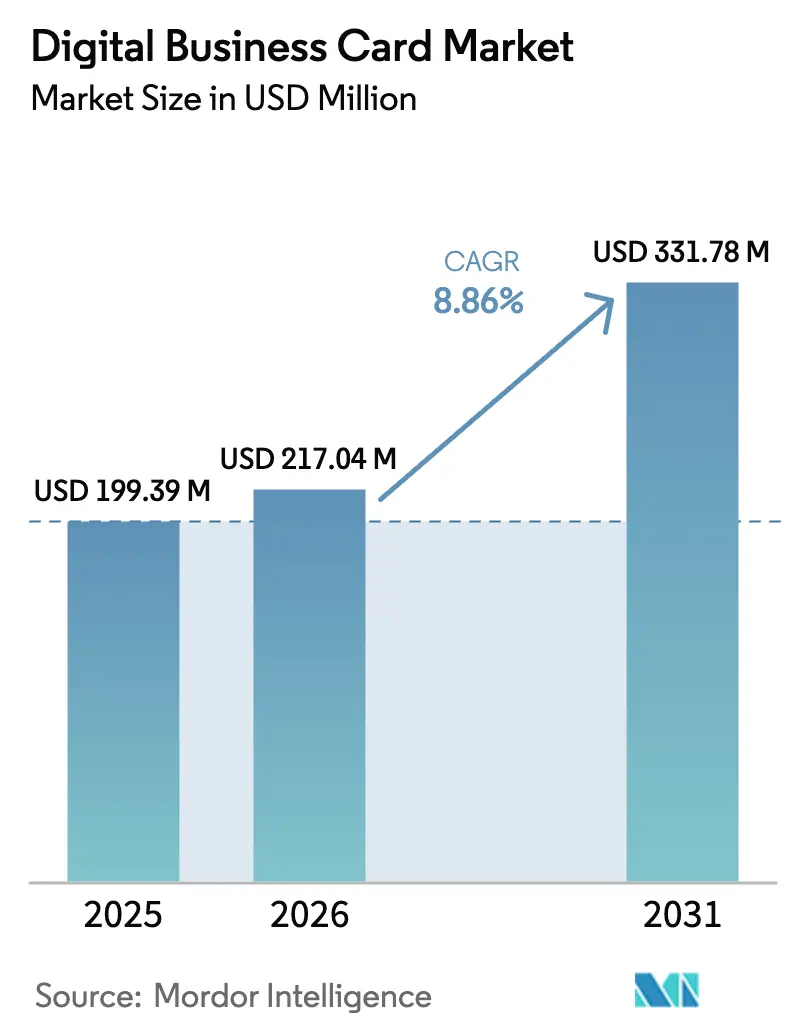
| Market Size (2026) | USD 217.04 Million |
| Market Size (2031) | USD 331.78 Million |
| Growth Rate (2026 - 2031) | 8.86% CAGR |
| Fastest Growing Market | Asia Pacific |
| Largest Market | North America |
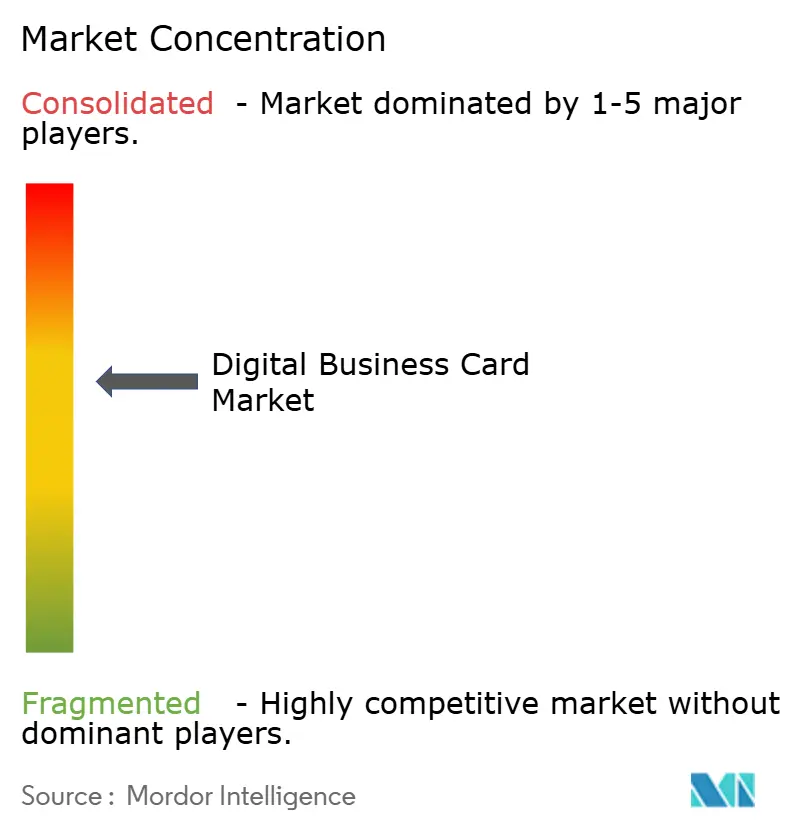
| Market Concentration | Medium |
Major Players *Disclaimer: Major Players sorted in no particular order Image © Mordor Intelligence. Reuse requires attribution under CC BY 4.0. | |
Digital Business Card Market Analysis by Mordor Intelligence
The digital business card market size is projected to expand from USD 199.39 million in 2025 and USD 217.04 million in 2026 to USD 331.78 million by 2031, registering a CAGR of 8.86% between 2026 to 2031. This expansion is fueled by enterprises switching from paper exchange to smartphone-native, cloud-synced solutions that integrate directly with customer-relationship-management software. Declining near-field-communication chipset prices, tougher corporate sustainability mandates, and the normalization of hybrid work are accelerating adoption. The availability of scalable progressive web app architectures further lowers deployment costs, while enhanced privacy frameworks, such as the California Consumer Privacy Rights Act, help sustain confidence in data handling. As a result, vendors that combine seamless user experience with rigorous compliance are capturing the strongest demand signals.
Key Report Takeaways
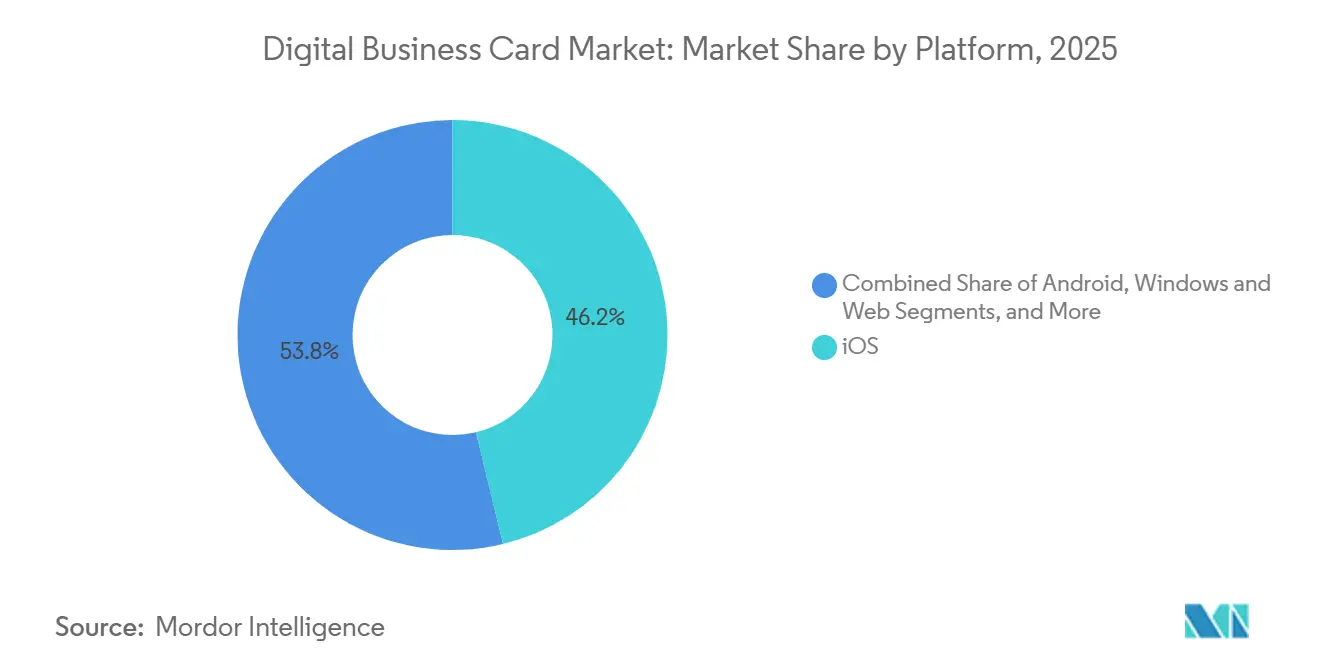
- By platform, iOS captured 46.23% of the digital business card market share in 2025; the digital business card market size for progressive web apps is set to expand at a 9.11% CAGR to 2031.
- By user type, small and medium-sized enterprises held 38.51% of the digital business card market share in 2025; the digital business card market size for academia and non-profits is forecast to rise at a 10.48% CAGR through 2031.
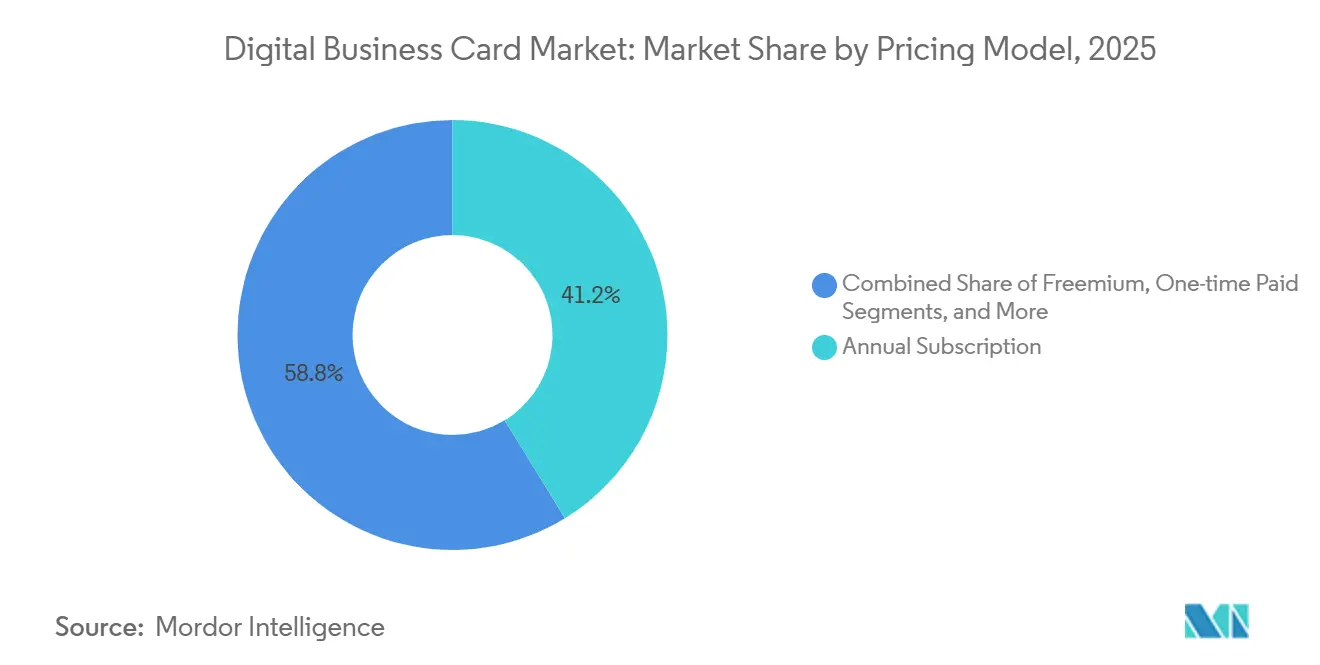
- By pricing model, annual subscriptions accounted for 41.23% of the digital business card market share in 2025; the digital business card market size for freemium plans is projected to climb at a 10.66% CAGR during 2026-2031.
- By industry vertical, information technology and software commanded 29.46% of the digital business card market share in 2025; the digital business card market size for healthcare is expected to grow at a 9.27% CAGR to 2031.
- By geography, North America commanded 35.17% of the digital business card market share in 2025; the digital business card market size for Asia Pacific is expected to grow at a 10.43% CAGR to 2031.
Note: Market size and forecast figures in this report are generated using Mordor Intelligence’s proprietary estimation framework, updated with the latest available data and insights as of January 2026.
Global Digital Business Card Market Trends and Insights
Driver Impact Analyis*
| Driver | (~) % Impact on CAGR Forecast | Geographic Relevance | Impact Timeline |
|---|---|---|---|
| Rising Demand for Contact-Free Networking | +1.8% | Global, highest in North America and Europe | Short term (≤ 2 years) |
| Sustainability and Paper-Waste Reduction Mandates | +1.5% | Europe and North America, expanding across the Asia Pacific | Medium term (2-4 years) |
| Exploding Smartphone and Mobile-App Penetration | +2.1% | Core Asia Pacific, spillover to the Middle East and Africa | Medium term (2-4 years) |
| Remote and Hybrid Workforce Dynamics | +1.6% | Global, concentrated in urban North America, Europe, Asia | Short term (≤ 2 years) |
| Declining NFC Chipset and Printing Costs | +1.2% | Global, manufacturing base in Asia Pacific | Long term (≥ 4 years) |
| Blockchain-Verified Credentials for Trust | +0.9% | Early adopters in North America and Europe | Long term (≥ 4 years) |
| Source: Mordor Intelligence | |||
Rising Demand for Contact-Free Networking
Public-health protocols that popularized QR-code and NFC tap interactions now underpin a permanent shift toward contactless professional exchanges. Trade-show and conference organizers report that digital-card scans cut contact-capture latency by about 70%, freeing staff to focus on higher-value engagement. Parallel corporate mandates for real-time CRM synchronization ensure that every scan immediately feeds pipeline analytics, elevating the solution from hygiene measure to productivity asset. Employee surveys show broader comfort with digital-first workflows, reflecting the mainstreaming of artificial-intelligence productivity tools.[1]Source: Owl Labs, “State of Hybrid Work 2025,” owllabs.com Taken together, hygienic preference and operational efficiency lock in sustained demand for contact-free solutions across regions and sectors.
Sustainability and Paper-Waste Reduction Mandates
The European Union’s Corporate Sustainability Due Diligence Directive requires large companies to track and mitigate marketing-material waste, pushing multinationals to rethink printed collateral.[2]Source: European Commission, “Corporate Sustainability Due Diligence Directive,” ec.europa.eu Digital business cards eliminate roughly 88% of the lifecycle carbon footprint tied to offset-printed stock, turning compliance into a visible win for corporate brand stewards. Millennials and Generation Z consumers now weigh sustainability credentials in 60% of purchase decisions, making waste abatement an indirect sales lever. The forthcoming Digital Product Passport rules, due in 2027, will extend traceability obligations to professional services firms, embedding digital identity into standard audit workflows. As investors link executive compensation to sustainability metrics, paperless networking shifts from optional initiative to fiduciary necessity.
Exploding Smartphone and Mobile-App Penetration
India surpassed 650 million smartphone users in 2025, while the Unified Payments Interface processed 116 billion transactions in the same fiscal year, validating nationwide readiness for mobile-centric identity services. In China, digital wallets facilitated 82% of e-commerce checkouts, normalizing app-based interactions. These milestones lower onboarding friction; users already possess capable hardware, connectivity, and behavioral familiarity. Progressive web apps further democratize access by sidestepping app-store gatekeepers and requiring minimal storage, a benefit in entry-level device markets. As handset penetration climbs across Southeast Asia and Africa, a virtuous cycle of adoption emerges that disproportionately lifts the digital business card market.
Remote and Hybrid Workforce Dynamics
Hybrid schedules covered 52% of remote-capable U.S. employees in 2025, and 88% of employers offered flexible options.[3]Source: Wave Connect, “Hybrid Work Statistics 2025,” wave.co Fewer spontaneous office meetings raise the stakes for digital introductions that work equally well in virtual and in-person settings. Video-conference platforms offer basic card swaps, yet sales teams increasingly prefer dedicated solutions that provide analytics and CRM hooks. The abandonment of complex room-based video gear, after 77% of users cited productivity loss from setup hassles, shines a spotlight on mobile-native tools that operate independently of meeting hardware. Since hybrid work is now a strategic staple, demand for frictionless networking will remain resilient through the forecast horizon.
Restraint Impact Analysis*
| Restraint | (~) % Impact on CAGR Forecast | Geographic Relevance | Impact Timeline |
|---|---|---|---|
| Data-Privacy and Cyber-Security Concerns | -1.4% | Global, the highest in Europe and North America | Short term (≤ 2 years) |
| Limited Awareness Among Micro-Enterprises | -0.9% | Emerging Asia Pacific, Middle East and Africa, Latin America | Medium term (2-4 years) |
| Tightening Ad-Tracking and Consent Rules | -0.7% | Europe and North America | Medium term (2-4 years) |
| Cross-Platform UX Fragmentation in Emerging Markets | -0.6% | Asia Pacific, the Middle East, and Africa | Long term (≥ 4 years) |
| Source: Mordor Intelligence | |||
Data-Privacy and Cyber-Security Concerns
The California Consumer Privacy Rights Act introduced a delete-on-request preference in 2026, forcing platforms to erase records within 15 days of an automated signal. European regulators have levied more than EUR 4 billion (USD 4.69 billion) in General Data Protection Regulation fines through 2025, underscoring strict enforcement. Digital business card vendors that store contact details, metadata, and behavioral logs now face advanced credential-stuffing attacks. Regulated buyers in banking and healthcare demand Security Operations Center 2 Type II attestations and signed Business Associate Agreements before purchase approval. Smaller suppliers lacking dedicated security teams struggle to pass audits, slowing market diffusion and nudging share toward well-capitalized incumbents.
Limited Awareness Among Micro-Enterprises
Firms with fewer than 10 employees remain under-represented in adoption despite being a sizable addressable pool. Organization for Economic Co-operation and Development surveys found that 70% of small and medium-sized enterprises increased digital engagement after 2020, yet only 40% sustained investment due to skills gaps and financing limits. Freemium tiers ease cost anxiety, but set-up friction and unclear return on investment deter experimentation. Research on freemium conversion shows that user needs fit and perceived value drive upgrades, metrics that inexperienced owners struggle to quantify. Reliance on urban distributor networks leaves rural micro-enterprises underserved, elongating the market’s education curve.
*Our forecasts treat driver/restraint impacts as directional, not additive. The impact forecasts reflect baseline growth, mix effects, and variable interactions.
Segment Analysis
By Platform: Progressive Web Apps Challenge Native Dominance
Progressive web apps are forecast to expand at a 9.11% CAGR from 2026 to 2031, the fastest rate within the platform segment. In contrast, iOS retained 46.23% revenue share in 2025, underscoring current dominance yet hinting at shifting preferences in the digital business card market. Enterprises view progressive web apps as strategic hedges against operating-system lock-in because they slash total cost of ownership by up to 50% and enable offline functionality through service workers. Twitter Lite, Flipkart, and Pinterest reported 60-70% engagement lifts after adoption, evidence that performance no longer favors native code exclusively.
The total-cost edge resonates in price-sensitive geographies where Android fragmentation complicates maintenance schedules. Browser-level standards such as Web Authentication API and Payment Request API continue to narrow the feature gap, while antitrust scrutiny of proprietary app stores reinforces the case for platform-agnostic delivery. As these dynamics evolve, the digital business card market will likely see progressive web apps capture a growing share of incremental deployments, even as iOS and Android continue to command the bulk of legacy installs.


By User Type: Academia and Non-Profit Users Gain Ground
Small and medium-sized enterprises captured 38.51% of the digital business card market share in 2025 by pairing mobile cards with CRM dashboards that cut manual data entry. Yet academia and non-profit organizations are projected to grow at a 10.48% CAGR to 2031, reflecting cultural commitments to data sovereignty and open standards. Universities piloting Hyperledger-based credentials see blockchain as a bulwark against résumé fraud, while professional societies adopt platform-cooperative governance models that return control to members.
Skill gaps and constrained budgets hamper micro-enterprise uptake, whereas campus IT teams and non-profit consortiums often receive dedicated grants for digital-identity pilots. As these institutions publish open-source toolkits, downstream awareness spreads to adjacent sectors, reinforcing momentum. Over the forecast window, academic and mission-driven buyers will serve both as reference customers and as advocacy hubs, accelerating broad adoption across the digital business card industry.
By Pricing Model: Freemium Adoption Accelerates
Annual subscriptions accounted for 41.23% of segment revenue in 2025, reflecting enterprise budgeting cycles that favor predictable spend. However, freemium plans are expected to post a 10.66% CAGR from 2026 to 2031, the swiftest ascent among pricing tiers. Providers use zero-cost entry to build network effects, then monetize premium layers involving CRM hooks, analytics, and custom branding. Empirical models find standardized coefficients of 0.17-0.23 linking perceived value to upgrade intent, explaining up to 53% of variance in conversion.
Seasonal consultants gravitate towards monthly plans, while procurement-restricted entities prefer one-time licenses even at a higher upfront cost. The surging freemium tier compresses average selling prices in commodity feature sets, pushing vendors to differentiate through vertical templates, white-label portals, and open APIs. Over time, competitive pressure may shift revenue reliance toward usage-based metrics such as real-time sync frequency, adding nuance to the digital business card market’s pricing palette.
By Industry Vertical: Healthcare Growth Outpaces Early Adopters
Information technology and software firms accounted for 29.46% of the digital business card market in 2025, a testament to early-adopter instincts. Yet healthcare is on track to expand at a 9.27% CAGR through 2031, the highest among verticals. Multi-site clinical networks now demand Health Insurance Portability and Accountability Act (HIPAA)-compliant contact exchange, including encryption, audit trails, and signed Business Associate Agreements. Telemedicine providers use digital cards to verify practitioners' identities, speeding credential checks and reducing badge-printing waste.
Marketing teams lean on digital cards for campaign attribution, while banks and insurers require Security Operations Center 2 Type II attestations for procurement approval. Government uptake trails due to lengthy tender cycles, though smart-city pilots hint at future demand. The convergence of telehealth, regulatory compliance, and sustainability goals positions healthcare as a pivotal catalyst for future revenue growth in the digital business card market.
Geography Analysis
North America secured 35.17% of 2025 revenue, anchored by enterprises that mandate Security Operations Center 2 Type II reports and compliance with the California Consumer Privacy Rights Act. Uptake is most pronounced in technology, professional services, and financial services clusters, where CRM penetration exceeds 80%. The United States commands regional leadership, Canada enjoys robust demand from federal digital-identity programs, and Mexico’s outsourcing hubs are early adopters despite the urban concentration of awareness. Ongoing state-level privacy statutes are expected to intensify vendor certification requirements, reinforcing the region’s emphasis on security credentials.
Asia Pacific is forecast to register the fastest worldwide CAGR of 10.43%. India’s UPI network, handling 116 billion payments in fiscal 2025, illustrates the infrastructure readiness underpinning mobile identity. China’s 82% share of e-commerce transactions through digital wallets further normalizes app-based exchanges. Japan’s Sansan posted JPY 43 billion (USD 300.7 million) fiscal-year 2024 revenue with 0.49% churn, showcasing customer stickiness in cultures that value meticulous contact management. South Korea and Australia leverage high 5G coverage to propel NFC tap interactions, while device diversity in Southeast Asia favors progressive web apps optimized for low-bandwidth environments.
Europe maintains a substantive position thanks to stringent General Data Protection Regulation controls and the Corporate Sustainability Due Diligence Directive’s waste-reduction mandate. Germany, the United Kingdom, France, and Italy dominate adoption in manufacturing and consulting, whereas Spain’s and Russia’s preference for on-premise solutions tempers growth. South America’s momentum centers on Brazil and Argentina, though currency volatility constrains enterprise spending. Gulf Cooperation Council members invest heavily in smart-city frameworks that bake business-card functionality into e-government platforms, while Africa’s pilot projects in South Africa, Nigeria, and Kenya signal long-term potential despite prevailing infrastructure gaps.


Competitive Landscape
The digital business card market remains moderately fragmented. Adobe and Canva embed card generators into broader creative suites, using established user bases to cross-sell identity tools. Adobe Express added generative artificial intelligence functionality in October 2025, automating branded card creation and previewing a future where design and identity converge seamlessly. Canva’s February 2025 Typecard integration funnels contact details into Apple and Google wallets, making card sharing a one-click experience within its design workflow.
Specialist vendors such as Sansan, Mobilo, and HiHello differentiate through deep CRM integrations, vertical templates, and notably low churn rates. Sansan’s 0.49% fiscal-year 2024 churn underscores the retention power of enterprise-oriented feature depth, while Mobilo’s artificial-intelligence lead-scoring engine highlights the push toward data-driven sales enablement. Hardware innovators add another layer. STMicroelectronics’ ST25TA-E NFC chip blends tamper detection with secure-element functions, enabling hybrid physical-digital solutions that serve events and regulated sectors simultaneously.
Price competition intensifies as freemium tiers proliferate, prompting vendors to focus on compliance certifications, analytics sophistication, and open APIs as durable moats. Regulatory changes such as the European Union’s forthcoming Digital Product Passport are expected to widen the gulf between compliant, well-financed providers and smaller rivals unable to shoulder audit costs. Consequently, partnership activity is rising, with design platforms, CRM suppliers, and security firms jockeying to embed card functionality as a sticky layer within their ecosystems.
Digital Business Card Industry Leaders
HiHello Inc.
Mobilo Inc.
CamCard (IntSig Information Co., Ltd.)
Popl Inc.
Blinq Technologies Pty Ltd
- *Disclaimer: Major Players sorted in no particular order

Recent Industry Developments
- October 2025: Adobe released business-to-business artificial-intelligence agents in Adobe Express that automate virtual card design workflows, scaling brand-consistent assets across distributed teams.
- February 2025: Canva introduced Typecard functionality, enabling direct export of card details to Apple Wallet and Google Wallet for frictionless sharing.
- February 2025: ToneTag secured USD 78 million to expand sound-wave and NFC-based payment infrastructure that underpins contactless exchange services.
- January 2024: Beaconstac rebranded to Uniqode, broadening its mandate to include product authentication and asset tracking alongside business cards.


Research Methodology Framework and Report Scope
Market Definitions and Key Coverage
Our study defines the digital business card market as all subscription-based and one-time fee services that let users create, store, and exchange contact profiles on smartphones, wearables, or web portals; the valuation is expressed in USD revenue generated by software licenses, in-app purchases, and associated cloud hosting. We also trace platform, user type, pricing model, vertical, and regional patterns so decision-makers see the full revenue canvas we analyze.
Scope exclusion: this assessment leaves out standalone NFC tags, printable QR kits sold without a linked software account, and any physical paper card services.
Segmentation Overview
- By Platform
- Android
- iOS
- Windows and Web
- Cross-Platform Progressive Web Apps
- By User Type
- Individual Professionals
- SME Business Users
- Large-Enterprise Users
- Academia and Non-Profit Users
- By Pricing Model
- Freemium
- One-Time Paid
- Monthly Subscription
- Annual Subscription
- By Industry Vertical
- IT and Software
- Marketing and Media
- BFSI
- Healthcare
- Education
- Government and Public Sector
- Other Industry Verticals
- By Geography
- North America
- United States
- Canada
- Mexico
- South America
- Brazil
- Argentina
- Rest of South America
- Europe
- Germany
- United Kingdom
- France
- Italy
- Spain
- Rest of Europe
- Asia-Pacific
- China
- India
- Japan
- South Korea
- Australia and New Zealand
- Rest of Asia-Pacific
- Middle East
- Saudi Arabia
- United Arab Emirates
- Turkey
- Rest of Middle East
- Africa
- South Africa
- Nigeria
- Egypt
- Rest of Africa
- North America
Detailed Research Methodology and Data Validation
Primary Research
Mordor analysts interviewed SaaS founders, independent sales consultants, HR onboarding leads, and IT buyers across North America, Europe, and Asia-Pacific. These conversations, along with short online surveys sent to micro-entrepreneurs and marketing agencies, filled data gaps on churn rates, average selling prices, and feature tier migration that raw desk work rarely reveals.
Desk Research
We started with publicly available datasets such as GSMA mobile subscriber counts, World Bank SME registries, and regional ICT adoption indices, which anchor user pools and spending potential. Trade association briefs from the Interactive Advertising Bureau, App Annie trend dashboards, and patent filings on digital identity sharing gave additional technology diffusion clues that shaped adoption curves. Our team then tapped paid repositories, D&B Hoovers for company financial splits, Dow Jones Factiva for funding rounds, and Questel for innovation density, to sense check revenue plausibility against corporate disclosures. This mix of open and licensed sources creates a dependable factual spine; many more minor sources were also reviewed for validation and clarification.
Market-Sizing & Forecasting
The core model uses a top-down 'active user wallet' build, starting with smartphone workforce counts, applying region-wise penetration of digital cards, and layering calibrated average revenue per active profile. Select bottom-up checks, like sampled vendor revenue roll-ups and channel ASP × volume math, calibrate totals before final lock. Key variables include smartphone penetration growth, remote work prevalence, subscription renewal rates, freemium to paid conversion, and regional pricing ladders. A multivariate regression, combined with scenario analysis for data privacy regulation shifts, projects value through 2030; user-validated assumptions guard against optimism bias.
Data Validation & Update Cycle
Outputs pass three filters: automated anomaly scans, peer review by a senior analyst, and a reconciliation against recent funding news or M&A signals. The model refreshes every twelve months, with mid-cycle tweaks triggered by material events, ensuring clients always receive our most current view.
Why Our Digital Business Card Baseline Commands Reliability
Published numbers often diverge because firms pick different scopes, inflate adjacent hardware sales, or freeze currency at outdated rates. We clarify scope at the outset, normalize pricing tiers, and refresh annually, so our 2025 value of USD 199.28 million reflects today's market reality.
Benchmark comparison
| Market Size | Anonymized source | Primary gap driver |
|---|---|---|
| USD 199.28 Million (2025) | Mordor Intelligence | - |
| USD 215.13 Million (2025) | Global Consultancy A | Excludes freemium micro transactions and lacks pricing band normalization |
| USD 350.00 Million (2024) | Industry Association B | Adds NFC tag and print kit revenue, inflating addressable pool |
| USD 178.50 Million (2024) | Regional Consultancy C | Projects straight-line app downloads, omitting churn adjustments |
The comparison shows that scope creep, unvetted multipliers, or static growth lines can sway figures markedly; by contrast, Mordor's disciplined variable selection and cross-checks deliver a balanced, transparent baseline clients can replicate and trust.


Key Questions Answered in the Report
What is the current value of the digital business card market?
The digital business card market size stood at USD 217.04 million in 2026 and is on track to reach USD 331.78 million by 2031.
Which platform segment is growing the fastest?
Progressive web apps are expanding at a 9.11% CAGR through 2031, outpacing native iOS and Android applications.
Why is healthcare adopting digital business cards quickly?
Multi-site clinical networks require Health Insurance Portability and Accountability Act-compliant, auditable identity exchange, driving a 9.27% CAGR for healthcare deployments.
How do freemium pricing models influence market growth?
Freemium tiers attract cost-sensitive users, then monetize through premium CRM integrations and analytics, supporting a 10.66% CAGR for this segment.
Page last updated on:


