Utility Billing Software Market Size and Share
Market Overview
| Study Period | 2020 - 2031 |
|---|---|
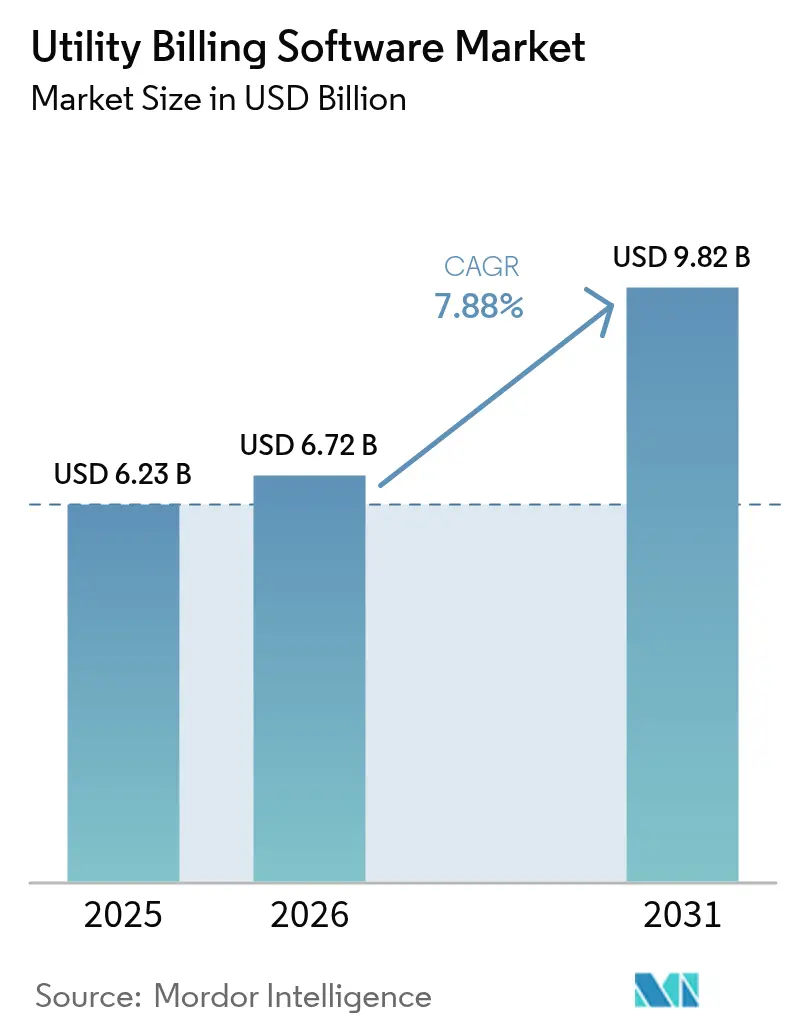
| Market Size (2026) | USD 6.72 Billion |
| Market Size (2031) | USD 9.82 Billion |
| Growth Rate (2026 - 2031) | 7.88% CAGR |
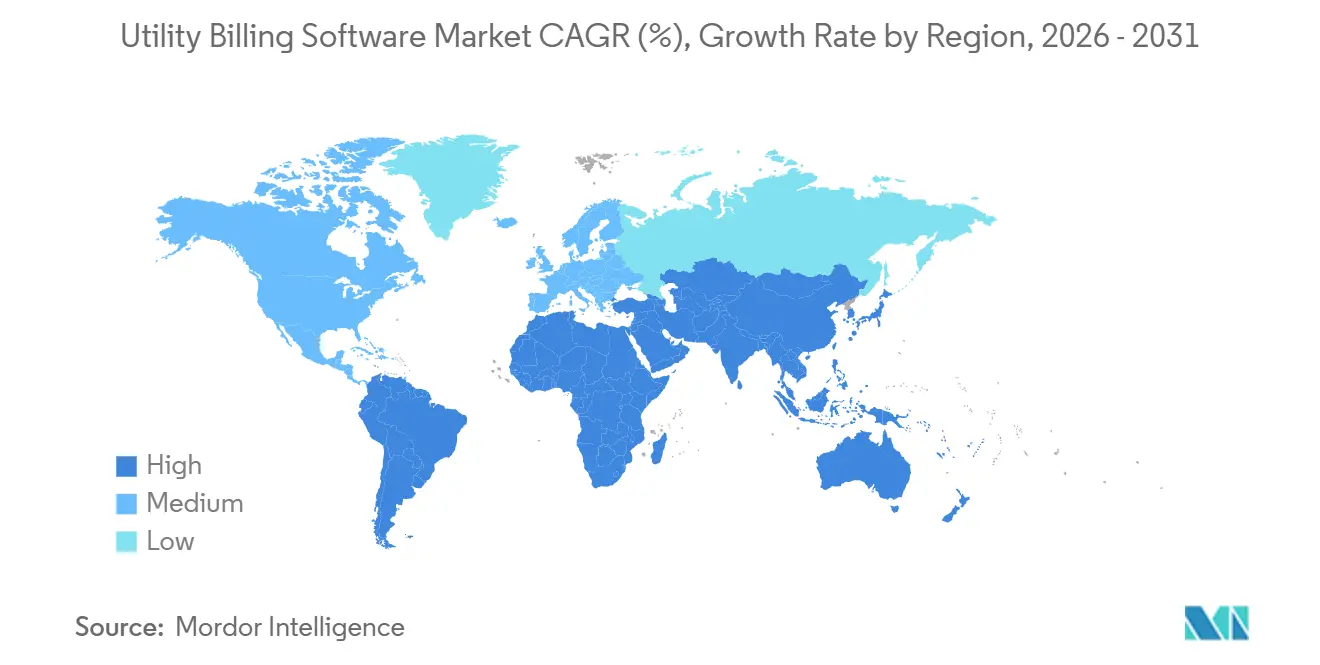
| Fastest Growing Market | Asia Pacific |
| Largest Market | North America |
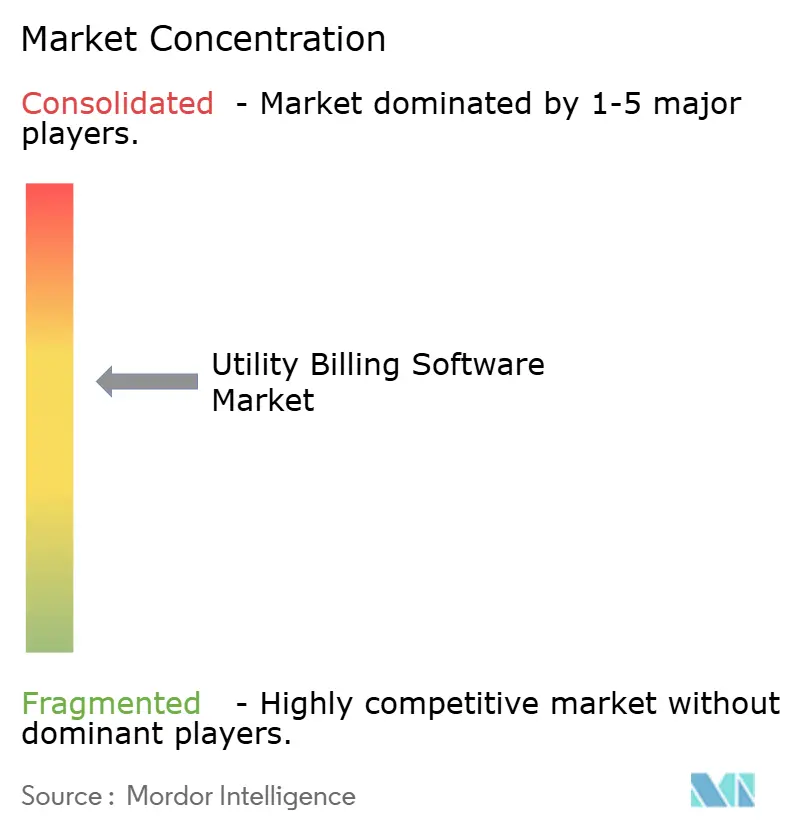
| Market Concentration | Medium |
Major Players *Disclaimer: Major Players sorted in no particular order Image © Mordor Intelligence. Reuse requires attribution under CC BY 4.0. | |
Utility Billing Software Market Analysis by Mordor Intelligence
The Utility billing software market size is projected to expand from USD 6.23 billion in 2025 to USD 6.72 billion in 2026 and reach USD 9.82 billion by 2031, registering a CAGR of 7.88% from 2026 to 2031. Cloud-native platforms, real-time settlement for distributed energy resources, and API-driven integrations are reshaping procurement criteria as utilities shift away from legacy mainframes. Demand for elastic compute during peak billing periods, coupled with mounting cybersecurity requirements, is accelerating adoption across investor-owned and municipal utilities alike. Vendors capable of embedding AI-driven anomaly detection and vehicle-to-grid settlement into core workflows are pulling ahead, while high integration costs delay adoption among smaller cooperatives.
Key Report Takeaways
- By deployment mode, cloud platforms led the utility billing software market with 58.24% market share in 2025; the same segment is forecast to expand at an 8.42% CAGR through 2031.
- By end-user industry, electricity and power distribution held a 49.19% of the utility billing software market share in 2025, while telecommunications operators are expected to grow fastest at an 8.89% CAGR to 2031.
- By utility type, electricity utilities accounted for 47.66% of the market share in 2025; district heating and cooling networks are projected to post the highest CAGR of 8.64% over the forecast period.
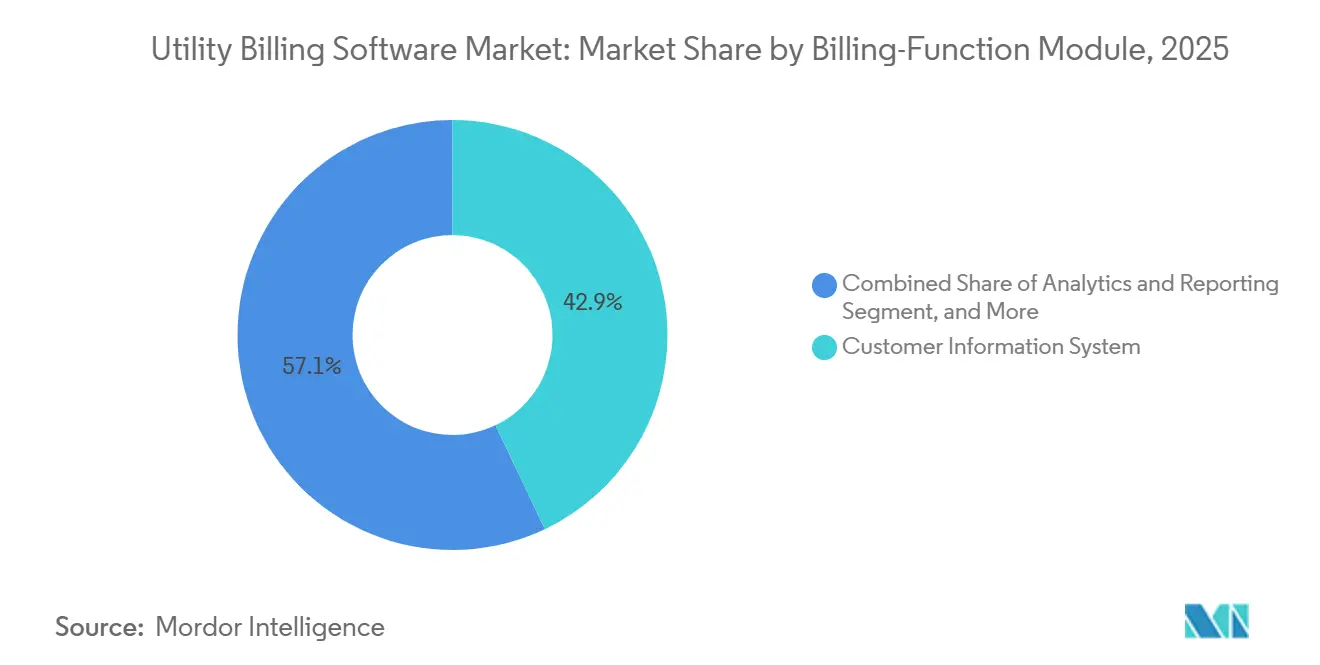
- By billing-function module, customer information systems captured a 42.93% share in 2025, whereas analytics and reporting modules posted the fastest 8.87% CAGR through 2031.
- By organisation size, investor-owned utilities dominated with a 54.89% share in 2025; private retail energy providers are anticipated to rise at an 8.47% CAGR during 2026-2031.
- By geography, North America commanded 36.73% of the revenue share in 2025, but Asia-Pacific is set to expand at the fastest 8.91% CAGR across the forecast window.
Note: Market size and forecast figures in this report are generated using Mordor Intelligence’s proprietary estimation framework, updated with the latest available data and insights as of 2026.
Global Utility Billing Software Market Trends and Insights
Drivers Impact Analysis*
| Driver | (~) % Impact on CAGR Forecast | Geographic Relevance | Impact Timeline |
|---|---|---|---|
| Growing Investment in Smart-Grid, AMI Roll-Outs | +2.1% | Asia-Pacific core, spillover to North America and Europe | Medium term (2-4 years) |
| Rapid Shift Toward Cloud-First Utility IT Architectures | +1.8% | Global, with concentration in North America and Europe | Short term (≤ 2 years) |
| Improvement in Legacy Billing Systems and IT Infrastructure | +1.5% | North America and Europe, emerging in Asia-Pacific | Long term (≥ 4 years) |
| Compliance Pressure for Itemised, Near-Real-Time Billing | +1.2% | North America and Europe regulatory jurisdictions | Medium term (2-4 years) |
| Rise of Prosumer and Vehicle-to-Grid Settlement Requirements | +0.9% | Europe and Asia-Pacific early adopters, North America following | Long term (≥ 4 years) |
| AI-Based Anomaly Detection Reducing Non-Technical Losses | +0.7% | Asia-Pacific and Middle East and Africa high-loss regions | Medium term (2-4 years) |
| Source: Mordor Intelligence | |||
Growing Investment in Smart Grid and AMI Roll-Outs
Massive smart-meter programs are overwhelming batch engines built for monthly reads, forcing utilities to replace them with cloud billing platforms. India’s Revamped Distribution Sector Scheme earmarked INR 3.03 trillion (USD 36.4 billion) to deploy 250 million smart meters by fiscal 2025-26, triggering tenders that demand 48-hour bill generation for interval data. Tokyo Electric Power Company finished rolling out 29 million meters and paired them with Oracle Meter Data Management to process voltage analytics that its legacy system could not handle.[1]Tokyo Electric Power Company, “Smart Meter Roll-Out Progress,” tepco.co.jp The U.S. Department of Energy set aside USD 2 billion for grid-modernization projects that integrate AMI with distributed-energy-resource settlement. Korea Electric Power Corporation completed 22 million smart-meter installations, enabling pilots that credit electric-vehicle owners for grid-stabilization services. These deployments compress billing cycles from 30 days to near real-time, accelerating demand for scalable, cloud-native software.
Rapid Shift Toward Cloud-First Utility IT Architectures
Utilities are abandoning on-premise mainframes to cut CapEx, scale compute on demand, and accelerate tariff launches. Oracle Utilities Customer Cloud now processes more than 300 million accounts worldwide, reducing regression-testing windows for rate updates from 6 months to 72 hours. Cobb County, Georgia, completed its cloud migration in eight months, cutting billing disputes by 40% and enabling same-day rate changes. CPS Energy committed USD 304 million to a cloud-native CIS that aims to deliver 15-minute billing for 900,000 electric and gas accounts and direct integration with rooftop solar and EV chargers.[2]CPS Energy, “Customer Information System Transformation,” cpsenergy.com Hybrid models that keep customer master data on-site while offloading analytics to the cloud help municipal utilities satisfy data-residency requirements without delaying modernization.
Improvement in Legacy Billing Systems and IT Infrastructure
Mainframe support sunsets and real-time billing mandates expose the technical debt of COBOL engines and dBase customer files. Boston Water and Sewer Commission began replacing a 25-year-old platform that could not parse ultrasonic meter reads or comply with Massachusetts itemization rules. Greeley, Colorado, slashed its billing cycle from 12 days to 3 days after unifying electric, water, and wastewater accounts on a modern platform. Dayton, Ohio, issued an RFP for a cloud system because its legacy engine lacked APIs for third-party payment processors and required manual reconciliation of 80,000 accounts. As more vendors drop support for outdated operating systems, upgrade projects that once seemed optional have become unavoidable to maintain regulatory compliance and service reliability.
Compliance Pressure for Itemized, Near-Real-Time Billing
Regulators now demand granular cost disclosure that legacy batch systems cannot deliver. Colorado requires investor-owned utilities to show separate charges for generation, transmission, distribution, and renewable compliance within 24 hours of consumption, compelling Xcel Energy to overhaul its billing engine. Oregon mandates customer web access to 15-minute interval data, driving Portland General Electric to integrate cloud engagement tools.[3]Oregon Public Utility Commission, “Data Access and Billing Requirements,” oregon.gov/puc Connecticut requires disclosure of electricity carbon intensity on monthly bills, linking billing systems to ISO New England emissions APIs. Pennsylvania’s Act 129 adds demand-response credits to bills, requiring hourly load calculations for 600,000 accounts at Duquesne Light. These rules fuel investment in analytics modules that automate compliance and reduce penalty risk.
Restraints Impact Analysis*
| Restraint | (~) % Impact on CAGR Forecast | Geographic Relevance | Impact Timeline |
|---|---|---|---|
| High Upfront Integration and Data-Migration Costs | -1.3% | Global, acute in municipal and cooperative utilities | Short term (≤ 2 years) |
| Escalating Cyber-Security and Data-Privacy Risks | -0.9% | Global, regulatory pressure in North America and Europe | Medium term (2-4 years) |
| Digital-Skills Gap at Small and Mid-Size Utilities | -0.7% | North America and Europe rural cooperatives, Asia-Pacific tier-2 cities | Long term (≥ 4 years) |
| Workforce Resistance from Unionised Meter-Reading Staff | -0.4% | North America and Europe unionized jurisdictions | Medium term (2-4 years) |
| Source: Mordor Intelligence | |||
High Upfront Integration and Data-Migration Costs
Data cleansing and interface development consume up to 60% of CIS project budgets, delaying modernizations at cash-constrained utilities. CPS Energy allocated USD 120 million of its USD 304 million transformation simply to reconcile 900,000 duplicated or orphaned customer records across 100 systems. Consulting firm Conduit LLC estimates utilities serving 500,000 accounts spend USD 15-25 million to integrate billing with AMI, OMS, GIS, and CRM platforms, stretching timelines by 12-18 months. Municipal cooperatives often defer upgrades because rate-case approvals cap annual increases at 3-5%, insufficient to amortize the debt required for USD 20 million projects. Vendors’ minimum license fees of USD 1-2 million per year further deter small utilities, keeping per-account costs above industry benchmarks.
Escalating Cyber-Security and Data-Privacy Risks
Billing databases store personally identifiable information, payment data, and usage patterns that attract ransomware gangs and nation-state actors. American Water Works suffered an October 2024 attack that halted billing for 14 million customers across 14 states for six weeks and forced manual reconciliation of 2 million accounts. CISA warnings in 2025 highlighted how compromised CIS credentials can serve as beachheads for attacks on operational-technology networks. GDPR breach-notification rules require utilities to report incidents within 72 hours, adding USD 2-5 million in compliance costs for European deployments. Rising insurance premiums and the threat of regulatory fines push utilities toward cloud providers that offer managed security, even as shared-responsibility models keep ultimate liability with the utility.
*Our forecasts treat driver/restraint impacts as directional, not additive. The impact forecasts reflect baseline growth, mix effects, and variable interactions.
Segment Analysis
By Deployment Mode: Cloud Platforms Outpace On-Premise Systems
Cloud deployments commanded 58.24% of the utility billing software market share in 2025 and are projected to grow at an 8.42% CAGR through 2031, steadily eroding the footprint of on-premises and hybrid installations. Investor-owned utilities are accelerating migrations to avoid hardware refresh cycles, while municipal cooperatives retain legacy servers only where data-residency rules prohibit cross-border transfers. Consumption-based pricing allows CFOs to shift capital spending to operating budgets, and service-level agreements now guarantee sub-second rating during peak cycles. Hybrid models that keep the customer master on site but push analytics to the cloud are a transitional step, yet even those projects shrink from 24-month timelines to fewer than nine months as vendors pre-configure rate templates and API connectors.
Cobb County finished an eight-month Oracle Customer Cloud roll-out that cut billing disputes by 40% and enabled same-day tariff refreshes, a speed impossible on its retired mainframe. CPS Energy’s USD 304 million project targets 900,000 accounts with 15-minute settlement for rooftop solar and electric-vehicle loads, illustrating how elastic compute supports emerging use cases. European utilities continue to test sovereign clouds that meet GDPR Article 44 requirements, but early pilots show the operating-cost delta narrowing as hyperscalers localize data centers. Vendors that combine infrastructure, application management, and cybersecurity monitoring in a single contract are winning the bulk of greenfield awards, pushing the total utility billing software market for cloud solutions to a new high each year.


By End-User Industry: Telecommunications Operators Drive Convergence
Electricity and power distributors remained the largest buyers, accounting for 49.19% of the utility billing software market in 2025, yet growth momentum has shifted to telecommunications operators, which are expanding at an 8.89% CAGR. Telcos integrate energy resale, broadband, and electric-vehicle charging in a single invoice, lowering churn and boosting average revenue per user. Their real-time charging engines already rate 5G traffic at millisecond latency, so layering interval energy data is an incremental cost rather than a wholesale rebuild. Water and gas utilities are trailing but catching up as ultrasonic and pressure sensors generate interval data streams that demand modern meter-data management.
Convergent stacks such as Amdocs, ComverseONE, and Ericsson Charging process both kilowatt-hours and gigabytes in the same rating engine, allowing telcos to undercut traditional utilities on customer-acquisition cost. Municipal utilities are responding by consolidating electric, water, and wastewater billing onto a single platform to unlock cross-commodity discounts. The Boston Water and Sewer Commission’s 2025 upgrade unified 250,000 water accounts with new leak-detection analytics, reducing call-center volumes by 18% during the first quarter of operation. As cross-industry boundaries blur, vendors that expose open APIs and TM Forum–compliant product catalogs are best positioned to capture wallet share.
By Utility Type: District Heating Networks Accelerate Digital Settlement
Electricity utilities held 47.66% of the utility billing software market share in 2025, but district heating and cooling networks are advancing at an 8.64% CAGR, the fastest rate among all utility classes. European energy-efficiency directives require heat-cost allocation based on interval data rather than annual manual reads, pushing operators toward cloud platforms that ingest Nord Pool spot prices. Settlement engines now merge outdoor temperature, occupancy, and flow-meter readings to apportion costs at the apartment level, unlocking new conservation incentives for landlords and tenants alike.
Cegal Energy Settlement and Zero Friction Solutions dominate Scandinavian tenders, while German provider Comgy migrated 1 million meters to a multi-tenant platform to satisfy monthly feedback mandates. Danfoss Leanheat analytics, deployed by Enercity, reduced heat losses by 5-10% through optimized boiler schedules, delivering tangible ROI within one heating season. Water utilities are similarly shortening read cycles to bi-weekly AMI intervals, and gas distributors must now track hydrogen and renewable-gas blends, tasks that legacy CIS code cannot perform. The widening functional gap explains why the utility billing software market size for niche district-energy modules is rising faster than for generic electric use cases.
By Billing-Function Module: Analytics Surpass Core CIS Spend
Customer information systems still accounted for 42.93% of 2025 revenue, yet analytics and reporting modules are growing at an 8.87% CAGR as regulators insist on 24-hour transparency. Utilities use consumption dashboards to flag tamper events, generate conservation nudges, and automate demand-response payouts, functions that core CIS code rarely handles well. EnergyCAP’s SmartAnalytics normalizes weather to help enterprises compare multi-site portfolios, while Oracle Opower personalizes savings tips that cut residential load by up to 3%.
Machine-learning-ready meter-data management is converging with analytics. Siemens Gridscale X ships with 70+ theft-detection models and has reduced non-technical losses up to 25% in early deployments. ArcOne Exceptions360 automates exception handling across meter reads, billing, and payments, shrinking revenue-leak windows from weeks to hours. Payment-processing add-ons now integrate with fintech wallets, cutting days sales outstanding by 2 weeks in low-income territories. As utilities move from batch billing to real-time settlement, spend shifts toward modular analytics layers that can iterate faster than monolithic CIS platforms.
By Organisation Size: Private Retailers Embrace White-Label SaaS
Investor-owned utilities controlled 54.89% of the utility billing software market share in 2025, thanks to multi-year enterprise agreements with Oracle and SAP, yet private retail energy providers are expanding at an 8.47% CAGR by adopting consumption-priced SaaS models. White-label platforms let newcomers launch dynamic import-export tariffs in minutes, side-stepping the 18-month projects typical of legacy CIS migrations. Enerim’s real-time invoicing tools allow Finnish retailers to bill electricity every hour, an innovation that boosts cash flow and customer engagement.
Conversely, municipal and cooperative utilities postpone upgrades because minimum license fees of USD 1-2 million yield per-account costs that exceed industry norms. Tyler Technologies and Harris Computer still host 62% of U.S. municipal instances on premises, bound by 15-year amortization schedules that deter early retirement. Greeley, Colorado, broke that mold by cutting its billing cycle to three days after moving 80,000 accounts onto a unified platform. As cyber-insurance premiums rise and regulatory reporting grows more complex, even the smallest utilities are reassessing the total cost of ownership, signaling incremental upside for SaaS vendors across the long tail of the market.
Geography Analysis
North America accounted for 36.73% of the utility billing software market in 2025, reflecting strong capital commitments from investor-owned utilities, which have budgeted USD 208 billion for grid modernization through 2030. Municipal utilities temper the region’s growth because 62% of them still operate on-premise systems with 15-year amortization schedules, which slows cloud migration. Regulators in Colorado, Oregon, and Connecticut now mandate 24-hour itemized billing, so spending is shifting toward analytics add-ons that retrofit compliance without requiring a full CIS replacement. The utility billing software market share for cloud deployments in the United States is therefore rising fastest among small and mid-size cities that can bypass mainframe refresh cycles with subscription pricing.
Asia-Pacific is the fastest-growing region, projected to advance at an 8.91% CAGR through 2031. India’s Revamped Distribution Sector Scheme allocates INR 3.03 trillion (USD 36.4 billion) to install 250 million smart meters by fiscal 2025-26, creating a surge in demand for multi-tenant billing platforms capable of processing 10 terabytes of daily reads. Tata Power-DDL has already connected 1.7 million Landis+Gyr OpenWay Riva meters to Oracle Meter Data Management, while Adani Energy Solutions plans to scale from 3.1 million to 12 million meters by 2028. Fluentgrid, Secure Meters, and Genus Power collectively won a USD 3.6 billion tender in Uttar Pradesh that requires 48-hour billing after each interval read. China’s State Grid has passed 500 million smart meters and now settles electric-vehicle charging and rooftop solar generation in real time, setting a performance benchmark for the region.
Europe maintains steady momentum as the European Union targets 80% residential smart-meter coverage by 2030. GDPR compliance adds USD 2-5 million to each multi-country deployment because utilities must pseudonymize customer data and provide 72-hour breach notifications. District-heating operators in Germany, Sweden, and Finland are digitizing settlement to meet monthly feedback mandates, which lifts demand for specialized billing engines that parse Nord Pool spot prices. In emerging markets such as Malaysia, analytics modules that flag non-technical losses recovered USD 9.2 million across 5,133 theft cases between 2021 and 2025, proving ROI for revenue-protection investments. These dynamics keep the utility billing software market share in Europe stable while allowing the Middle East and Africa, and South America to adopt proven templates without first-mover risk.

Competitive Landscape
Oracle, SAP, and Hansen Technologies together held about 45% of investor-owned utility contracts in 2025, anchoring the incumbents’ position with multi-year enterprise agreements. Their installed bases exceed 100 million endpoints, yet maintenance renewals face pushback because utilities now demand vehicle-to-grid settlement, AI anomaly detection, and RESTful APIs that legacy suites cannot easily deliver. Oracle added machine-learning theft-detection models to Meter Data Management in July 2025, and Siemens Gridscale X responded with 70 revenue-protection algorithms that reduce non-technical losses by up to 25%.
Cloud-native challengers are winning greenfield bids, especially in Asia-Pacific, where VertexOne, Fluentgrid, and Bynry capture 40-60% of new smart-meter projects by offering consumption-based pricing and eight-month implementation timelines. Cegal and Zero Friction dominate district-heating tenders with settlement engines that ingest hourly temperature and flow data, filling functional gaps left by enterprise CIS platforms. Amdocs and Ericsson leverage telecom billing expertise to converge broadband, energy, and EV charging on a single rating engine, enabling operators to cross-sell services and reduce churn.
Industry standards are shifting bargaining power. TM Forum’s Open Digital Architecture specifies modular APIs that let utilities swap components without a full rip-and-replace, eroding vendor lock-in. Regulatory scrutiny keeps large mergers rare, yet private-equity funds target SaaS vendors with 80-90% gross margins, driving a pipeline of minority investments rather than outright acquisitions. Cybersecurity risk shapes buying criteria as utilities prefer vendors that bundle managed detection and response, third-party penetration testing, and cyber-insurance endorsements. The resulting environment is moderately competitive, with incumbents defending maintenance revenue while specialists expand into high-growth niches.
Utility Billing Software Industry Leaders
Oracle Corporation
SAP SE
Hansen Technologies Limited
VertexOne, LLC
Tyler Technologies, Inc.
- *Disclaimer: Major Players sorted in no particular order

Recent Industry Developments
- January 2026: Oracle Corporation embedded predictive revenue-protection analytics into Oracle Revenue Management and Billing, targeting a 25-35% reduction in billing disputes for early adopters.
- December 2025: Uttar Pradesh Power Corporation Limited awarded a USD 3.6 billion smart-meter and head-end contract to Secure Meters, Genus Power, and Fluentgrid, mandating 48-hour billing for 30 million endpoints.
- November 2025: Tamil Nadu Generation and Distribution Corporation issued a USD 2.5 billion tender for 21 million smart meters with 10 terabytes of daily data throughput.
- October 2025: CPS Energy committed USD 304 million to a cloud-native CIS supporting 15-minute billing for 900,000 accounts and EV demand-response settlement.


Global Utility Billing Software Market Report Scope
The Utility Billing Software Market Report is Segmented by Deployment Mode (On-Premise, Cloud, Hybrid), End-User Industry (Water Utilities, Electricity and Power Distribution, Gas Utilities, Telecommunications, Multi-Service Municipal Utilities), Utility Type (Electricity, Water, Gas, District Heating and Cooling), Billing-Function Module (Customer Information System, Meter Data Management, Payment Processing and Collections, Analytics and Reporting, Tariff and Rate Management), Organisation Size (Investor-Owned Utilities, Municipal/Cooperative Utilities, Private Retail Energy Providers), and Geography (North America, South America, Europe, Asia-Pacific, Middle East and Africa). The Market Forecasts are Provided in Terms of Value (USD).
| On-Premise |
| Cloud |
| Hybrid |
| Water Utilities |
| Electricity and Power Distribution |
| Gas Utilities |
| Telecommunications |
| Multi-Service Municipal Utilities |
| Electricity |
| Water |
| Gas |
| District Heating and Cooling |
| Customer Information System |
| Meter Data Management |
| Payment Processing and Collections |
| Analytics and Reporting |
| Tariff and Rate Management |
| Investor-Owned Utilities |
| Municipal / Cooperative Utilities |
| Private Retail Energy Providers |
| North America | United States | |
| Canada | ||
| Mexico | ||
| South America | Brazil | |
| Argentina | ||
| Rest of South America | ||
| Europe | United Kingdom | |
| Germany | ||
| France | ||
| Italy | ||
| Rest of Europe | ||
| Asia Pacific | China | |
| Japan | ||
| India | ||
| South Korea | ||
| Rest of Asia Pacific | ||
| Middle East and Africa | Middle East | United Arab Emirates |
| Saudi Arabia | ||
| Rest of Middle East | ||
| Africa | South Africa | |
| Egypt | ||
| Rest of Africa | ||
| By Deployment Mode | On-Premise | ||
| Cloud | |||
| Hybrid | |||
| By End-User Industry | Water Utilities | ||
| Electricity and Power Distribution | |||
| Gas Utilities | |||
| Telecommunications | |||
| Multi-Service Municipal Utilities | |||
| By Utility Type | Electricity | ||
| Water | |||
| Gas | |||
| District Heating and Cooling | |||
| By Billing-Function Module | Customer Information System | ||
| Meter Data Management | |||
| Payment Processing and Collections | |||
| Analytics and Reporting | |||
| Tariff and Rate Management | |||
| By Organisation Size | Investor-Owned Utilities | ||
| Municipal / Cooperative Utilities | |||
| Private Retail Energy Providers | |||
| By Geography | North America | United States | |
| Canada | |||
| Mexico | |||
| South America | Brazil | ||
| Argentina | |||
| Rest of South America | |||
| Europe | United Kingdom | ||
| Germany | |||
| France | |||
| Italy | |||
| Rest of Europe | |||
| Asia Pacific | China | ||
| Japan | |||
| India | |||
| South Korea | |||
| Rest of Asia Pacific | |||
| Middle East and Africa | Middle East | United Arab Emirates | |
| Saudi Arabia | |||
| Rest of Middle East | |||
| Africa | South Africa | ||
| Egypt | |||
| Rest of Africa | |||


Key Questions Answered in the Report
How fast is Asia-Pacific expected to grow in utility billing software?
Asia-Pacific is projected to expand at an 8.91% CAGR through 2031, the fastest among all regions.
Which deployment mode is gaining the most share?
Cloud platforms led with 58.24% utility billing software market share in 2025 and maintain the highest growth at 8.42% CAGR.
Why are analytics modules outpacing core CIS investments?
Regulators now require itemized, near-real-time bills, so utilities invest in analytics and reporting modules growing at 8.87% CAGR.
What is the biggest cost barrier to modernization?
Data migration and system integration consume up to 60% of project budgets, adding USD 15-25 million for a utility serving 500,000 accounts.
How are telecom operators influencing the sector?
Convergent billing engines let telecoms bundle energy, broadband, and EV charging, driving an 8.89% CAGR in their spending segment.
Page last updated on:


