Cloud Billing Market Size and Share
Market Overview
| Study Period | 2020 - 2031 |
|---|---|
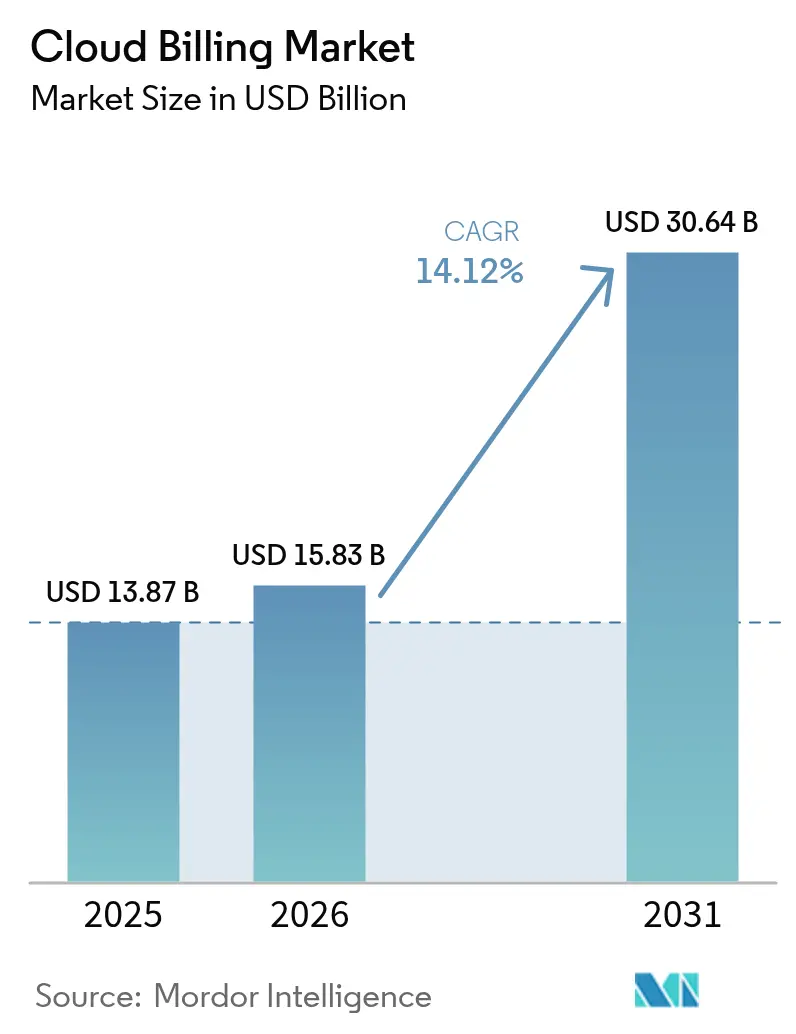
| Market Size (2026) | USD 15.83 Billion |
| Market Size (2031) | USD 30.64 Billion |
| Growth Rate (2026 - 2031) | 14.12% CAGR |
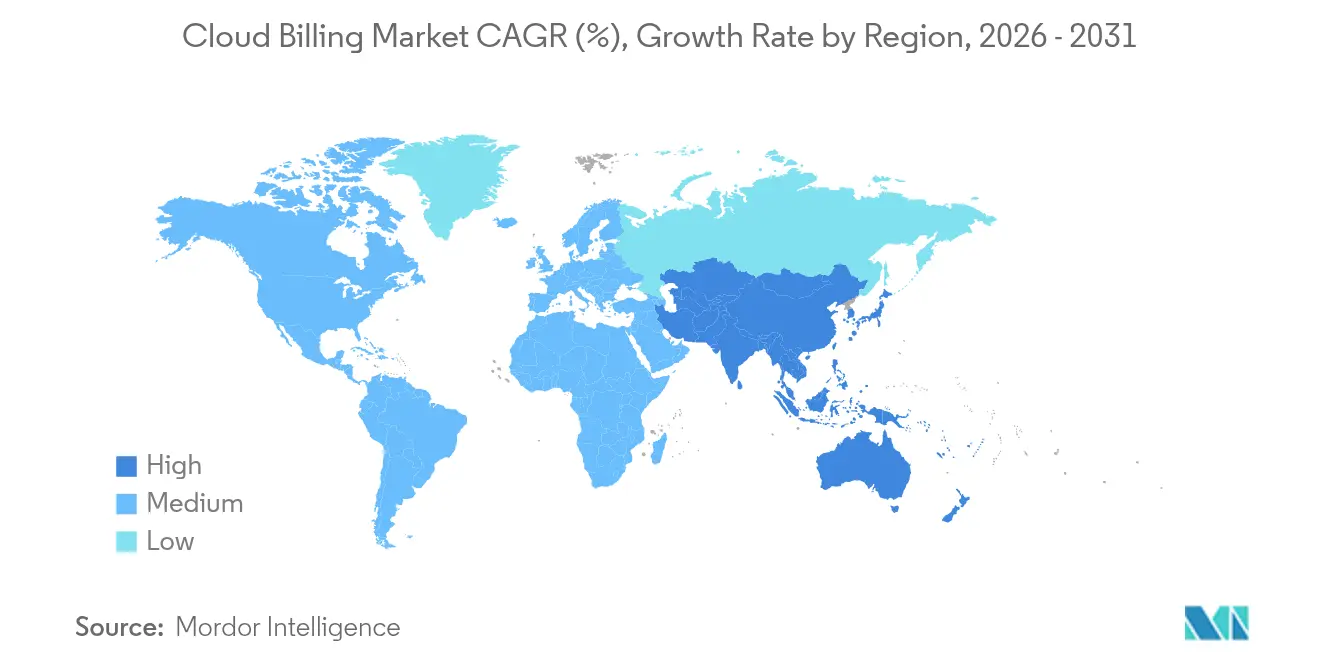
| Fastest Growing Market | Asia Pacific |
| Largest Market | North America |
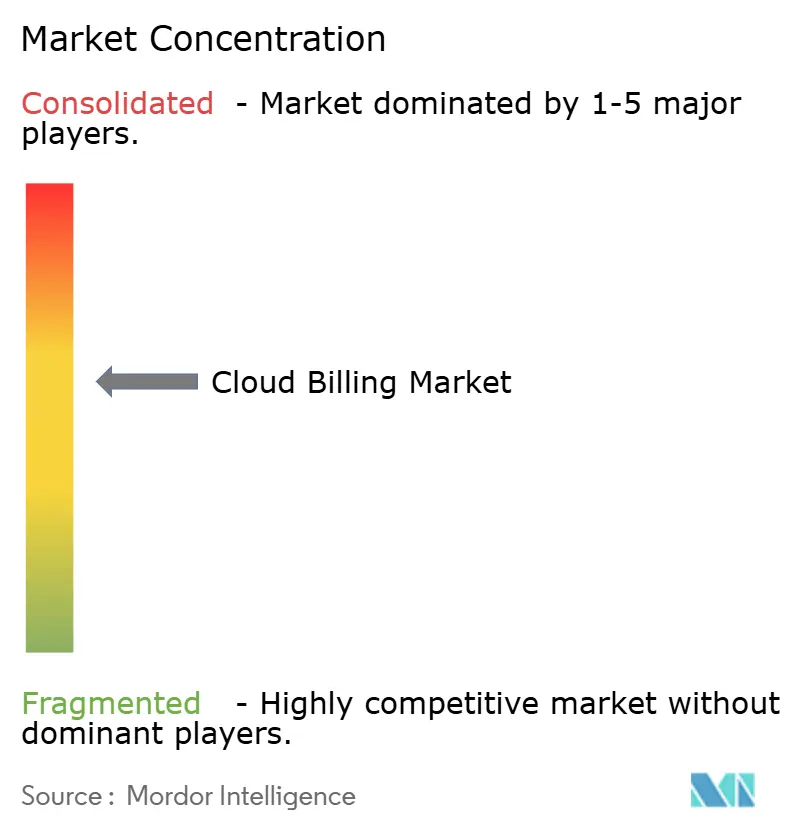
| Market Concentration | Medium |
Major Players *Disclaimer: Major Players sorted in no particular order Image © Mordor Intelligence. Reuse requires attribution under CC BY 4.0. | |
Cloud Billing Market Analysis by Mordor Intelligence
Cloud Billing Market size in 2026 is estimated at USD 15.83 billion, growing from 2025 value of USD 13.87 billion with 2031 projections showing USD 30.64 billion, growing at 14.12% CAGR over 2026-2031. Enterprises are diverting spending toward usage-aligned commercial models that can translate millions of metering records into invoices without latency. Migration toward multi-cloud environments and the attendant demand for granular cost attribution are the pivotal forces behind this double-digit expansion. Heightened infrastructure outlays by hyperscalers, advances in real-time metering, and a pronounced shift from capacity-based to outcome-based purchasing have all amplified the relevance of the cloud billing market. In parallel, specialized vendors that embed machine-learning cost-optimization features are compressing implementation timelines and easing the skills burden on enterprise FinOps teams.
Key Report Takeaways
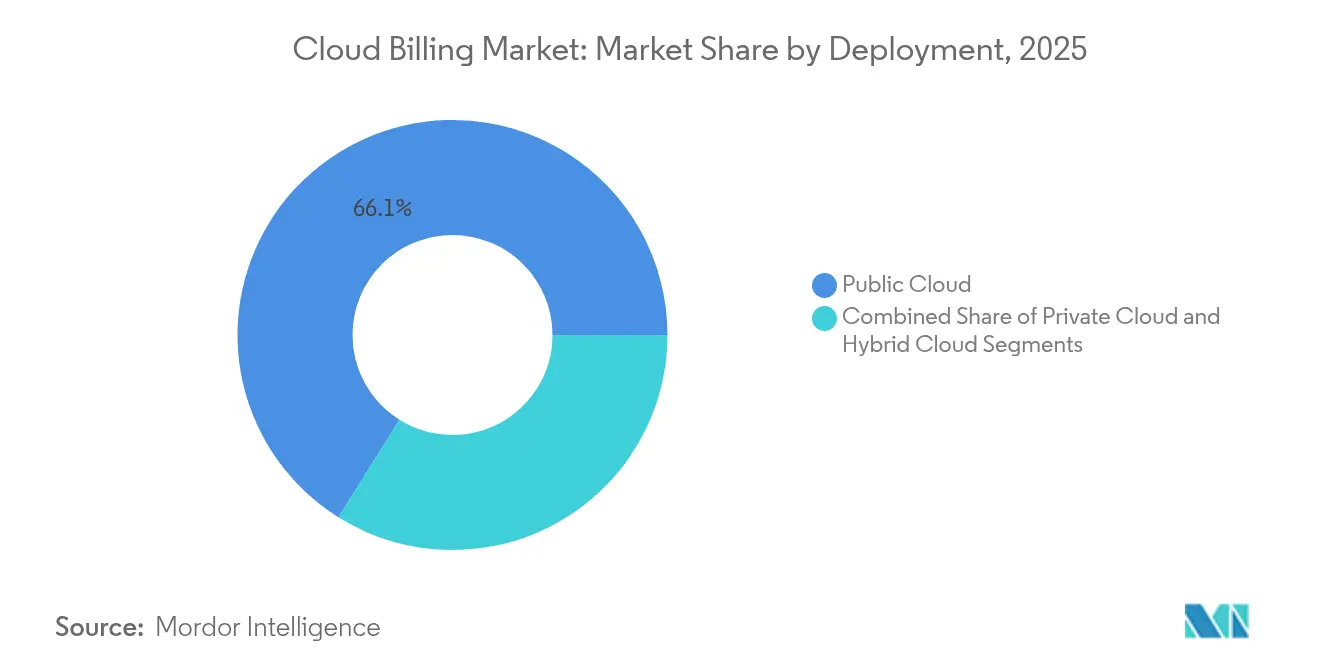
- By deployment, public cloud captured 66.10% of the cloud billing market share in 2025, while hybrid cloud is projected to compound at 15.81% CAGR through 2031.
- By component, platforms held 60.10% revenue in 2025; services are forecast to expand at 16.62% CAGR to 2031.
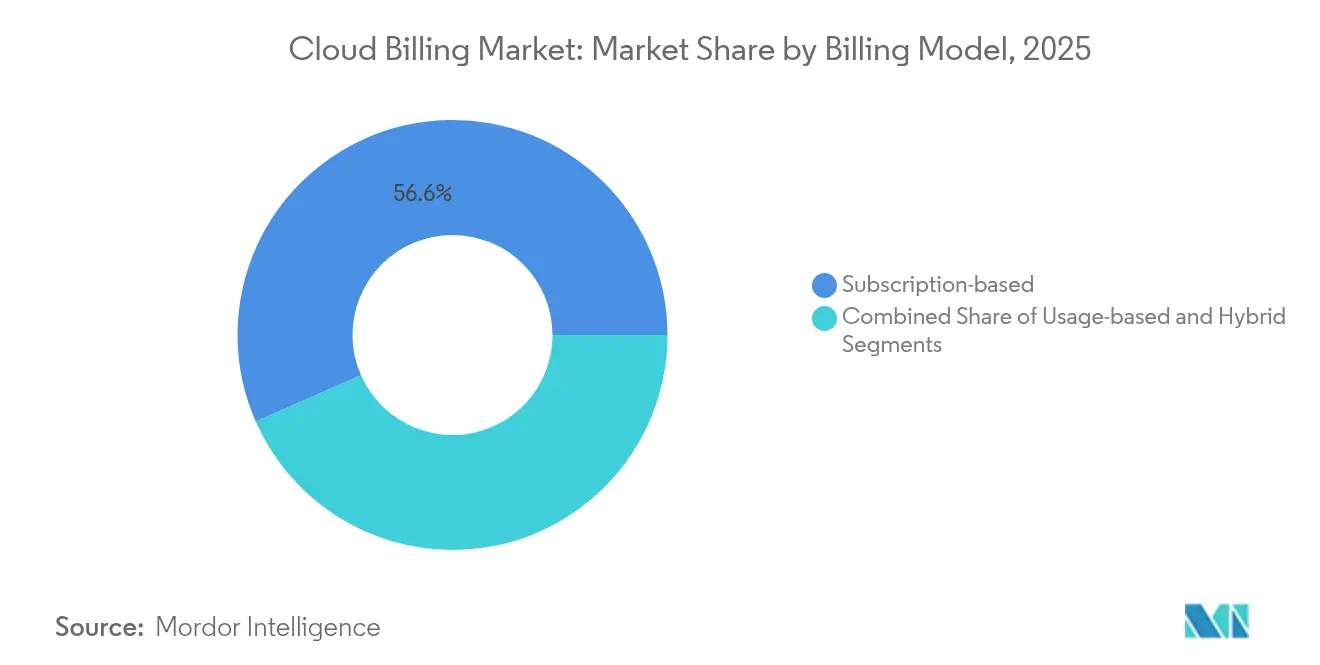
- By billing model, subscriptions commanded 56.60% of the cloud billing market size in 2025; usage-based models will rise at 15.34% CAGR through 2031.
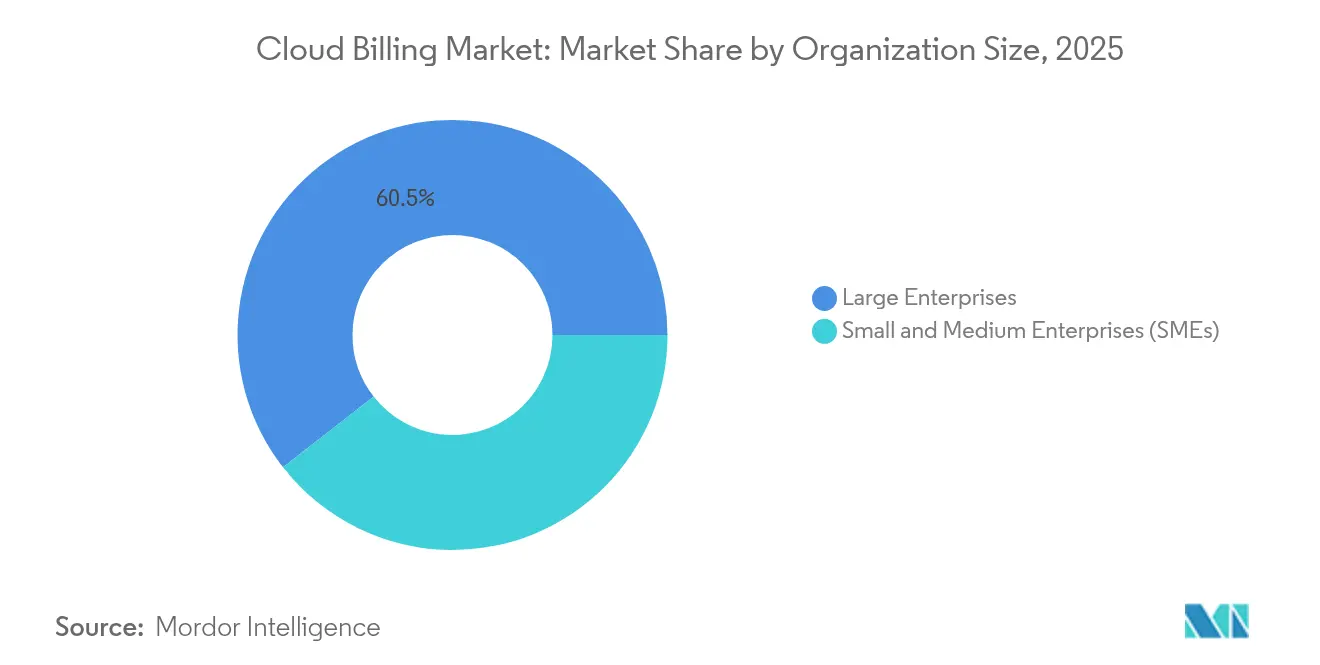
- By organization size, large enterprises controlled 60.55% of 2025 revenues, whereas SMEs are expected to post a 16.86% CAGR up to 2031.
- By service model, SaaS billing produced 46.80% of 2025 sales, and PaaS billing will advance at 16.04% CAGR.
- By end-user industry, retail and e-commerce led with 25.85% revenue in 2025; healthcare is set to grow at 15.78% CAGR.
- By geography, North America accounted for 36.80% of 2025 revenue; Asia-Pacific will accelerate at 16.28% CAGR.
Note: Market size and forecast figures in this report are generated using Mordor Intelligence’s proprietary estimation framework, updated with the latest available data and insights as of 2026.
Global Cloud Billing Market Trends and Insights
Drivers Impact Analysis*
| Driver | (~) % Impact on CAGR Forecast | Geographic Relevance | Impact Timeline |
|---|---|---|---|
| Accelerating multi-cloud adoption | +3.2% | Global with North America and Europe leading | Medium term (2-4 years) |
| Expansion of e-commerce subscription models | +2.8% | Global, concentrated in North America and Asia-Pacific | Short term (≤ 2 years) |
| Rising demand for real-time usage-based pricing | +2.4% | Global, enterprise segments in developed markets | Medium term (2-4 years) |
| Token-based cloud consumption in Web3 | +1.1% | North America, Europe, select Asia-Pacific markets | Long term (≥ 4 years) |
| Carbon-aware workload scheduling incentives | +0.9% | Europe, North America expanding to Asia-Pacific | Long term (≥ 4 years) |
| Integration of AI-driven cost optimization engines | +2.6% | North America, Europe, Asia-Pacific enterprises | Medium term (2–4 years) |
| Source: Mordor Intelligence | |||
Accelerating Multi-Cloud Adoption
Multi-cloud strategies are gaining popularity as organizations distribute workloads to balance resilience, pricing, and data-residency requirements. Policy-driven resource controls inside Kubernetes have demonstrated that finely tuned autoscaling curbs unpredictable spend while maintaining governance.[1]Microsoft, “Allocate Azure Costs,” microsoft.com Billing platforms now reconcile divergent price books, currencies, and taxonomies in real time and supply chargeback reports that promote unit-level accountability. The cloud billing market gains momentum as hyperscalers publish consumption APIs that shorten data ingestion cycles and as enterprises mitigate single-vendor risk by embracing provider diversity. Demand, therefore, concentrates on billing engines that normalise multi-cloud telemetry and present unified dashboards.
Expansion of E-Commerce Subscription Models
Subscription commerce no longer applies exclusively to SaaS. Retailers integrate physical goods, content bundles, and hybrid memberships that require intricate proration, tiered add-ons, and cyclical promotions. Platforms must orchestrate price adjustments triggered by customer behaviour and localise checkout in line with country-specific payment methods, PSD2 mandates, and GDPR obligations.[2]Stripe, “How to Accept Payments in Denmark,” stripe.com Growth in recurring commerce strengthens the cloud billing market by broadening the user base from software publishers to merchants that ship tangible products.
Rising Demand for Real-Time Usage-Based Pricing
Enterprises increasingly favour metered tariffs that mirror actual workload elasticity. Oracle’s elastic ECPU construct is emblematic of this pivot toward fine-grained metrics that supersede coarse commitments. Billing engines must ingest, aggregate, and rate sub-second logs without sacrificing accuracy. The cloud billing market capitalises on this need by embedding streaming-data ingestion and offering predictive insights that prevent bill shocks.
Token-Based Cloud Consumption Models in Web3 Startups
Web3 firms experiment with paying for resources using native tokens that settle instantly on-chain. Smart contracts automate rate adjustments tied to token economics, aligning infrastructure costs directly with application revenue. Although nascent, tokenised payment flows highlight how programmable money can converge with programmable infrastructure, thereby widening the addressable horizon for the cloud billing industry.
Restraints Impact Analysis*
| Restraint | (~) % Impact on CAGR Forecast | Geographic Relevance | Impact Timeline |
|---|---|---|---|
| Migration complexities from legacy on-prem | −2.1% | Global, higher in established enterprises | Medium term (2–4 years) |
| Data-sovereignty and cross-border compliance | −1.8% | Europe, Asia-Pacific | Long term (≥ 4 years) |
| Rising FinOps tooling cannibalizing native margins | −1.3% | North America, Europe expanding globally | Short term (≤ 2 years) |
| Vendor lock-in and interoperability challenges | −1.6% | Global, notably in multi-cloud environments | Medium term (2–4 years) |
| Source: Mordor Intelligence | |||
Migration Complexities from Legacy On-Premises Billing
Long-standing on-prem billing stacks often carry undocumented business logic, making data mapping and rule translation difficult. Enterprises in regulated verticals simultaneously uphold PCI-DSS, SOX, or HIPAA mandates during cut-over, obliging dual-run environments that inflate project budgets. The resource burden deters some organisations from full transition and tempers the near-term expansion pace of the cloud billing market.
Data-Sovereignty and Cross-Border Compliance Costs
Data-protection regimes differ across jurisdictions, and localisation clauses oblige providers to host ledgers in region-bound clusters. Draft guidance, such as NIST SP 800-228, sets stricter API security controls, intensifying development overhead. Continuous audits and redundant hosting can increase the total cost of ownership and slow down procurement in sensitive sectors.
*Our forecasts treat driver/restraint impacts as directional, not additive. The impact forecasts reflect baseline growth, mix effects, and variable interactions.
Segment Analysis
By Deployment: Hybrid Architectures Drive Complexity
Hybrid environments are recording a 15.81% CAGR as organisations pair on-prem assets with hyperscale elasticity. Enterprises value the ability to shift workloads without forfeiting data residency or latency-sensitive processing, yet they often encounter fragmented cost structures. Billing vendors respond by releasing adapters that harmonise private-cloud telemetry with public-cloud rate cards.
Public deployment maintains a 66.10% revenue lead due to its simplicity and broad tooling ecosystems. Nevertheless, compliance triggers, edge use cases, and geopolitics strengthen the case for hybrid spend governance. The cloud billing market, therefore, pivots toward unified orchestration engines that calculate blended effective rates and surface variance reports across locations.


By Component: Services Segment Transforms Market Dynamics
Services revenue is climbing at 16.62% CAGR as enterprises outsource roadmap planning, integration, and optimisation. Providers bundle advisory, implementation, and managed operations that target rapid payback. Platforms continue to dominate with a 60.10% share, yet service-led engagement secures footholds in regulated domains where bespoke controls are pivotal.
The cloud billing market benefits because service specialists translate domain nuances into configuration baselines that shrink deployment risk. Bundled offerings that pair platform licences with lifecycle services foster stickier contracts and unlock expansion into adjacent cost-governance modules such as carbon tracing and partner settlement.
By Billing Model: Usage-Based Pricing Gains Enterprise Traction
Usage-metered billing advances at a 15.34% CAGR, narrowing the gap with subscription, which holds 56.60%. The pattern reflects maturing FinOps practice and management appetite for aligning spend with unit economics. Hybrid constructs that mix a base fee with variable overage draw attention because they deliver predictable revenue without underutilised capacity.
Providers refine high-frequency intake pipelines that rate millions of events with near-zero latency, unlocking possibilities such as pay-per-function or pay-per-token. The cloud billing market size for usage models is forecast to reach USD 12.84 billion by 2031, underscoring sustained demand for flexible tariff engines that can be adjusted without requiring code refactoring.
By Cloud Service Model: PaaS Billing Drives Innovation
PaaS-oriented billing will log 16.04% CAGR, propelled by application modernisation, serverless adoption, and growing reliance on managed AI services. SaaS still leads with 46.80% revenue because of its entrenched subscription base. However, as enterprise developers lean on containers, serverless runtimes, and AI accelerators, PaaS usage grows and requires multidimensional metering such as per-invocation and per-token tracking.
Granular PaaS cost attribution shapes architectural decisions and fosters a culture of fiscal ownership among engineering squads. The cloud billing market thus integrates feature-flag-based routing, enabling teams to experiment on new services while limiting budget exposure. SaaS metering innovations such as seat-flexing and activity-based charges sustain segment vibrancy, creating cross-pollination between service-model categories.
By Organization Size: SMEs Embrace Cloud-Native Billing
SMEs are forecast to outpace large enterprises at 16.86% CAGR, propelled by plug-and-play billing software delivered in SaaS form. Lower cost of entry and templates aligned to common verticals enable these firms to deploy mature billing without hiring specialist staff. Large enterprises still generate 60.55% of 2025 spend because they operate multi-entity structures that demand consolidated invoicing and granular allocation.
The cloud billing market enjoys network effects as SME adoption opens indirect channels through resellers and marketplaces. Simplified APIs and low-code interfaces reduce onboarding friction and foster supplier diversification. Vendors cultivate scaled self-service support that keeps margins intact even on smaller contracts.
By End-user Industry: Healthcare Drives Compliance-Focused Growth
Healthcare is registering a 15.78% CAGR thanks to digital record mandates, telehealth expansion, and audit-ready traceability. The sector demands HIPAA-conformant encryption, immutable logs, and dual-run validations, raising complexity but also enlarging contract size. Retail and e-commerce still occupy 25.85% of revenue because high-volume checkouts, loyalty schemes, and international settlements call for sophisticated billing logic.
BFSI and telecoms consume advanced features such as multi-currency settlement, revenue-share accounting, and customer self-service portals. Energy utilities leverage real-time billing for smart-grid incentives, reflecting convergence between operational data and financial reconciliation. These vertical patterns collectively widen the addressable cloud billing market while rewarding providers that maintain industry-specific compliance expertise.
Geography Analysis
North America generated 36.80% of 2025 revenue and continues to benefit from a concentration of hyperscalers, venture funding, and FinOps talent. The region rewards vendors that comply with frameworks such as SOX and state-level privacy statutes. High usage of AI workloads also catalyzes the adoption of token-metered services, reinforcing demand for real-time rating.
The Asia-Pacific region posts the fastest growth rate of 16.28% CAGR, driven by public-sector digitization, mobile-first consumer bases, and sovereign AI computing initiatives. India’s national GPU programme exemplifies how government grants catalyse cloud capacity that must be monetised through scalable billing. Japan’s carbon-linked battery network highlights regional appetite for merging cost with environmental KPIs. Providers that bundle localisation and language support gain early footholds.
Europe balances GDPR leadership with emerging digital sovereignty plans. Enterprises require local data centres and transparent data-processing chains, so billing platforms that guarantee regional residency gain preference. Initiatives encouraging carbon-aware scheduling drive the cloud billing market toward environmental chargeback reports. Fragmented national rules prolong procurement cycles, yet they also amplify barriers for newcomers and solidify loyalty to vendors adept at navigating compliance nuances.

Competitive Landscape
The market positions hyperscalers such as AWS, Microsoft Azure, and Google Cloud as foundation vendors because they embed billing directly within their larger service ecosystems. These contenders exploit scale economies and release AI-powered optimisation recommendations that raise switching costs. Specialized pure-plays, including Zuora, Stripe, and Chargebee, differentiate themselves through rapid innovation, vertical templates, and extensive payment method libraries.
Competitive intensity sharpens around capabilities such as streaming ingestion, anomaly detection, and policy-based remediation. Providers now integrate machine learning into their billing engines to predict overspend and trigger automated actions. Strategic alliances also rise, Ericsson collaborates with AWS to modernise telecom billing, illustrating how domain expertise marries hyperscale infrastructure.[4]Ericsson, “How Ericsson and AWS Are Accelerating Digital Transformation and AI Innovation in OSS/BSS,” ericsson.com Vendors with broad API exposure and security certifications aligned to NIST SP 800-228 attract regulated customers seeking risk mitigation.
M&A activity tends to focus on niche analytics and compliance assets that can be integrated into broader suites. The cloud billing market is expected to witness further convergence between cost-management ISVs and payment service providers eager to expand into recurring revenue enablement.
Cloud Billing Industry Leaders
Amazon Web Services (AWS)
Microsoft Corporation (Azure)
Google Cloud Platform
Oracle Corporation
SAP SE
- *Disclaimer: Major Players sorted in no particular order

Recent Industry Developments
- June 2025: Amazon earmarked USD 2 billion to extend Australian data centres, reinforcing sovereign-cloud capabilities.
- June 2025: OpenAI slashed o3-pro pricing by 80%, signalling aggressive commoditisation of token-based AI usage.
- June 2025: TEPCO linked 40,000 battery systems to an AI-driven carbon-neutral programme, creating novel billing opportunities around distributed energy resources.
- May 2025: AWS revenue rose 17% to USD 33.5 billion, underlining the volume driving multi-cloud billing complexity.
- February 2025: Ericsson and AWS renewed an OSS/BSS pact, improving cloud-native billing for telecom carriers.


Research Methodology Framework and Report Scope
Market Definitions and Key Coverage
Our study, according to Mordor Intelligence, treats the cloud billing market as every platform or managed service that measures, rates, invoices, and reconciles usage or subscription charges for public, private, or hybrid cloud resources across IaaS, PaaS, and SaaS environments. The sizing captures new license, pay-as-you-go, and support revenues booked by vendors and service partners that serve enterprise and mid-market customers.
Scope exclusion: Traditional on-premise billing suites that never interface with external clouds remain outside this scope.
Segmentation Overview
- By Deployment
- Public Cloud
- Private Cloud
- Hybrid Cloud
- By Component
- Platform
- Services
- By Billing Model
- Subscription-based
- Usage-based
- Hybrid (Subscription + Usage)
- By Cloud Service Model
- SaaS Billing
- PaaS Billing
- IaaS Billing
- By Organization Size
- Large Enterprises
- Small and Medium Enterprises (SMEs)
- By End-user Industry
- Retail and E-commerce
- BFSI
- Telecommunications
- Healthcare and Life Sciences
- Energy and Utilities
- Government and Public Sector
- Media and Entertainment
- Other End-user Industries
- By Geography
- North America
- United States
- Canada
- Mexico
- South America
- Brazil
- Argentina
- Chile
- Rest of South America
- Europe
- Germany
- United Kingdom
- France
- Italy
- Spain
- Russia
- Rest of Europe
- Asia Pacific
- China
- India
- Japan
- South Korea
- Singapore
- Malaysia
- Australia
- Rest of Asia Pacific
- Middle East and Africa
- Middle East
- United Arab Emirates
- Saudi Arabia
- Turkey
- Rest of Middle East
- Africa
- South Africa
- Nigeria
- Egypt
- Rest of Africa
- Middle East
- North America
Detailed Research Methodology and Data Validation
Primary Research
Interviews with billing software architects, cloud procurement heads, and FinOps advisors across North America, Europe, and Asia allowed us to validate price corridors, contract tenures, and the pace of hybrid-cloud adoption. This closed information gaps left by desk work.
Desk Research
We began with datasets from the U.S. Bureau of Labor Statistics, Eurostat cloud files, and International Telecommunication Union workload counts, which anchor enterprise spend pools. Our team then layered import-export records for hyperscale hardware, patent analytics accessed through Questel that flag micro-service innovation, and public 10-K disclosures revealing deferred cloud revenue. Additional context flowed from Cloud Native Computing Foundation briefs, FinOps Foundation benchmarks, and D&B Hoovers company snapshots. The sources listed are indicative; many others aided data gathering, confirmation, and clarification.
Market-Sizing & Forecasting
A top-down construct scales global enterprise cloud spend and applies workload penetration, price points, and attach ratios to reach the 2025 baseline. Supplier roll-ups plus sampled average selling price multiplied by active-account counts provide a selective bottom-up cross-check before totals are adjusted. Key variables like multi-cloud penetration, subscription-economy growth, average annual recurring revenue per tenant, SME cloud uptake, hyperscaler IaaS price shifts, and FinOps tooling adoption feed a multivariate regression that drives 2026-2030 projections.
Data Validation & Update Cycle
Outputs run through anomaly screens versus independent spend trackers and year-over-year variance thresholds, then pass a senior analyst review. We refresh each model annually, with interim updates triggered by material vendor pricing or regulatory moves, and a final sweep just before delivery.
Why Mordor's Cloud Billing Baseline Earns Stakeholder Trust
Published estimates often differ because firms carve scope, choose variables, or lock exchange rates in unique ways.
Gaps typically arise when studies add telecom-only charging, assume linear cloud migration, or rely on untested price escalators. Our disciplined refresh cadence and dual-path validation keep such distortions in check.
Benchmark comparison
| Market Size | Anonymized source | Primary gap driver |
|---|---|---|
| USD 13.87 B (2025) | Mordor Intelligence | |
| USD 6.50 B (2025) | Global Consultancy A | Narrow software focus, 2020 price base, minimal primary validation |
| USD 35.10 B (2024) | Industry Journal B | Bundles cost-optimization and telecom OSS, optimistic usage multiplier, sparse verification |
The comparison shows that Mordor's carefully bounded scope, live variables, and frequent updates furnish a balanced, transparent baseline that decision-makers can follow and replicate with confidence.


Key Questions Answered in the Report
What is the current size of the cloud billing market?
The cloud billing market reached USD 15.83 billion in 2026 and is forecast to achieve USD 30.64 billion by 2031, advancing at 14.12% CAGR.
Which deployment model is growing fastest within the cloud billing market?
Hybrid cloud billing solutions are expanding at 15.81% CAGR as enterprises orchestrate costs across on-prem and public-cloud resources.
Why are usage-based pricing models gaining traction?
Enterprises want charges that mirror real consumption, reducing idle capacity costs and aligning spend with output, which propels usage-metered growth at 15.34% CAGR.
Which region shows the highest growth potential?
Asia-Pacific is projected to post a 16.28% CAGR through 2031, driven by government infrastructure programmes and rapid digital adoption.
How are SMEs influencing the cloud billing market?
SMEs, empowered by low-code SaaS billing platforms, will grow at 16.86% CAGR and democratise access to advanced cost-management capabilities.
What technologies differentiate leading cloud billing providers?
Leaders integrate AI-based anomaly detection, real-time data streaming, and carbon-aware cost reporting to improve accuracy and transparency.
Page last updated on:


