Digital Twin NDT Market Size and Share
Market Overview
| Study Period | 2019 - 2030 |
|---|---|
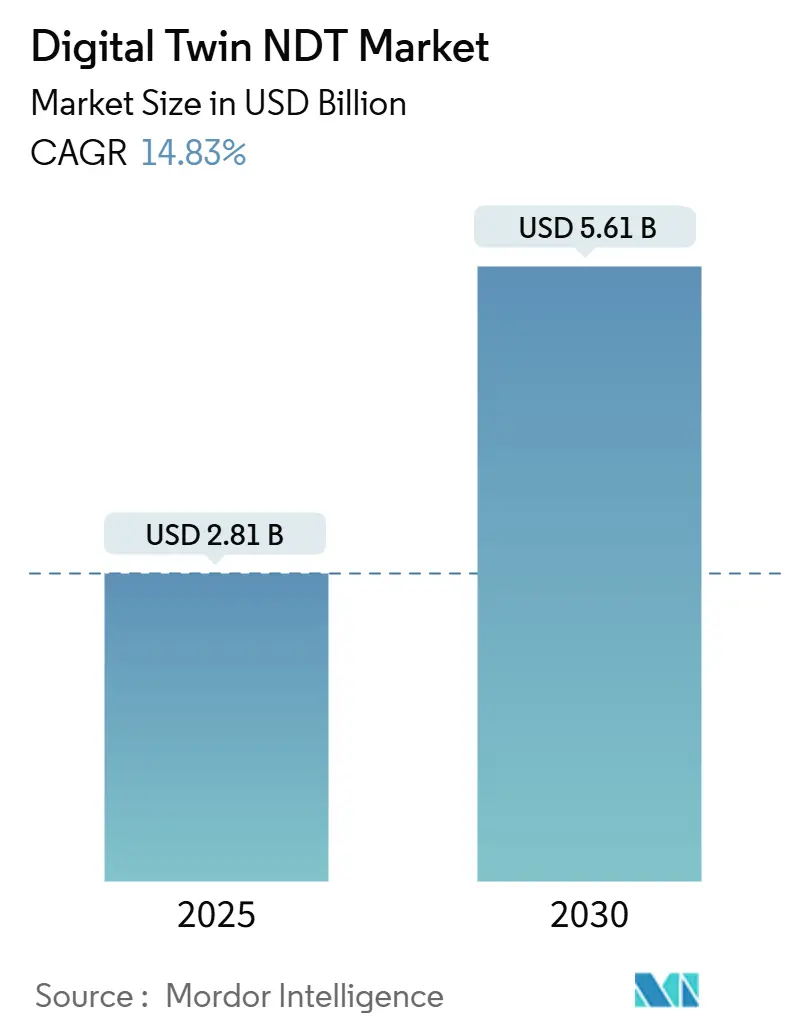
| Market Size (2025) | USD 2.81 Billion |
| Market Size (2030) | USD 5.61 Billion |
| Growth Rate (2025 - 2030) | 14.83% CAGR |
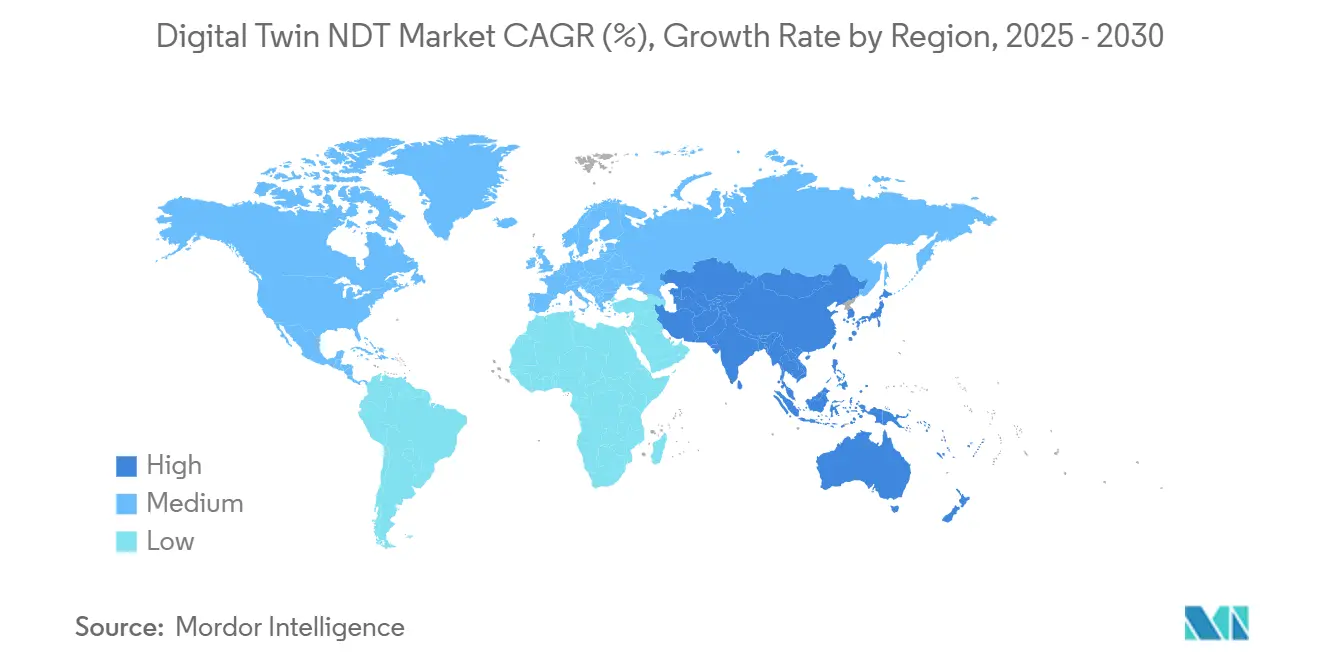
| Fastest Growing Market | Asia Pacific |
| Largest Market | North America |
| Market Concentration | Medium |
Major Players *Disclaimer: Major Players sorted in no particular order Image © Mordor Intelligence. Reuse requires attribution under CC BY 4.0. | |
Digital Twin NDT Market Analysis by Mordor Intelligence
The digital twin NDT market size was USD 2.81 billion in 2025 and is projected to reach USD 5.61 billion by 2030, growing at a 14.83% CAGR from 2025 to 2030. This robust outlook reflects the convergence of high-fidelity physics modeling, advanced sensors, 5G connectivity, and edge computing that is unlocking real-time visibility into asset integrity for operators across capital-intensive industries. Early adopters confirm that virtual replicas accelerate defect detection, trim unplanned downtime, and extend equipment life, motivating follow-on investments even in cost-sensitive markets. Regulatory bodies are reinforcing momentum by framing digital records of inspection data as a compliance pathway for safety and environmental rules. Competitive dynamics remain fluid as industrial software giants, niche analytics vendors, and hardware specialists race to embed AI and hybrid twin capabilities that enhance detection accuracy and reduce inspection cycles. These factors collectively sustain double-digit growth, despite scrutiny of macro-level capital expenditures in the energy and manufacturing sectors.
Key Report Takeaways
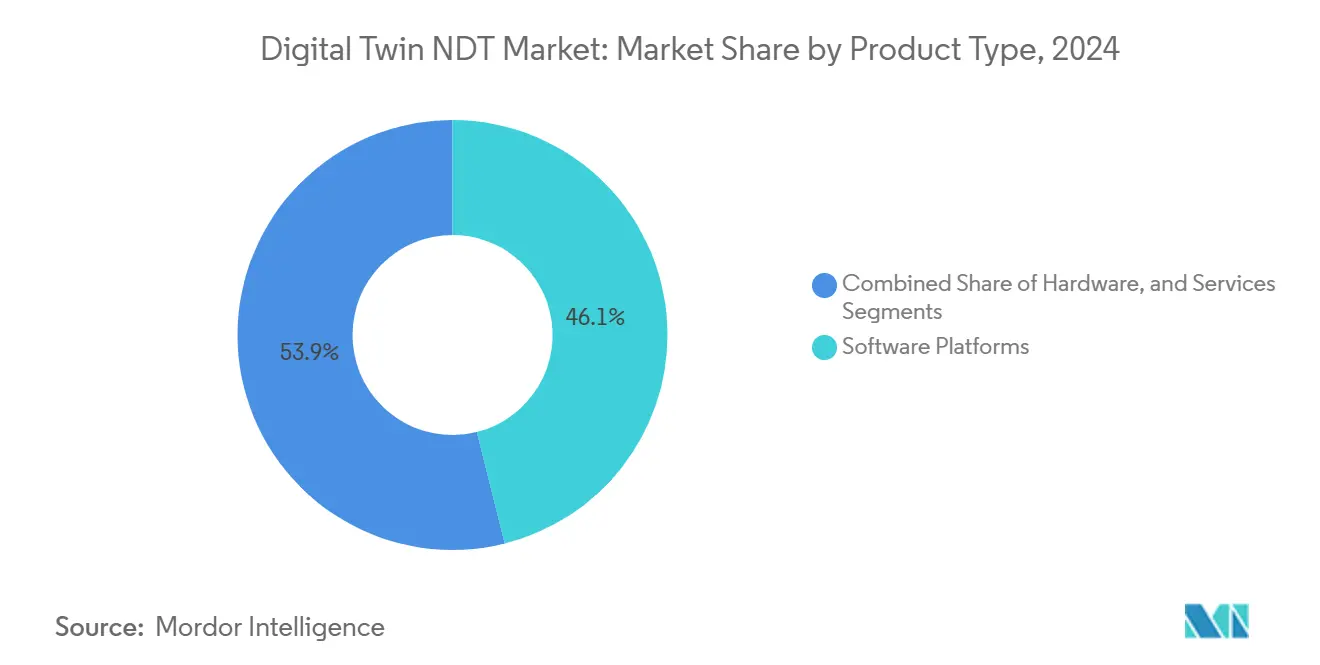
- By product type, software platforms led with a 46.1% revenue share in 2024, while hardware components are expected to advance at a 17.8% CAGR through 2030.
- By technology, physics-based modeling commanded 41.2% of the digital twin NDT market share in 2024, whereas hybrid twins are projected to expand at a 16.6% CAGR to 2030.
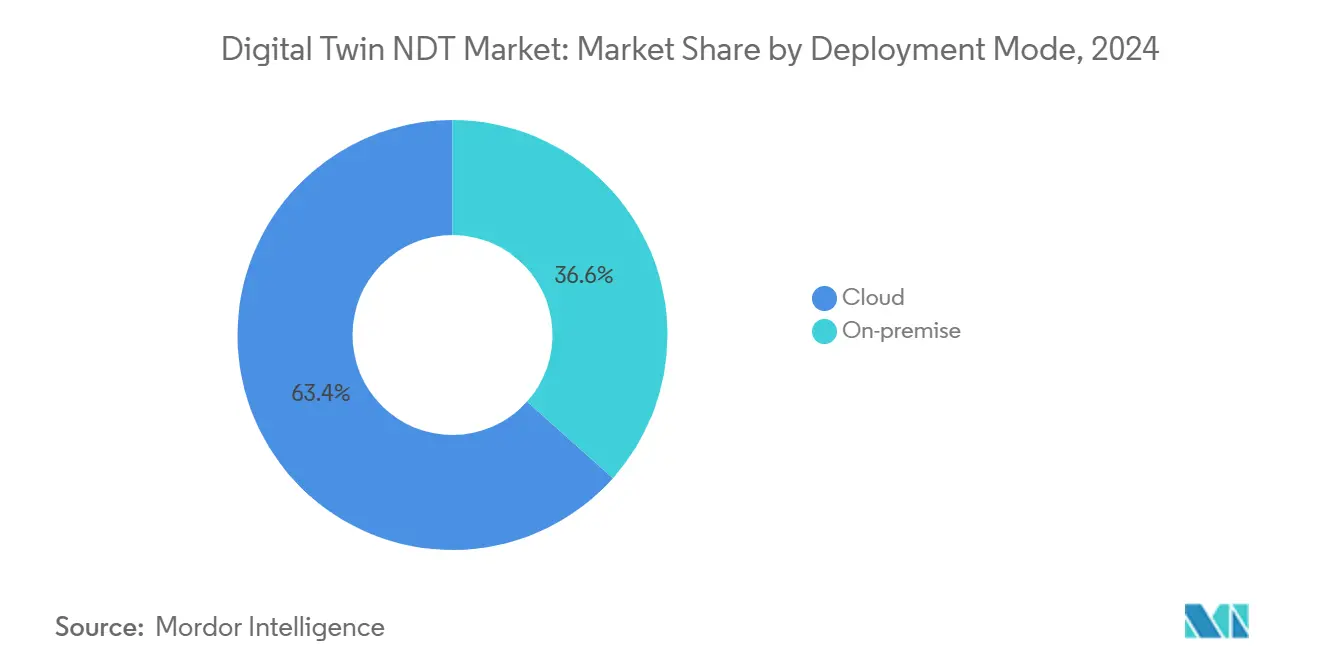
- By deployment, cloud solutions captured 63.4% of the digital twin NDT market size in 2024 and are set to grow at a 20.5% CAGR through 2030.
- By end-user industry, oil and gas pipelines accounted for 24.6% of the digital twin NDT market size in 2024, while the automotive and transportation sectors are forecast to post the highest CAGR of 16.9% from 2024 to 2030.
- By geography, North America held a 36.2% revenue share in 2024; the Asia-Pacific region is poised to log a 16.1% CAGR during 2025-2030.
Global Digital Twin NDT Market Trends and Insights
Drivers Impact Analysis*
| Driver | (~) % Impact on CAGR Forecast | Geographic Relevance | Impact Timeline |
|---|---|---|---|
| Increasing demand for real-time asset health monitoring in oil and gas pipelines | +2.8% | Global, with a concentration in North America and the Middle East | Medium term (2-4 years) |
| Rapid adoption of predictive maintenance strategies in aerospace MRO | +2.1% | North America and Europe core, expanding to Asia-Pacific | Short term (≤ 2 years) |
| Cost efficiencies from virtual commissioning of industrial robots | +1.9% | Global manufacturing hubs, particularly Asia-Pacific and Europe | Medium term (2-4 years) |
| Convergence of 5G and edge computing, enabling high-fidelity twins | +2.4% | Developed markets initially, and spillover to emerging economies | Long term (≥ 4 years) |
| Emerging regulations mandating digital records of inspection data (EU AI Act) | +1.6% | Europe is primary, with regulatory spillover effects globally | Short term (≤ 2 years) |
| Integration of acoustic emission data analytics for micro-crack detection | +1.3% | Advanced manufacturing regions globally | Medium term (2-4 years) |
| Source: Mordor Intelligence | |||
Increasing Demand for Real-Time Asset Health Monitoring in Oil and Gas Pipelines
Pipeline operators are transitioning from calendar-based inspections to continuous surveillance that integrates sensor feeds with physics-driven models. Colonial Pipeline’s 2021 disruption spotlighted the cost of delayed detection, prompting regulators to promote always-on integrity programs. Modern platforms ingest pressure, temperature, and flow signals, run transient simulations, and flag anomalies months ahead of legacy tools. Operators report fewer excavation digs and tighter leak-loss metrics, while insurers cite lower incident payouts. Regulators now reference digital twin-enabled monitoring as a best-practice pathway for environmental compliance.[1]Pipeline and Hazardous Materials Safety Administration, “Pipeline Safety Regulations and Guidance,” phmsa.dot.gov
Rapid Adoption of Predictive Maintenance Strategies in Aerospace MRO
Aircraft OEMs and maintenance, repair, and overhaul entities deploy fleet-specific twins that model fatigue, thermal cycles, and flight profiles to optimize maintenance and repair. Boeing documented a 25% drop in maintenance costs on its 787 program after embedding twin-based scheduling, while Rolls-Royce’s IntelligentEngine mirrors each powerplant to forecast service needs. The Federal Aviation Administration accepts data-driven maintenance intervals that meet airworthiness rules, removing regulatory uncertainty and accelerating airline uptake.[2]Federal Aviation Administration, “Advisory Circulars and Regulatory Guidance,” faa.gov As travel rebounds, carriers prioritize utilization, further stimulating spending on predictive twin suites.
Convergence of 5G and Edge Computing Enabling High-Fidelity Twins
Ultra-low-latency 5G links, combined with edge nodes, enable millisecond synchronization between field data and virtual models by moving compute closer to assets. Qualcomm field trials in smart factories demonstrate that vibration alarms can close the loop in under 10 ms, preventing tool crashes. The 3rd Generation Partnership Project codified time-sensitive networking profiles that guarantee deterministic behavior for industrial twins.[3]3rd Generation Partnership Project, “5G System Architecture and Standards,” 3gpp.org Utilities and wind-farm operators are piloting similar architectures for blade health management, where split-second corrections avert cascade failures.
Cost Efficiencies from Virtual Commissioning of Industrial Robots
Digital twins allow engineers to debug code, optimize paths, and validate safety interlocks in a virtual environment. Siemens reports 30% shorter line-ramp cycles and 60% lower commissioning hours on auto body shops that integrate its simulation stack. Manufacturers can avoid late-stage surprises and refresh tooling during off-shifts, thereby minimizing production slack. Robotics OEMs now bundle twin-ready controllers, further easing adoption and enlarging the digital twin NDT market.
Restraints Impact Analysis*
| Restraint | (~) % Impact on CAGR Forecast | Geographic Relevance | Impact Timeline |
|---|---|---|---|
| Lack of interoperable data standards between NDT equipment OEMs | -1.8% | Global, with particular challenges in multi-vendor environments | Short term (≤ 2 years) |
| High upfront investment for simulation-grade computing infrastructure | -1.4% | Cost-sensitive markets, particularly emerging economies | Medium term (2-4 years) |
| Cybersecurity risks associated with twin-based remote inspections | -1.1% | Global, with heightened concerns in the critical infrastructure | Long term (≥ 4 years) |
| Shortage of NDT personnel skilled in data science and physics-based modeling | -1.3% | Global, with acute shortages in specialized industrial sectors | Long term (≥ 4 years) |
| Source: Mordor Intelligence | |||
Lack of Interoperable Data Standards Between NDT Equipment OEMs
Many ultrasonic, eddy-current, and radiographic devices output proprietary formats that impede seamless analytics. Operators either lock in a single vendor or fund costly middleware, both of which dilute ROI. The American Society for Nondestructive Testing and the ISO 23247 working groups are drafting open schemas; however, progress is slow due to vendor competition.[4]International Organization for Standardization, “ISO 23247 Digital Twin Framework for Manufacturing,” iso.org Until standards mature, system integrators must bridge data silos, which constrains the scalability of the digital twin NDT market.
High Upfront Investment for Simulation-Grade Computing Infrastructure
Building twin environments for complex assets often requires multi-node high-performance clusters and GPU acceleration. Capital outlays can exceed USD 5 million for large refineries or shipyards, which can stall projects in budget-tight settings. Cloud bursts reduce entry costs but raise concerns about data sovereignty and latency for time-critical inspections. Some regional banks now bundle equipment financing with subscription-based twin services, yet adoption remains uneven.
*Our forecasts treat driver/restraint impacts as directional, not additive. The impact forecasts reflect baseline growth, mix effects, and variable interactions.
Segment Analysis
By Product Type: Software Platforms Drive Market Leadership
The digital twin NDT market size for software platform sales reached 46.1% of total revenue in 2024. Feature-rich interfaces that blend finite-element solvers, machine-learning engines, and workflow orchestration anchor vendor differentiation. Continuous update cycles and subscription models stabilize revenue while allowing users to scale their licenses. Services follow closely as plant operators seek integration, training, and ongoing model calibration support. The hardware sector is the fastest-growing, with a 17.8% CAGR, driven by MEMS-grade vibration sensors and acoustic arrays featuring embedded AI cores that bring intelligence to the edge. Suppliers integrating edge analytics onto sensor boards shorten feedback loops and cut bandwidth needs, highlighting a shift toward distributed architectures that broaden the digital twin NDT market.


By Technology: Physics-Based Models Maintain Dominance
Physics-driven twins captured 41.2% digital twin NDT market share in 2024, favored in regulated domains that demand transparent, first-principles evidence. Their deterministic outputs assure engineers and auditors that defect predictions align with material science fundamentals. Data-driven twins excel where relationships are non-linear or poorly modeled, such as composites delamination, but lack explanatory depth. Hybrid twins, currently 16.6% CAGR leaders, merge the two by utilizing AI to fine-tune boundary conditions in real-time, producing rapid yet verifiable insights. This convergence supports broader use cases and enables compliance across diverse industry codes, underpinning long-term expansion of the digital twin NDT market.
By Deployment Mode: Cloud Solutions Accelerate Adoption
Cloud hosting accounted for 63.4% of 2024 revenue and remains the fastest-growing segment, with a 20.5% CAGR, as organizations tap into elastic compute without owning their own infrastructure. Microsoft Azure Digital Twins and Amazon Web Services IoT TwinMaker pre-build connectors to industrial historians, accelerating pilot spin-up. Security-sensitive verticals, such as defense, still favor on-premise clusters but are increasingly hybridizing by relegating heavy compute to the cloud while storing raw data locally. Edge nodes performing first-pass analytics enable sub-second alarms, reducing cloud egress fees and thereby tightening the total cost of ownership, which in turn widens digital twin NDT market adoption.
By End-User Industry: Oil and Gas Leads While Automotive Accelerates
Oil and gas operators held a 24.6% share of the digital twin NDT market in 2024, driven by the need to address aging pipelines and meet aggressive safety targets. Twin-enabled integrity programs enable remote diagnostics over vast networks, reducing the need for truck rolls and associated greenhouse gas emissions. Power utilities deploy similar logic on turbines and boilers to mitigate forced outages and balance the intermittency of renewable energy sources. The automotive and transportation sector is the standout growth engine, with a 16.9% CAGR, primarily driven by electric-vehicle battery twins that anticipate cell degradation and guide optimal charging. Railway operators and fleet owners follow suit, adopting condition-based maintenance schedules to keep assets online for longer periods. This sectoral diversification cements a resilient demand profile for the digital twin NDT market.
Geography Analysis
North America retained its leadership position with a 36.2% revenue share in 2024, as early movers in aerospace and pipeline safety codified digital twin workflows within their quality systems. Federal incentives around critical infrastructure protection further validate spending. Canada’s midstream companies deploy twins to monitor corrosion under insulation, while Mexico’s auto cluster integrates virtual commissioning to accelerate model launches. Steady aftermarket demand ensures the regional digital twin NDT market remains lucrative.
Europe’s tightly regulated environment supports widespread adoption, particularly in Germany’s automotive supply chain and Norway’s offshore oil and gas platforms. The European Union’s AI Act formalizes traceability rules, nudging manufacturers toward twin-based inspection logs. Vendors that certify conformance to emerging standards gain preference in public tenders, solidifying a strategic foothold. Eastern European shipyards begin pilots to streamline hull surveys, foreshadowing volume gains through 2030.
The Asia-Pacific region is the fastest-growing, with a 16.1% CAGR outlook. China channels industrial internet subsidies toward steel and petrochemical complexes that digitize their testing lines. India’s production-linked incentive schemes are sparking investment in semiconductor fabs, where sub-micron defect detection benefits from hybrid twins. Japan and South Korea extend their electronics expertise to drone-based NDT and micro-crack analytics, deepening local ecosystems. Southeast Asian governments sponsor smart-city bridge twins to avoid catastrophic failures amid climate stress, creating a fertile runway for the digital twin NDT market.

Competitive Landscape
The digital twin NDT market is moderately fragmented, with no single vendor controlling a significant share of the revenue; however, the top five firms collectively account for a substantial share of the global revenue. Siemens Digital Industries Software and Ansys leverage broad physics solvers, along with large installed bases, to cross-sell twin modules. In contrast, Hexagon and PTC focus on cloud-native stacks that integrate with enterprise resource planning systems. Startups such as Akselos specialize in mesh-free structural solvers that claim thousand-fold speedups, attracting partnerships with oil majors.
Strategic alliances are blossoming as software houses team up with sensor OEMs to deliver turnkey offerings. Siemens’ September 2025 move to acquire acoustic-emission IP illustrates a bid to own the full analytics pipeline. Patent filings tracked by the International Electrotechnical Commission reveal a surge in activity for sensor-fusion and edge-AI frameworks, underscoring rapid innovation cycles. Vendors aligning products to IEC and ISO twin standards gain an early credibility boost among regulated customers. Service integrators such as Accenture Technology seek to bundle multi-vendor components, easing integration pain and driving end-market maturity.
Cloud hyperscalers intensify competition by launching vertically integrated twin platforms with pay-as-you-go pricing that undercut perpetual licenses. In response, traditional engineering software providers release subscription-tier options and open APIs to maintain market share. Hardware specialists differentiate by embedding analytics at the sensor, locking in recurring firmware-update revenue, and reinforcing stickiness within the digital twin NDT market.
Digital Twin NDT Industry Leaders
Olympus Corporation
Siemens Digital Industries Software
Ansys Inc.
GE Digital (General Electric Company)
Dassault Systèmes SE
- *Disclaimer: Major Players sorted in no particular order


Recent Industry Developments
- September 2025: Siemens Digital Industries Software announced a USD 150 million investment to bolster its twin-based acoustic emission analytics and open R and D centers in India and Germany.
- August 2025: General Electric Digital launched the Predix Digital Twin platform for power-generation assets, citing turbine-life extensions of up to 20%.
- July 2025: Ansys Inc. acquired Akselos SA for USD 75 million, adding high-performance mesh-free solvers for offshore-structure monitoring.
- June 2025: Boeing deployed full-line digital twins across its 737 MAX assembly, reporting a projected 15% reduction in build time.


Global Digital Twin NDT Market Report Scope
| Software Platforms |
| Services |
| Hardware (Sensors, Data Acquisition Systems) |
| Physics-based Modelling Twins |
| Data-driven Twins (AI/ML) |
| Hybrid Twins |
| On-premise |
| Cloud |
| Oil and Gas |
| Power Generation |
| Aerospace |
| Defense |
| Automotive and Transportation |
| Manufacturing and Heavy Engineering |
| Construction and Infrastructure |
| Chemical and Petrochemical |
| Marine and Ship Building |
| Electronics and semiconductor |
| Mining |
| Medical Devices |
| Others |
| North America | United States | |
| Canada | ||
| Mexico | ||
| South America | Brazil | |
| Argentina | ||
| Rest of South America | ||
| Europe | Germany | |
| United Kingdom | ||
| France | ||
| Italy | ||
| Spain | ||
| Rest of Europe | ||
| Asia Pacific | China | |
| Japan | ||
| India | ||
| South Korea | ||
| South-East Asia | ||
| Rest of Asia Pacific | ||
| Middle East and Africa | Middle East | Saudi Arabia |
| United Arab Emirates | ||
| Turkey | ||
| Rest of Middle East | ||
| Africa | South Africa | |
| Nigeria | ||
| Rest of Africa | ||
| By Product Type | Software Platforms | ||
| Services | |||
| Hardware (Sensors, Data Acquisition Systems) | |||
| By Technology | Physics-based Modelling Twins | ||
| Data-driven Twins (AI/ML) | |||
| Hybrid Twins | |||
| By Deployment Mode | On-premise | ||
| Cloud | |||
| By End-user Industry | Oil and Gas | ||
| Power Generation | |||
| Aerospace | |||
| Defense | |||
| Automotive and Transportation | |||
| Manufacturing and Heavy Engineering | |||
| Construction and Infrastructure | |||
| Chemical and Petrochemical | |||
| Marine and Ship Building | |||
| Electronics and semiconductor | |||
| Mining | |||
| Medical Devices | |||
| Others | |||
| By Geography | North America | United States | |
| Canada | |||
| Mexico | |||
| South America | Brazil | ||
| Argentina | |||
| Rest of South America | |||
| Europe | Germany | ||
| United Kingdom | |||
| France | |||
| Italy | |||
| Spain | |||
| Rest of Europe | |||
| Asia Pacific | China | ||
| Japan | |||
| India | |||
| South Korea | |||
| South-East Asia | |||
| Rest of Asia Pacific | |||
| Middle East and Africa | Middle East | Saudi Arabia | |
| United Arab Emirates | |||
| Turkey | |||
| Rest of Middle East | |||
| Africa | South Africa | ||
| Nigeria | |||
| Rest of Africa | |||


Key Questions Answered in the Report
What is the expected growth rate of the digital twin NDT market between 2025 and 2030?
The market is projected to register a 14.83% CAGR, expanding from USD 2.81 billion in 2025 to USD 5.61 billion by 2030.
Which product category currently generates the most revenue?
Software platforms contribute the largest share at 46.1% of 2024 revenue, reflecting their central role in creating and managing twins.
What segment shows the highest growth through 2030?
The automotive and transportation sector leads with a 16.9% CAGR, driven by electric-vehicle battery monitoring and predictive maintenance programs.
Which region offers the fastest expansion opportunity?
The Asia-Pacific region is forecast to grow at a 16.1% CAGR, driven by large-scale infrastructure investments and government incentives for Industry 4.0.
Why are hybrid twins gaining attention?
They blend physics-based accuracy with AI pattern recognition, delivering rapid yet explainable insights that adapt as operational data evolves.
Page last updated on:


