Digital Nutraceutical Traceability Market Size and Share
Market Overview
| Study Period | 2020 - 2031 |
|---|---|
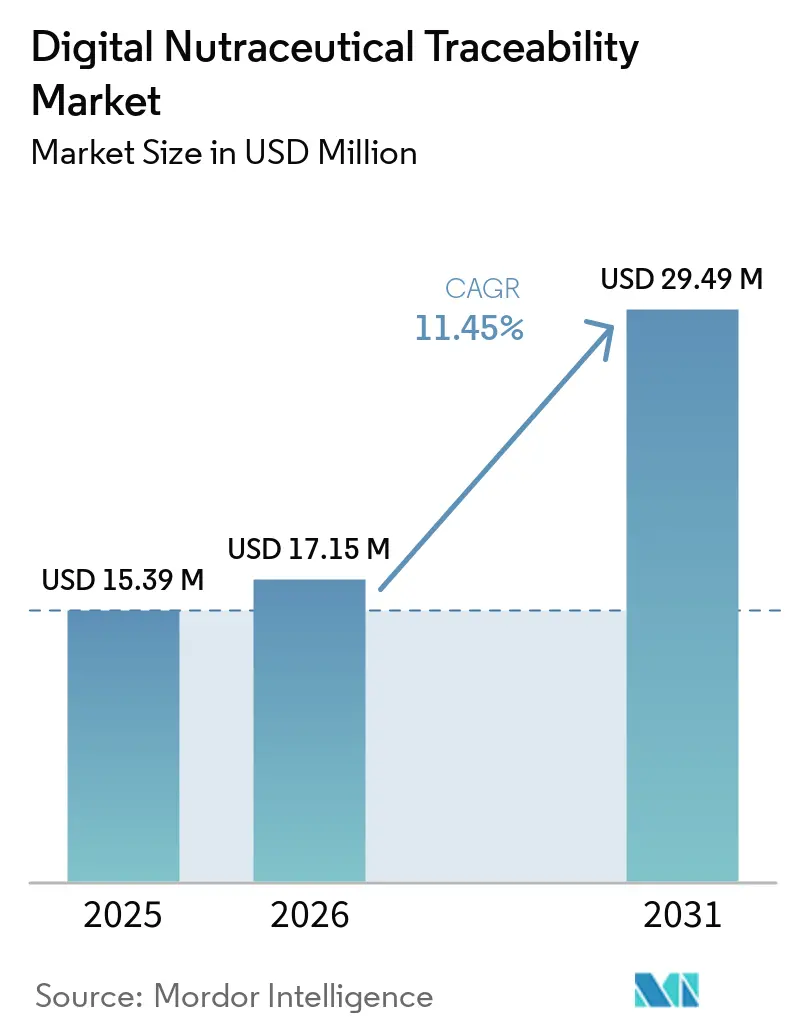
| Market Size (2026) | USD 17.15 Million |
| Market Size (2031) | USD 29.49 Million |
| Growth Rate (2026 - 2031) | 11.45% CAGR |
| Fastest Growing Market | Asia-Pacific |
| Largest Market | North America |
| Market Concentration | Medium |
Major Players *Disclaimer: Major Players sorted in no particular order Image © Mordor Intelligence. Reuse requires attribution under CC BY 4.0. | |
Digital Nutraceutical Traceability Market Analysis by Mordor Intelligence
The Digital Nutraceutical Traceability Market size is expected to grow from USD 15.39 million in 2025 to USD 17.15 million in 2026 and is forecast to reach USD 29.49 million by 2031 at 11.45% CAGR over 2026-2031.
Rising regulatory pressures and increasing challenges in managing ingredient fraud are driving market growth. In September 2024, the Botanical Adulterants Prevention Program reported adulteration rates of 56.7% for ginkgo leaf extract, 42.2% for black cohosh, and 28.5% for echinacea root, significantly increasing sourcing risks for nutraceutical brands. In 2025, the Food Authenticity Network recorded 172 global food fraud cases linked to food supplements, emphasizing the need for automated certificate of analysis reviews and lot-code verifications across supplier networks. Retailer-driven compliance demands, which often outpace public enforcement timelines, are shaping the digital nutraceutical traceability market. Vendors are addressing these demands by integrating supplier onboarding, document capture, recall execution, provenance validation, and cloud-based collaboration into a unified operational framework.
Key Report Takeaways
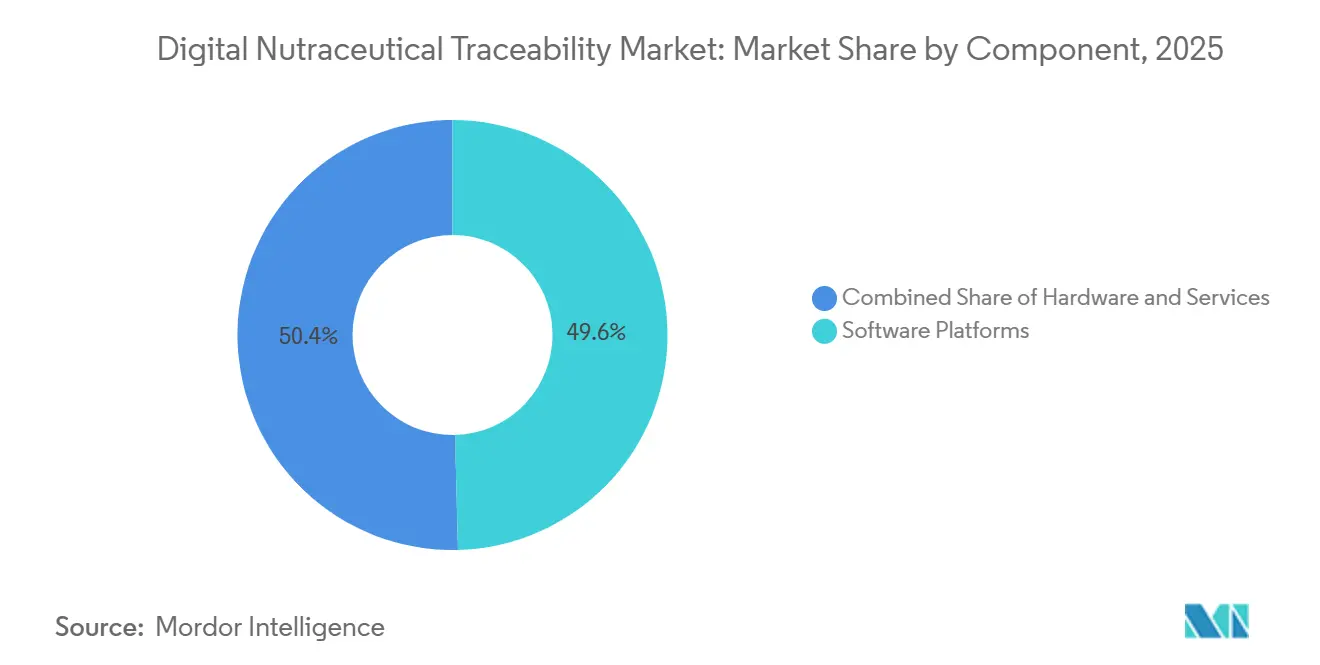
- By component, software platforms held 49.60% share in 2025, while services are projected to grow at a 12.24% CAGR during 2026-2031.
- By deployment mode, Cloud / SaaS held 52.66% share in 2025 and is also projected to grow at a 12.76% CAGR during 2026-2031.
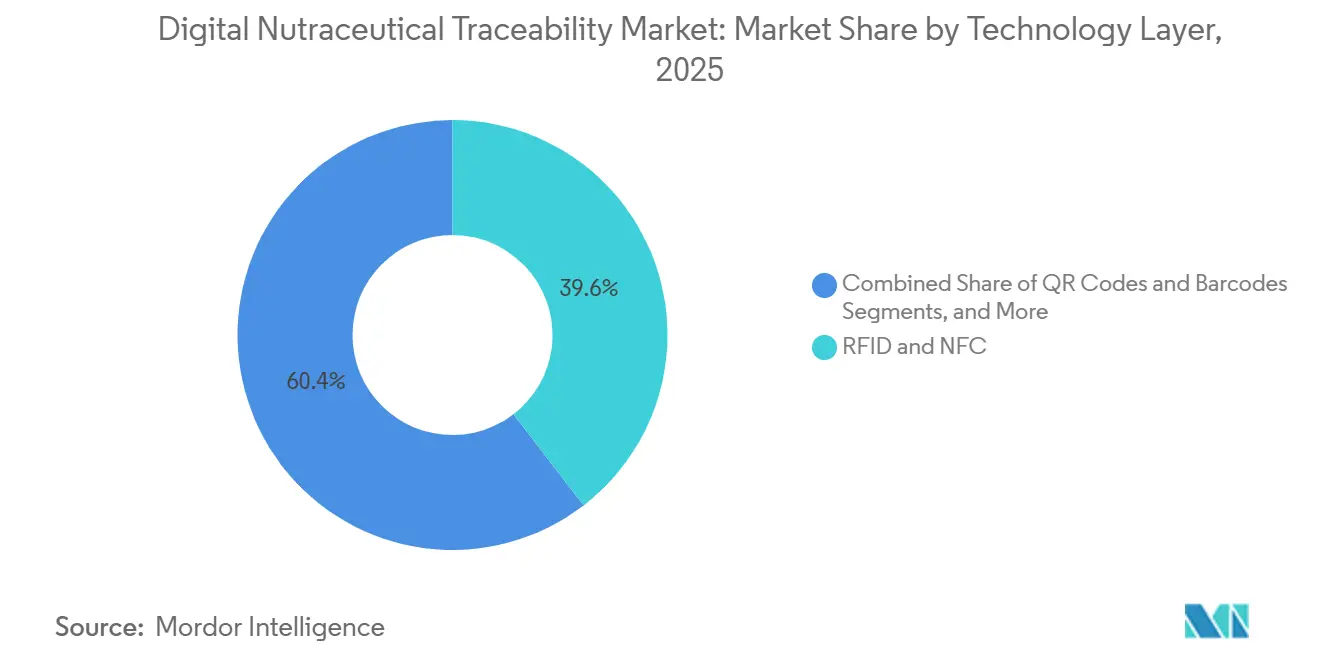
- By technology layer, RFID & NFC held 39.56% share in 2025, while blockchain & distributed ledger is projected to grow at a 14.67% CAGR during 2026-2031.
- By traceability level, batch / lot-level traceability held 46.5% share in 2025, while Ingredient-level traceability is projected to expand at a 13.78% CAGR during 2026-2031.
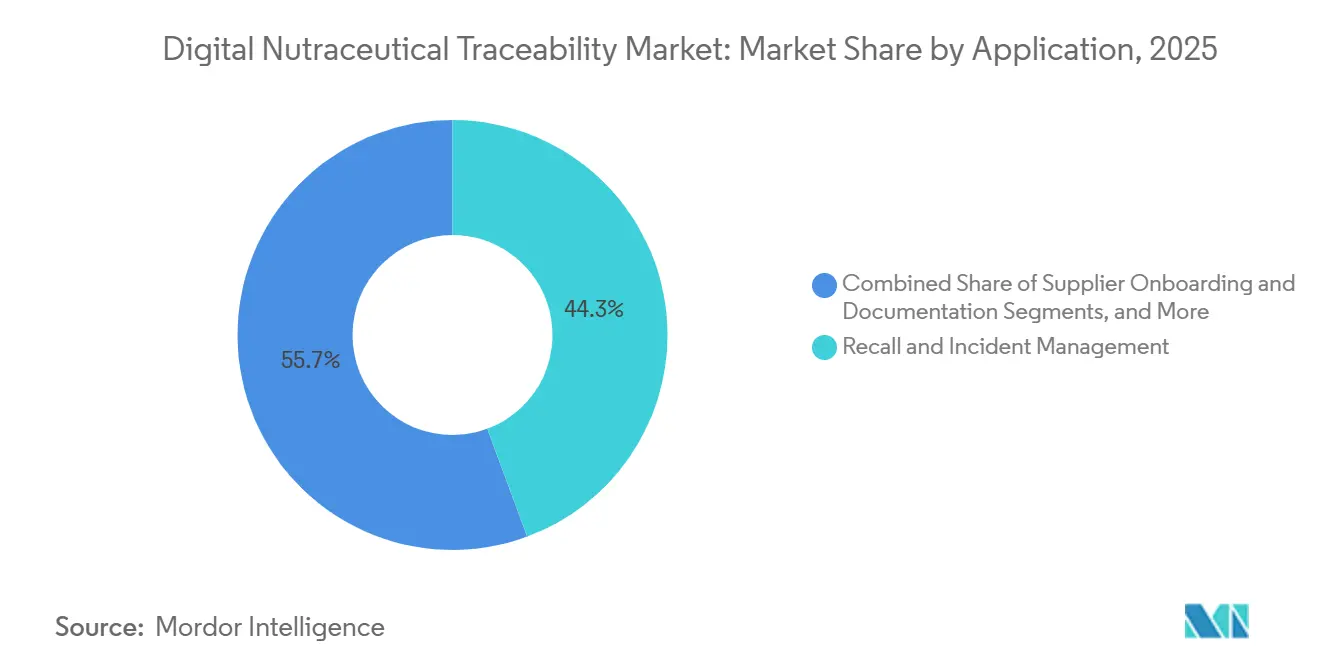
- By application, recall & incident management held 44.34% share in 2025, while quality, COA & compliance management is projected to expand at a 13.88% CAGR during 2026-2031.
- By end user, nutraceutical brand owners accounted for 55.12% share in 2025, while ingredient suppliers & distributors are projected to expand at a 14.38% CAGR during 2026-2031.
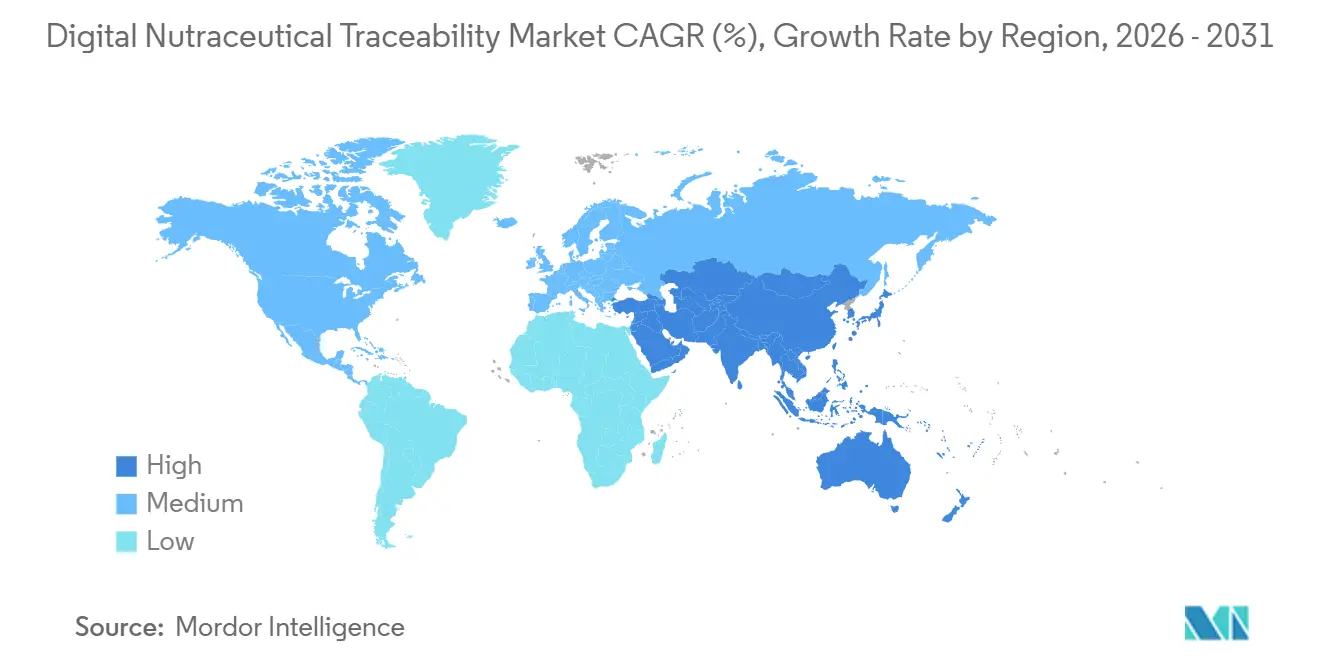
- By geography, North America held 40.77% share in 2025, while Asia-Pacific is projected to grow at a 14.45% CAGR during 2026-2031.
Note: Market size and forecast figures in this report are generated using Mordor Intelligence’s proprietary estimation framework, updated with the latest available data and insights as of January 2026.
Global Digital Nutraceutical Traceability Market Trends and Insights
Drivers Impact Analysis*
| DRIVER | (~) % IMPACT ON CAGR FORECAST | GEOGRAPHIC RELEVANCE | IMPACT TIMELINE |
|---|---|---|---|
| Counterfeit and adulteration exposure in botanicals | +2.8% | Global, concentrated in North America, EU, and APAC sourcing corridors | Short term (≤ 2 years) |
| Retailer and consumer demand for source transparency | +2.1% | North America and EU core, spill-over to APAC e-commerce channels | Medium term (2-4 years) |
| Cloud-native supplier-data networks and SaaS adoption | +1.8% | Global, led by North America and Western Europe | Medium term (2-4 years) |
| FSMA 204 spillover from fresh-form high-risk ingredients | +1.6% | United States primary, spill-over to US-exporting APAC and South American suppliers | Medium term (2-4 years) |
| COA digitization cuts release delays for multi-supplier botanicals | +1.4% | North America and EU, with early gains in India and Australia | Short term (≤ 2 years) |
| Proof-of-origin supports premium pricing | +1.2% | EU and North America premium supplement channels | Long term (≥ 4 years) |
| Source: Mordor Intelligence | |||
Counterfeit and Adulteration Exposure in Botanicals
The digital nutraceutical traceability market is addressing the growing issue of botanical adulteration as brands demand verified origin and content. A 2024 review revealed significant adulteration rates in high-demand botanicals, prompting a reassessment of supplier risks. Certified suppliers showed lower adulteration rates compared to open-market purchases, highlighting the value of traceability investments. Additionally, cases like echinacea substitution raised compliance and identity concerns, driving demand for integrated traceability systems.
Retailer and Consumer Demand for Source Transparency
Retailers are accelerating source transparency requirements, with major players implementing lot-code transmission mandates ahead of deadlines. This shift makes lot-code visibility a commercial necessity for nutraceutical brands. European regulations are also increasing source-evidence expectations for supplement brands. As a result, QR codes linking to traceability data are becoming standard in botanical-heavy categories like sports nutrition and immune health.
Cloud-Native Supplier-Data Networks and SaaS Adoption
Cloud-native supplier-data networks are streamlining document collection and reducing redundancies across brand-owner relationships. Platforms like TraceGains enable suppliers to support multiple customers efficiently, enhancing adoption in fragmented markets. Recent acquisitions and advancements in blockchain technology further validate the SaaS network model's commercial strength, driving the market toward collaborative data environments.
FSMA 204 Spillover From Fresh-Form High-Risk Ingredients
The FSMA 204 extension to 2028 is indirectly impacting the digital nutraceutical traceability market as retailers enforce similar requirements earlier. Suppliers are adapting to meet these demands, with some joining traceability networks to comply with lot-code data expectations.[1]Congressional Research Service, “The Food and Drug Administration’s Food Traceability Rule, Overview and Issues for Congress,” Congressional Research Service, everycrsreport.com The FDA's ongoing engagement in shaping implementation standards continues to attract investments in traceability solutions, particularly from firms aligned with FSMA-style data exchange practices.[2]U.S. Food and Drug Administration, “FSMA Final Rule on Requirements for Additional Traceability Records for Certain Foods,” FDA, fda.gov
Restraints Impact Analysis*
| RESTRAINT | (~) % IMPACT ON CAGR FORECAST | GEOGRAPHIC RELEVANCE | IMPACT TIMELINE |
|---|---|---|---|
| Integration cost burden for SMEs and legacy ERP stacks | -1.5% | Global, disproportionate in South America, MEA, and South Asia | Medium term (2-4 years) |
| Fragmented supplier master data and COA interoperability gaps | -1.2% | Global, most acute where botanical sourcing spans emerging-market farms | Medium term (2-4 years) |
| Partial FSMA 204 exemption weakens short-term ROI urgency | -0.9% | United States | Short term (≤ 2 years) |
| Reformulation and private-label churn strain master-data upkeep | -0.7% | North America and EU, concentrated in fast-cycling e-commerce channels | Medium term (2-4 years) |
| Source: Mordor Intelligence | |||
Integration Cost Burden for SMEs and Legacy ERP Stacks
The digital nutraceutical traceability market faces adoption challenges due to uneven implementation costs across company sizes. Blockchain and IoT supply-chain deployments require significantly higher initial investments compared to traditional ERP systems. Larger operators achieve breakeven in 3.2 years, while smaller players take 11.7 years, delaying adoption among smaller suppliers. Legacy ERP systems often need custom adapters, increasing costs and risks for budget-constrained nutraceutical processors. This dynamic drives market growth but slows conversion rates among fragmented mid-market suppliers.
Fragmented Supplier Master Data and COA Interoperability Gaps
Fragmented supplier master data and inconsistent COA formats hinder the digital nutraceutical traceability market. High traceability-record error rates, caused by missing lot codes and non-standard document structures, reduce platform efficiency during regular supplier operations. GDPR compliance challenges in the EU have led to pseudonymized structures and zero-knowledge proofs, increasing latency. Without universal standards for lot codes and supplier identities, seamless data exchange remains a challenge, requiring foundational improvements in supplier data and document standardization.
*Our forecasts treat driver/restraint impacts as directional, not additive. The impact forecasts reflect baseline growth, mix effects, and variable interactions.
Segment Analysis
By Component, Software Platforms Anchor Revenue While Services Scale
In 2025, Software Platforms accounted for 49.60% of the market share, highlighting their role in consolidating workflows like certificate of analysis management, supplier onboarding, recall support, and document control. This preference reflects the demand for integrated systems that reduce operational fragmentation. Vendors with robust integration capabilities maintain a competitive edge by minimizing handoffs across compliance teams.
Services are projected to grow at a 12.24% CAGR from 2026 to 2031, driven by complex implementations, legacy ERP migrations, and ongoing compliance support. Vendors are increasingly bundling advisory and operational services with traceability platforms to enhance value. Hardware remains the smallest segment but benefits from upgrades in barcode and RFID workflows to meet retailer requirements. The market is shifting toward a hybrid revenue model where software anchors accounts, and services drive deeper engagement.


By Deployment Mode, Cloud / SaaS Reinforces Network Advantage
Cloud / SaaS led with 52.66% of deployment revenue in 2025, driven by its ability to support shared supplier networks. This model improves document completeness and reduces redundant efforts, particularly in supply chains where suppliers serve multiple buyers. Its structural advantages make it the preferred choice for enhancing collaboration and control.
Cloud / SaaS is expected to grow at a 12.76% CAGR from 2026 to 2031, maintaining its leadership. Hybrid deployments remain relevant for enterprises integrating legacy ERP systems with cloud networks. On-premises solutions are still used in regions with data-residency or governance constraints. However, the market continues to favor hosted platforms as supplier network participation increases.
By Technology Layer, RFID Dominant but Blockchain Reshaping Provenance Authentication
RFID & NFC held 39.56% of revenue in 2025, reflecting their established role in tracking physical movements, shipment handling, and goods receipt verification. Their widespread adoption in nutraceutical operations provides immediate visibility without requiring significant operational changes.
Blockchain & Distributed Ledger is projected to grow at a 14.67% CAGR from 2026 to 2031, driven by the need for provenance tools to support ingredient authenticity. AI & Advanced Analytics are also gaining traction, automating anomaly detection and reducing repetitive quality checks. Buyers are layering these technologies alongside RFID for enhanced identity assurance.
By Traceability Level, Batch / Lot Dominates While Ingredient-Level Gains Fastest
Batch / Lot-level traceability accounted for 46.5% of the market share in 2025, aligning with established recall protocols and production workflows. Its compatibility with FSMA, ISO, and cGMP standards makes it a practical starting point for digital traceability adoption.
Ingredient-level traceability is expected to grow at a 13.78% CAGR from 2026 to 2031, addressing the limitations of batch-level tracking in complex supply chains. Item-level and unit-level traceability are gaining traction in e-commerce and direct-to-consumer channels, while case and pallet-level tracking remains essential for logistics. The market is enhancing visibility without abandoning batch controls.
By Application, Recall Management Leads While COA and Compliance Gain Momentum
Recall & Incident Management led with 44.34% of application revenue in 2025, as companies prioritize traceability investments to mitigate regulatory, financial, and reputational risks. Recall readiness remains the primary entry point for platform adoption.
Quality, COA & Compliance Management is projected to grow at a 13.88% CAGR from 2026 to 2031, driven by the operational challenges of managing multi-supplier networks. Batch Genealogy & Production Traceability is also expanding as buyers seek systems that prevent quality failures upstream. The application mix is shifting from reactive incident control to proactive quality management.
By End User, Brand Owners Lead While Ingredient Distributors Accelerate
In 2025, Nutraceutical Brand Owners held a 55.12% market share, reflecting their focus on consumer trust, retailer accountability, and product liability. They remain the primary buyers of integrated traceability systems to manage supplier documentation, quality reviews, and recalls.
Ingredient Suppliers & Distributors are expected to grow at a 14.38% CAGR from 2026 to 2031, driven by the need to provide compliant data proactively. Contract Manufacturers and CDMOs are also growing rapidly, requiring platforms to manage parallel COA obligations. Retail and e-commerce users are selectively investing in transparency and category management, signaling a broader distribution of traceability responsibilities.
Geography Analysis
In 2025, North America held a 40.77% share of the digital nutraceutical traceability market, driven by federal traceability requirements and retailer-enforced lot-code mandates in the United States. Although the FDA extended the FSMA 204 compliance deadline to July 20, 2028, major retail channels required earlier action. Walmart's GS1-128 case-level mandate in August 2025 accelerated adoption among suppliers, while ReposiTrak's 2026 announcement of seamless supplier-to-store traceability highlighted a low-friction deployment model.
Europe maintained a significant market share in 2025, with Germany, the U.K., France, Italy, and Spain contributing the most revenue. The region's focus on stricter botanical ingredient oversight, sustainability regulations, and documentation quality continues to shape the market. The EU's deforestation regulation, postponed to December 30, 2026, has increased due-diligence requirements, while European buyers are increasingly adopting AI in traceability systems to enhance anomaly detection and prevent botanical fraud.
The Middle East & Africa and South America were in early development stages in 2025 but showed signs of infrastructure growth. The GCC's serialization experience is enabling digital traceability adoption in nearby nutraceutical sectors. Brazil's expanding nutraceutical exports are driving demand for systems that improve provenance and lot visibility. Antares Vision Group reported a 62.2% year-on-year revenue increase in Africa and the Middle East for the first nine months of 2025, reflecting rising investments in serialization-related technologies.

Competitive Landscape
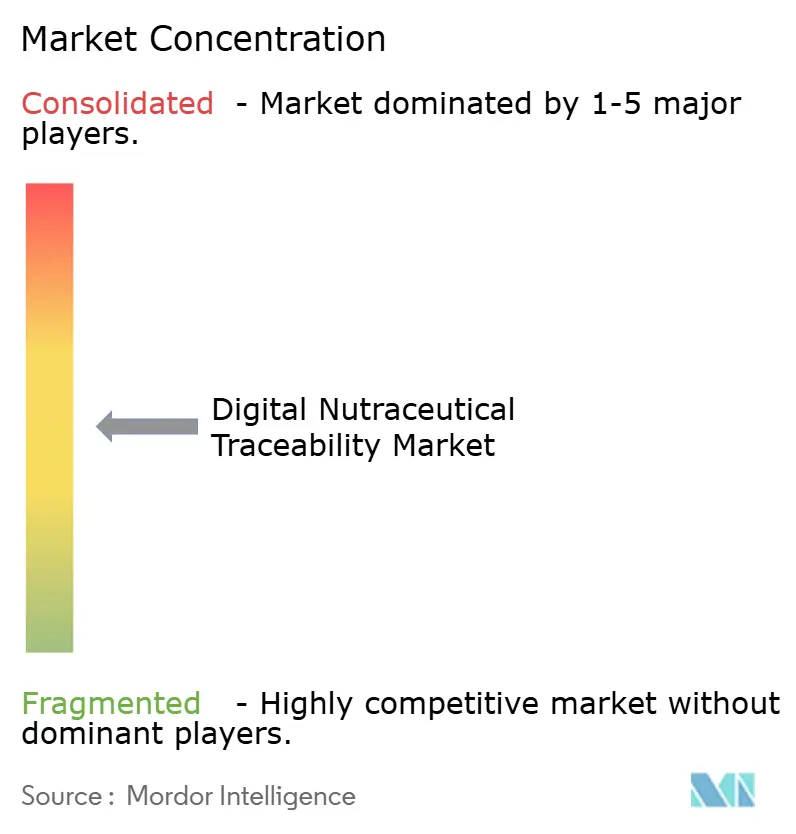
The digital nutraceutical traceability market features a concentrated upper tier alongside a broader mid-tier of specialized providers. Leading platforms like TraceGains, Trustwell, and ReposiTrak compete on supplier scale, document automation, and interoperability. Veralto's USD 350 million acquisition of TraceGains in October 2024 highlighted the value of recurring supplier-network software. By September 2025, TraceGains expanded its network to 100,000 global supplier locations and over 10 million live compliance documents, reinforcing its leadership in supplier-document workflows. This scale enhances network effects, making it difficult for single-enterprise systems to compete.
Antares Vision Group has positioned itself strategically by integrating serialization and enterprise supply-chain transparency. In February 2026, the company received a mandatory public tender offer from Crane NXT Inspection and Tracking Technologies S.p.A., marking a significant competitive move. Additionally, Antares reported a 137% year-on-year increase in Supply Chain Transparency orders in FY 2025, demonstrating strong demand from large enterprise contracts. This segment focuses on serialization, contract renewals, and infrastructure continuity for major accounts.
ReposiTrak differentiates itself with low-friction onboarding and touchless data reconstruction, addressing deployment challenges. Its February 2026 patent-pending Touchless Traceability and error-correction capabilities target record error rates of 40% without requiring warehouse management system changes. Opportunities remain in ingredient-level provenance for high-risk botanicals and middleware connecting legacy ERP systems with cloud supplier networks. Trustwell emphasizes service depth through its platform and consulting extensions, catering to clients needing both technology and implementation support. While the market has a clear leadership tier, competition persists as buyers seek tailored solutions combining network scale, implementation assistance, and technical flexibility.
Digital Nutraceutical Traceability Industry Leaders
Aptean
Antares Vision Group
Covectra
OPTEL
TE-FOOD
- *Disclaimer: Major Players sorted in no particular order

Recent Industry Developments
- April 2026: ReposiTrak enabled a wholesale grocery cooperative in the Southern U.S. to achieve full FSMA 204 traceability from supplier to store using its Touchless Traceability platform, eliminating distribution-center scanning and providing a model for other wholesalers.
- February 2026: ReposiTrak obtained its second patent-pending status for Touchless Traceability, a feature of its Enterprise Platform that automates FDA-compliant KDE lot-code chain reconstruction without requiring warehouse management system changes.
- October 2025: Natural Trace presented its advanced in-product tagging technology at SupplySide Global 2025, Booth #921. This innovative platform is transforming how nutraceutical and ingredient brands ensure product authenticity, protect intellectual property, and enhance consumer trust across global supply chains.


Global Digital Nutraceutical Traceability Market Report Scope
As per the scope of the report, digital nutraceutical traceability is the use of connected digital systems, such as blockchain, IoT sensors, and serialization, to track dietary supplements and health products across the entire supply chain. It provides transparent, end-to-end visibility from the source of raw materials to the final consumer.
| Software Platforms |
| Hardware |
| Services |
| Cloud / SaaS |
| Hybrid |
| On-premises |
| QR Codes & Barcodes |
| RFID & NFC |
| Blockchain & Distributed Ledger |
| IoT & Sensor Monitoring |
| AI & Advanced Analytics |
| DNA / Molecular Tagging |
| Ingredient-level |
| Batch / Lot-level |
| Item-level / Unit-level |
| Case / Pallet-level |
| Supplier Onboarding & Documentation |
| Batch Genealogy & Production Traceability |
| Quality, COA & Compliance Management |
| Recall & Incident Management |
| Anti-counterfeiting & Consumer Verification |
| Inventory, Shelf-life & Condition Monitoring |
| Nutraceutical Brand Owners |
| Contract Manufacturers & CDMOs |
| Ingredient Suppliers & Distributors |
| Retail & E-commerce |
| Third-party Testing & Certification Labs |
| North America | United States |
| Canada | |
| Mexico | |
| Europe | Germany |
| United Kingdom | |
| France | |
| Italy | |
| Spain | |
| Rest of Europe | |
| Asia-Pacific | China |
| India | |
| Japan | |
| South Korea | |
| Australia | |
| Rest of Asia-Pacific | |
| Middle East and Africa | GCC |
| South Africa | |
| Rest of Middle East and Africa | |
| South America | Brazil |
| Argentina | |
| Rest of South America |
| By Component | Software Platforms | |
| Hardware | ||
| Services | ||
| By Deployment Mode | Cloud / SaaS | |
| Hybrid | ||
| On-premises | ||
| By Technology Layer | QR Codes & Barcodes | |
| RFID & NFC | ||
| Blockchain & Distributed Ledger | ||
| IoT & Sensor Monitoring | ||
| AI & Advanced Analytics | ||
| DNA / Molecular Tagging | ||
| By Traceability Level | Ingredient-level | |
| Batch / Lot-level | ||
| Item-level / Unit-level | ||
| Case / Pallet-level | ||
| By Application | Supplier Onboarding & Documentation | |
| Batch Genealogy & Production Traceability | ||
| Quality, COA & Compliance Management | ||
| Recall & Incident Management | ||
| Anti-counterfeiting & Consumer Verification | ||
| Inventory, Shelf-life & Condition Monitoring | ||
| By End User | Nutraceutical Brand Owners | |
| Contract Manufacturers & CDMOs | ||
| Ingredient Suppliers & Distributors | ||
| Retail & E-commerce | ||
| Third-party Testing & Certification Labs | ||
| By Geography | North America | United States |
| Canada | ||
| Mexico | ||
| Europe | Germany | |
| United Kingdom | ||
| France | ||
| Italy | ||
| Spain | ||
| Rest of Europe | ||
| Asia-Pacific | China | |
| India | ||
| Japan | ||
| South Korea | ||
| Australia | ||
| Rest of Asia-Pacific | ||
| Middle East and Africa | GCC | |
| South Africa | ||
| Rest of Middle East and Africa | ||
| South America | Brazil | |
| Argentina | ||
| Rest of South America | ||


Key Questions Answered in the Report
What is the 2026 size of the digital nutraceutical traceability market?
The digital nutraceutical traceability market stands at USD 17.15 billion in 2026 and is projected to reach USD 29.49 billion by 2031 at an 11.45% CAGR.
Which region leads digital nutraceutical traceability adoption?
North America led with 40.77% share in 2025, supported by FDA oversight and retailer-level lot-code requirements.
Which region is growing the fastest in digital nutraceutical traceability?
Asia-Pacific is the fastest-growing region with a forecast CAGR of 14.45% during 2026-2031.
Which end-user group spends the most on digital nutraceutical traceability solutions?
Nutraceutical Brand Owners held the largest share at 55.12% in 2025 because they carry the main compliance and liability burden.
Which technology is growing the fastest for nutraceutical traceability systems?
Blockchain & Distributed Ledger is the fastest-growing technology layer with a 14.67% CAGR during 2026-2031, while RFID & NFC remained the largest in 2025.
Why are companies investing more in traceability tools for nutraceuticals?
Investment is rising because of botanical adulteration, 172 food supplement fraud reports in 2025, stronger retailer requirements, and the need for faster COA and lot-code verification.
Page last updated on:


