Nutrigenomics Market Size and Share
Market Overview
| Study Period | 2020 - 2031 |
|---|---|
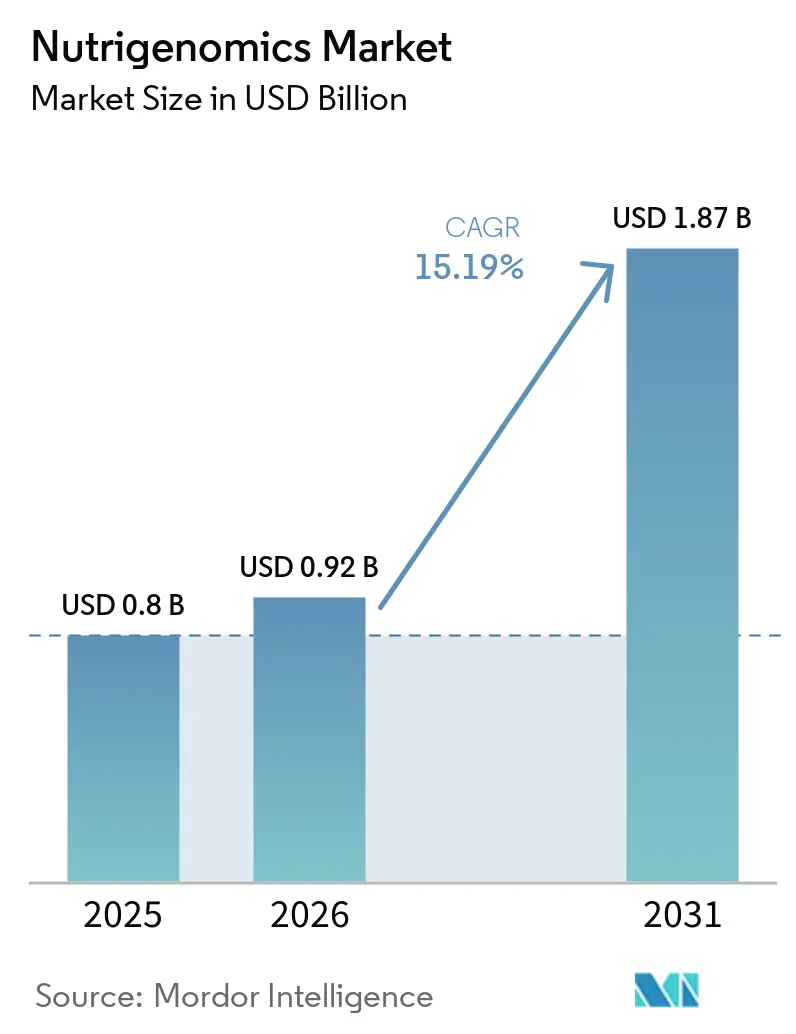
| Market Size (2026) | USD 0.92 Billion |
| Market Size (2031) | USD 1.87 Billion |
| Growth Rate (2026 - 2031) | 15.19% CAGR |
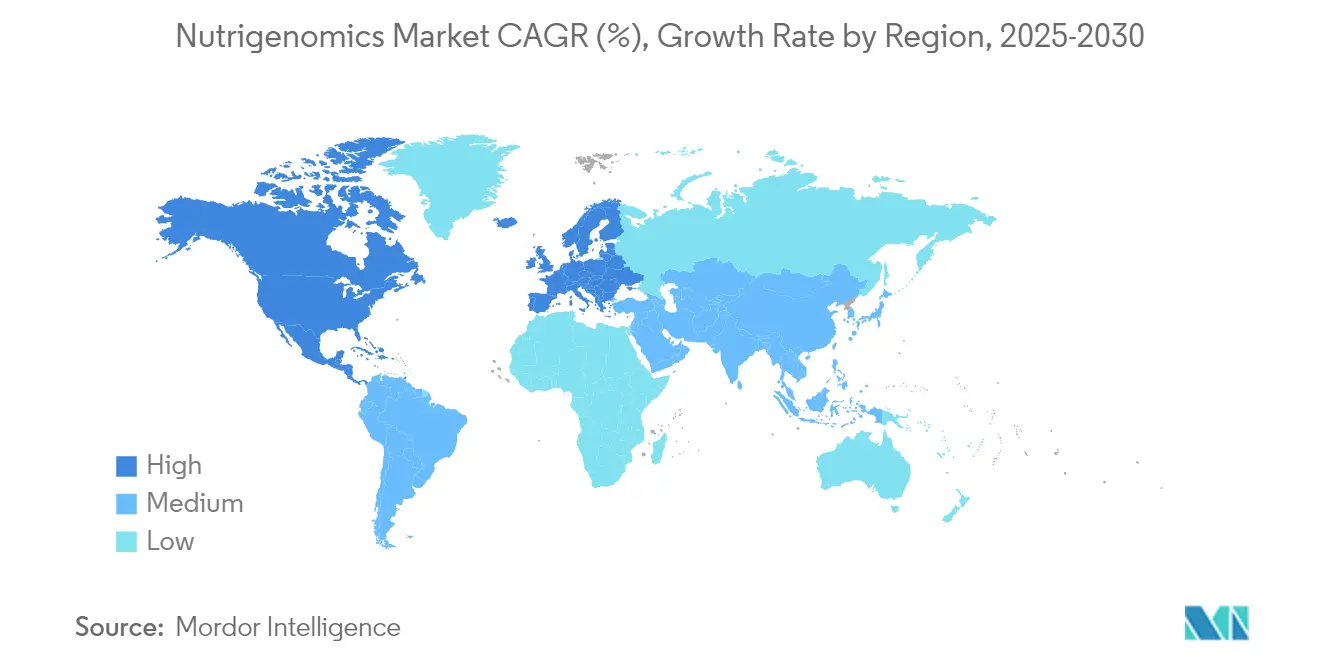
| Fastest Growing Market | Asia Pacific |
| Largest Market | North America |
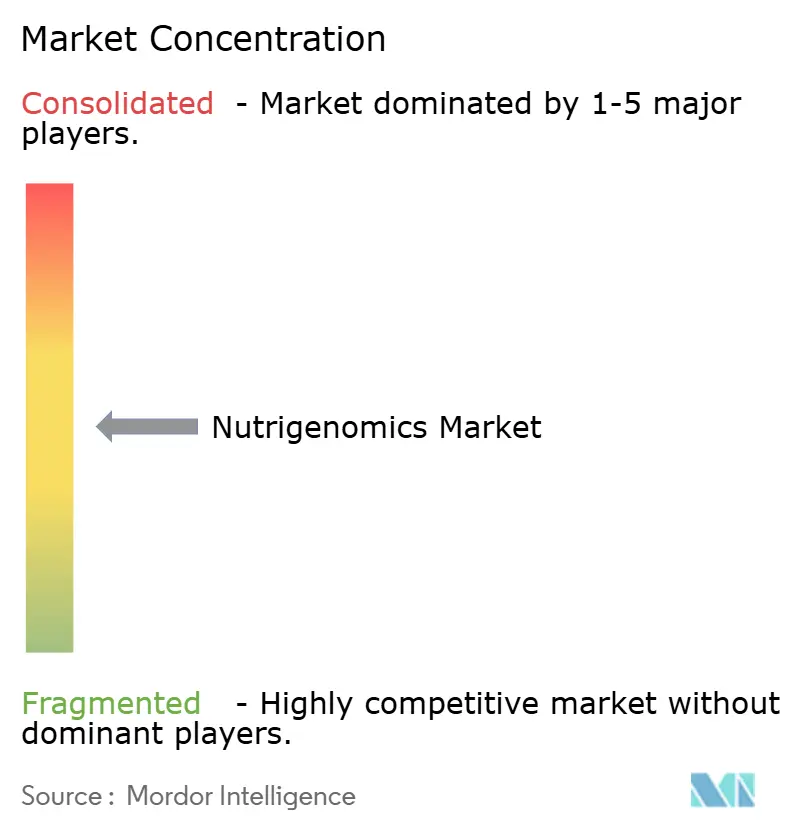
| Market Concentration | Medium |
Major Players *Disclaimer: Major Players sorted in no particular order Image © Mordor Intelligence. Reuse requires attribution under CC BY 4.0. | |
Nutrigenomics Market Analysis by Mordor Intelligence
Nutrigenomics market size in 2026 is estimated at USD 0.92 billion, growing from 2025 value of USD 0.80 billion with 2031 projections showing USD 1.87 billion, growing at 15.19% CAGR over 2026-2031. Genome-sequencing costs have fallen from USD 100 million in 2001 to USD 600 in 2025, unlocking mainstream access to gene-based nutrition services. Direct-to-consumer vendors capitalize on this price collapse, while employers and insurers push preventive programs to curb chronic disease spending. Vitamins and minerals products defend category leadership, yet rapid growth in microbiome-based probiotics signals an industry pivot toward gut-centric personalization. Geographically, North America anchors demand, but Asia Pacific delivers the fastest growth as mobile-first health platforms scale across large middle-class populations.
Key Report Takeaways
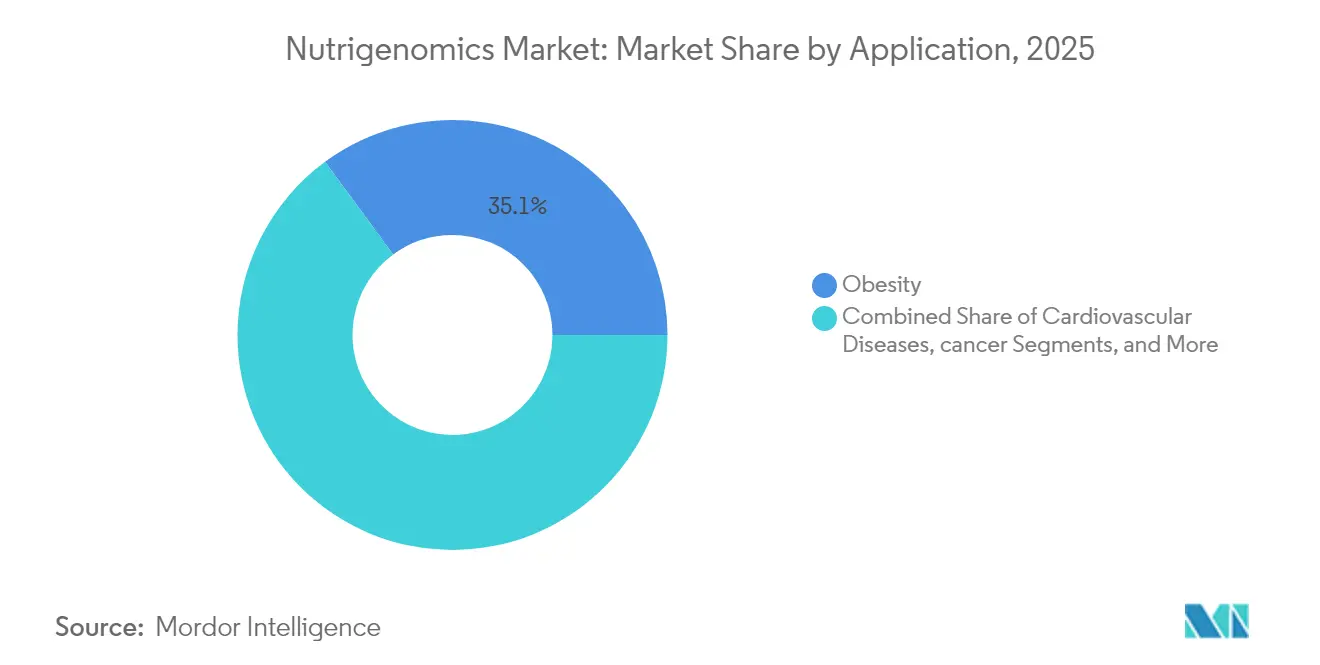
- By application, obesity accounted for 35.10% of the nutrigenomics market share in 2025; cancer research applications are projected to expand at a 12.55% CAGR to 2031.
- By product, vitamins and minerals led with 30.85% revenue share in 2025, while probiotics and prebiotics are advancing at a 12.18% CAGR through 2031.
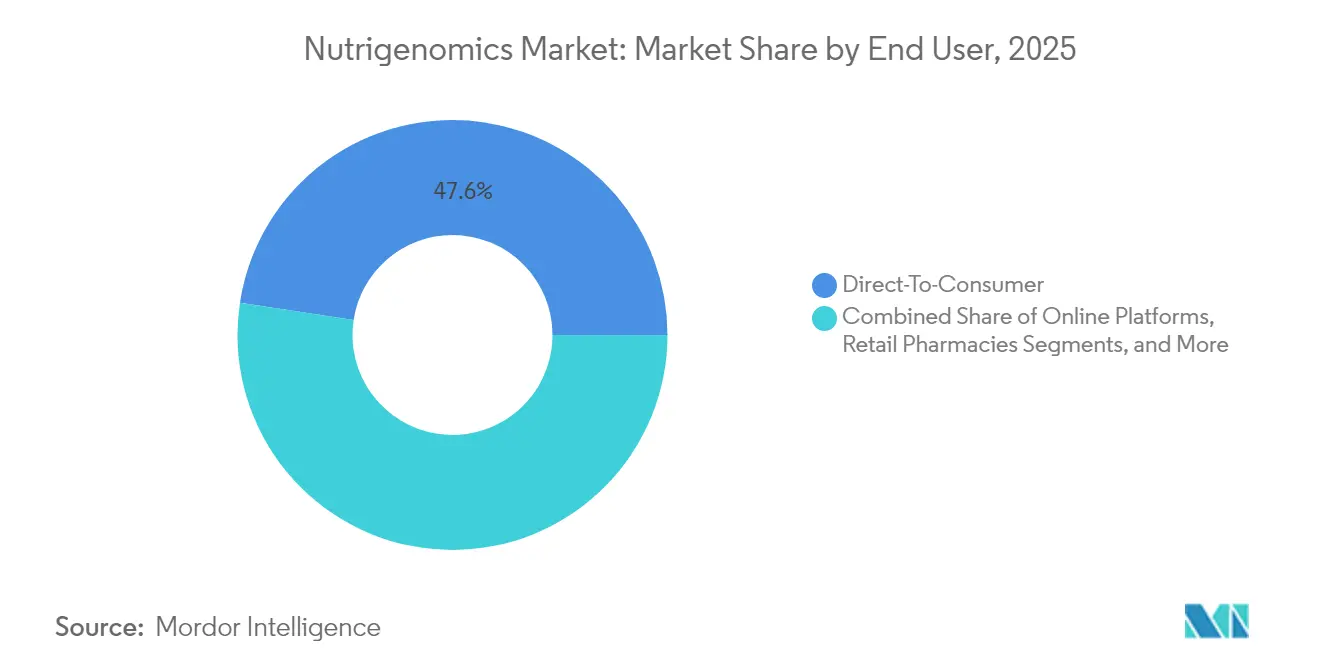
- By end-user, the direct-to-consumer segment held 47.60% Nutrigenomics market share in 2025 and is growing at a 16.4% CAGR through 2031.
- By distribution channel, online platforms commanded 52.10% of the Nutrigenomics market size in 2025 and are scaling at a 17.1% CAGR to 2031.
- By geography, North America contributed 39.10% of global revenue in 2025; Asia Pacific is expanding at a 13.42% CAGR over the forecast period.
Note: Market size and forecast figures in this report are generated using Mordor Intelligence’s proprietary estimation framework, updated with the latest available data and insights as of 2026.
Global Nutrigenomics Market Trends and Insights
Drivers Impact Analysis*
| Driver | (~) % Impact on CAGR Forecast | Geographic Relevance | Impact Timeline |
|---|---|---|---|
| Growing Burden Of Lifestyle-Related Chronic Diseases | +3.20% | Global, with concentration in North America & Europe | Long term (≥ 4 years) |
| Declining Costs Of Next-Generation Sequencing Technologies | +2.80% | Global, with early adoption in developed markets | Medium term (2-4 years) |
| Expanding Consumer Awareness Of Gene–Diet Interactions | +2.10% | North America & EU leading, APAC emerging | Medium term (2-4 years) |
| Proliferation Of Digital Health Platforms Integrating Nutrigenomic Data | +1.90% | Global, with mobile-first adoption in APAC | Short term (≤ 2 years) |
| Strategic Alliances Between Nutraceutical, Biotech, And Big-Data Companies | +1.70% | North America & Europe core, expanding globally | Medium term (2-4 years) |
| Employer And Insurer Adoption Of Preventive Nutrition Genomics Programs | +1.40% | North America leading, gradual EU adoption | Long term (≥ 4 years) |
| Source: Mordor Intelligence | |||
Growing Burden of Lifestyle-Related Chronic Diseases
Diet-linked illnesses now command most healthcare budgets, prompting payers to explore prevention. The NIH allocated USD 156 million to a precision-nutrition study covering 10,000 participants to map gene–microbiome interactions.[1]National Institutes of Health, “Nutrition for Precision Health Initiative,” nih.gov Early findings show FADS1 variants alter omega-3 response, supporting targeted supplementation. Health systems increasingly position the Nutrigenomics market as a scalable tool for delaying diabetes onset in pre-diabetic groups. Employers finance genetic-guided meal plans to reduce absenteeism, while insurers pilot premium discounts tied to personalized nutrition adherence. These initiatives elevate demand for clinically validated platforms that translate gene data into actionable diet protocols.
Declining Costs of Next-Generation Sequencing Technologies
Whole-genome sequencing fell from USD 10,000 to USD 600 within a decade, and industry roadmaps forecast sub-USD 100 tests before 2030.[2]U.S. Food and Drug Administration, “Dietary Supplement Regulatory Framework,” fda.gov Third-generation instruments yield longer reads and minimize amplification bias, increasing accuracy for genes governing methylation, lipid uptake, and caffeine metabolism. Lower barriers let vendors bundle broad polygenic risk scores into subscription services, expanding the Nutrigenomics market’s addressable base beyond fitness enthusiasts to mainstream wellness consumers. Seamless integration with continuous glucose monitors and microbiome assays further differentiates offerings.
Expanding Consumer Awareness of Gene–Diet Interactions
Targeted education translates complex science into relatable benefits. A 2025 survey showed 97.2% of Indian dietitians felt confident discussing genetic testing in client consultations. Social-media campaigns featuring MTHFR-related homocysteine stories propel traffic to testing portals. Younger demographics regard gene reports as routine health checks rather than niche diagnostics, boosting repeat-purchase rates for subscription supplements. Brands leverage influencers to humanize dashboards, reinforcing the Nutrigenomics market as a lifestyle choice instead of a medical intervention.
Proliferation Of Digital Health Platforms Integrating Nutrigenomic Data
AI-driven nutrition apps now ingest gene panels, microbiome readouts, and real-time biometrics to generate adaptive diet plans. A six-week pilot reported significant gut-diversity gains and reduced inflammatory markers among app users.[3]Frontiers Media, “AI-Guided Personalized Nutrition Improves Gut Diversity,” frontiersin.org QR-code grocery integrations deliver shelf-level product guidance, transforming retail into personalized nutrition hubs. Wearable devices validate short-term biomarker improvements, feeding new data to refine algorithms. These iterations create stickiness that converts one-off test buyers into long-term platform subscribers, accelerating revenue compounds for the Nutrigenomics market.
Restraints Impact Analysis*
| Restraint | (~) % Impact on CAGR Forecast | Geographic Relevance | Impact Timeline |
|---|---|---|---|
| Lack Of Harmonized Global Regulatory Framework | -2.30% | Global, with varying intensity by region | Long term (≥ 4 years) |
| Limited Clinical Utility Evidence Supporting Nutrigenomic Recommendations | -1.80% | Global, particularly affecting clinical adoption | Medium term (2-4 years) |
| Rising Data-Privacy And Cybersecurity Concerns Around Genomic Databases | -1.50% | Global, with heightened focus in EU and North America | Medium term (2-4 years) |
| Low Physician Awareness And Education In Nutrigenomics Principles | -1.20% | Global, with regional variations in medical education | Long term (≥ 4 years) |
| Source: Mordor Intelligence | |||
Lack Of Harmonized Global Regulatory Framework
Divergent rules force companies to navigate multiple classifications. The FDA requires new dietary ingredient notifications, whereas the EU treats comparable products under food supplement codes. China layers functional-food and health-food dossiers, adding cost and time. Absence of mutual recognition triggers redundant trials, inflating R&D expenses that smaller entrants struggle to absorb. Compliance complexities can delay launches by 18-24 months, trimming the Nutrigenomics market’s near-term revenue potential but also rewarding early movers investing in robust governance systems.
Limited Clinical Utility Evidence Supporting Nutrigenomic Recommendations
Many diet-gene links rest on observational studies, prompting professional bodies to withhold blanket endorsement. Randomized trials like CAPFISH-3 are starting to bridge the gap by showing 15% reductions in cancer proliferation markers on genotype-matched omega-3 protocols vs 24% increases in controls. Until such results proliferate, physicians remain cautious, limiting insurance reimbursement. Vendors funding rigorous trials can convert evidence deficits into competitive moats once statistically significant outcomes surface.
*Our forecasts treat driver/restraint impacts as directional, not additive. The impact forecasts reflect baseline growth, mix effects, and variable interactions.
Segment Analysis
By Application: Obesity Dominance Drives Preventive Health Adoption
Obesity applications accounted for 35.10% of the nutrigenomics market share in 2025 as employers sought personalized diet programs to curb healthcare premiums. The segment’s sheer volume ensured that the Nutrigenomics market size for weight-management services surpassed USD 0.28 billion in 2025. Precision oncology, though smaller, is expanding at 12.55% CAGR because polygenic risk scores improve tumor-nutrient pathway targeting. Cardiovascular and metabolic disorder portfolios ride on well-validated lipid-gene correlations, while neurological research explores gut-brain mechanisms linking genotype to neurotransmitter synthesis.
Research momentum is moving from single-condition panels toward integrated tests covering obesity, cardiometabolic, and oncologic risks simultaneously. This cross-condition architecture boosts customer lifetime value by offering one report that informs multiple interventions. Evidence from CAPFISH-3 supporting gene-guided omega-3 regimens accelerates oncology-focused adoption among clinicians wary of anecdotal data. As clinical guidelines evolve, application diversification is poised to fortify overall Nutrigenomics market resilience against reimbursement shocks.


By Product: Vitamins Leadership Faces Microbiome Challenge
Vitamins and minerals led with 30.85% revenue share in 2025, owing to established consumer trust and streamlined regulatory pathways. Segment revenue equated to 38% of the Nutrigenomics market size for finished products. Probiotics and prebiotics capture growth at 12.18% CAGR as metagenomic studies validate gene–microbiome synergies. Protein and amino acid formulations benefit from active-aging trends, whereas phytochemicals gain attention for epigenetic modulation potential.
Product innovation is tilting toward multi-compound blends that address clusters of genetic variants instead of one-nutrient solutions. DSM-Firmenich’s Humiome line, which pairs probiotics with postbiotics, exemplifies the shift toward gut-centric personalization. AI formulation engines now optimize micronutrient ratios to match individual polymorphism profiles, creating bespoke supplement schemes shipped monthly. These developments broaden differentiation levels within the Nutrigenomics industry while raising expectations for scientific substantiation.
By End-User: Direct-to-Consumer Disrupts Traditional Healthcare Channels
Direct-to-consumer players held 47.60% Nutrigenomics market share in 2025 as privacy-minded consumers bypassed clinics for at-home saliva kits. Hospitals and clinics still command trust for high-risk patients, but grow more slowly because reimbursement remains patchy. Research institutes underpin validation trials, whereas pharma uses gene-nutrition insights to stratify patients for drug studies.
The D2C model is evolving into subscription ecosystems bundling test refreshes, continuous biomarker monitoring, and auto-replenished supplements. Viome’s EUR 26 million revenue milestone highlights global appetite when digital marketing meets strong scientific narratives. Hybrid gyms and diet centers are adopting white-label gene panels to personalize workout and meal plans, reinforcing channel convergence around holistic lifestyle coaching.
By Distribution Channel: Online Platforms Reshape Market Access
Online platforms captured 52.10% of the nutrigenomics market size in 2025 due to convenience and discreet purchasing behavior. Direct sales remain vital for premium consultative packages, while retail pharmacies authenticate offerings for hesitant shoppers. Healthcare-practitioner sales enable integration into preventive-care regimens, albeit slowed by evidence constraints.
E-commerce sophistication now extends to AI-chat widgets that decode raw gene files and cross-sell compatible products. Amazon’s healthcare ambitions could expose nutrigenomics to its massive Prime base, fast-tracking mainstream penetration. Mobile-first marketplaces dominate in Asia Pacific, where smartphone adoption outpaces desktop use, aligning perfectly with gene-based snack recommendations delivered via app notifications.
Geography Analysis
North America contributed 39.10% of 2025 revenue, anchored by clear FDA guidance and high discretionary income. United States operators such as 23andMe leverage a robust telehealth infrastructure to bundle genetic tests with GLP-1 weight-loss memberships, reinforcing recurring revenue loops. Canada emphasizes clinical-grade evidence, nudging vendors toward physician-partnered delivery models, while Mexico’s expanding middle class fuels cross-border D2C kit imports.
Asia Pacific recorded the fastest CAGR at 13.42%. China’s Healthy China 2030 blueprint funds precision nutrition pilots, and local giants use super-app ecosystems to push gene-driven meal kits at scale. India faces heterogeneous regulations yet shows strong practitioner interest, with nearly all surveyed dietitians keen to integrate genomic insights. Japan leverages its functional-food heritage to market genotype-specific fermented products, whereas South Korea’s anti-diabetes campaigns embrace gene-guided menu platforms. Despite regulatory patchwork, regional smartphone penetration and cultural openness to preventive health underpin sustained momentum for the Nutrigenomics market.
Europe presents a mature but meticulous environment. GDPR mandates data-governance thresholds, rewarding firms with transparent consent architectures. Germany and the United Kingdom lead uptake inside clinical settings, whereas Mediterranean countries leverage traditional diet research to contextualize gene advice. Mutual recognition across EU states simplifies product passporting, yet country-specific labeling nuances compel modular packaging strategies. The bloc’s insistence on randomized trials prolongs time-to-market but yields high consumer trust once approvals are obtained.

Competitive Landscape
The Nutrigenomics market displays moderate fragmentation, with established nutrition multinationals, genetic-testing pioneers, and AI software specialists occupying distinct niches. DSM-Firmenich capitalizes on ingredient science to supply white-label formulations, while 23andMe monetizes a 15-million-customer genomic database through Premium reports and a biopharma analytics platform. Start-ups such as GenoPalate carve grocery partnerships that bring gene-optimized food choices directly to shelves.
Vertical integration is accelerating. Herbalife’s USD 25–30 million acquisition spree across Pro2col Health, Pruvit Ventures, and Link BioSciences adds biometric analysis and custom manufacturing to its shake portfolio. Ingredient suppliers secure AI-algorithm teams to shift from bulk commodity sales to personalized sachets, capturing higher margins. Patent filings concentrate on variant-interpretation engines and micro-batch encapsulation processes, signalling tightening intellectual-property fences.
Strategic alliances define differentiation. Unilever Ventures invested in gummy specialist Create Wellness to expand functional formats, and Louis Dreyfus Company bought BASF’s ingredients unit to marry agri-supply scale with bioactive nutrition. As evidence thresholds rise, players funding large-scale trials will consolidate share. Conversely, niche disruptors targeting single SNP clusters may survive by licensing data to bigger entities. Competitive intensity should tighten as reimbursement gains and regulatory clarity lure mainstream FMCG giants into the Nutrigenomics market.
Nutrigenomics Industry Leaders
BASF SE
Danone
Cell-Logic
DSM
Metagenics Inc.
- *Disclaimer: Major Players sorted in no particular order

Recent Industry Developments
- March 2025: Herbalife Ltd. acquired Pro2col Health LLC, Pruvit Ventures Inc. and a controlling stake in Link BioSciences for USD 25–30 million to expand personalized-nutrition manufacturing capabilities
- January 2025: Louis Dreyfus Company purchased BASF’s food and health ingredients business, bolstering its portfolio of bioactive compounds
- January 2024: GenoPalate partnered with Earth Fare to embed QR-code genetic nutrition guidance in grocery aisles


Research Methodology Framework and Report Scope
Market Definitions and Key Coverage
Our study defines the global nutrigenomics market as the revenue earned from genetic test kits, reagents, bioinformatics tools, and linked personalized-nutrition programs that translate gene-diet interactions into consumer or clinical action. According to Mordor Intelligence, valuation spans hospitals, research labs, and direct-to-consumer platforms across all regions and is stated in constant 2024 dollars.
Scope exclusion: General functional food or supplement sales that are not informed by individual genetic data remain outside this market.
Segmentation Overview
- By Application
- Cardiovascular Diseases
- Obesity
- Cancer Research
- Metabolic Disorders
- Neurological Disorders
- Other Applications
- By Product
- Diagnostic Kits and Reagents
- Nutrition
- Vitamins & Minerals
- Probiotics & Prebiotics
- Proteins & Amino Acids
- Phytochemicals
- Others
- By End-User
- Hospitals & Clinics
- Research Institutes & Universities
- Direct-to-Consumer Companies
- Pharmaceutical & Biotech Firms
- Nutrition & Fitness Centers
- By Distribution Channel
- Direct Sales
- Online Platforms
- Retail Pharmacies
- Healthcare-Practitioner Sales
- Geography
- North America
- United States
- Canada
- Mexico
- Europe
- Germany
- United Kingdom
- France
- Italy
- Spain
- Rest of Europe
- Asia Pacific
- China
- Japan
- India
- South Korea
- Australia
- Rest of Asia Pacific
- Middle East and Africa
- GCC
- South Africa
- Rest of Middle East and Africa
- South America
- Brazil
- Argentina
- Rest of South America
- North America
Detailed Research Methodology and Data Validation
Primary Research
Mordor analysts interview lab directors, nutrigenetic start-ups, clinical dietitians, and app developers across North America, Europe, and Asia Pacific. These conversations clarify kit utilization rates, retail price dispersion, and adoption barriers, letting us challenge and adjust desk-based assumptions.
Desk Research
We begin with publicly available datasets such as NIH Genomic Data Commons, WHO obesity prevalence dashboards, OECD sequencing cost trackers, and customs trade flows for HS code 3822 reagents. These anchor baseline volumes and pricing. Company 10-Ks, investor decks, and filings on genes-as-a-service models refine unit economics, while paid feeds like D&B Hoovers and Dow Jones Factiva help validate revenue splits. The sources noted are illustrative only; many others were reviewed during data collection and clarification.
Market-Sizing & Forecasting
We apply a top-down build that starts with the number of genomic tests processed and the average selling price, which are then reconciled with bottom-up snapshots from selected suppliers and channel checks. Variables such as obesity prevalence, sequencing cost curves, penetration of DTC genetic platforms, regulatory approvals, and nutrition-subscription attach rates feed a multivariate regression that projects demand through 2030. Gaps in supplier data are bridged with imputed volumes drawn from trade statistics and survey-derived utilization ratios.
Data Validation & Update Cycle
Outputs pass two-tier peer review, anomaly scans against independent indicators, and variance thresholds before sign-off. Reports refresh annually, while material events trigger interim revisions, ensuring clients receive the latest view.
Why Mordor's Nutrigenomics Baseline Commands Reliability
Published estimates often diverge because firms choose different product mixes, price references, and refresh cadences.
Our disciplined scoping and recurring reality checks temper volatility and anchor a dependable baseline.
Benchmark comparison
| Market Size | Anonymized source | Primary gap driver |
|---|---|---|
| USD 0.80 Billion (2025) | Mordor Intelligence | |
| USD 0.52 Billion (2024) | Global Consultancy A | Excludes DTC kit and bioinformatics revenues |
| USD 1.34 Billion (2024) | Research Publisher B | Adds functional-ingredient sales beyond gene-based services |
| USD 0.61 Billion (2023) | Regional Consultancy C | Counts kits only, omitting follow-on nutrition programs |
Taken together, the comparison shows that Mordor's balanced, transparent baseline sits midway between narrow and expanded scopes, reflecting verifiable inputs and repeatable steps that decision-makers can trust.


Key Questions Answered in the Report
What is the current size of the Nutrigenomics market?
The Nutrigenomics market is valued at USD 0.92 billion in 2026, with a forecast to reach USD 1.87 billion by 2031.
Which application segment holds the largest Nutrigenomics market share?
Obesity interventions lead with 35.10% Nutrigenomics market share in 2025, reflecting employer and insurer demand for preventive health solutions.
How fast is the probiotics and prebiotics segment growing within the Nutrigenomics industry?
Probiotics and prebiotics are expanding at a 12.18% CAGR, the fastest among product categories, as research links microbiome modulation to gene-based nutrition plans.
Why is Asia Pacific considered the most attractive growth region?
Asia Pacific posts a 13.42% CAGR due to rising disposable incomes, smartphone-led digital-health adoption and proactive government precision-nutrition initiatives.
What are the main barriers to wider clinical adoption of nutrigenomics?
Lack of harmonized regulations and limited randomized-trial evidence delay insurance reimbursement and physician uptake, restraining short-term clinical market penetration.
Page last updated on:


