Bioreactor Market Size and Share
Market Overview
| Study Period | 2020 - 2031 |
|---|---|
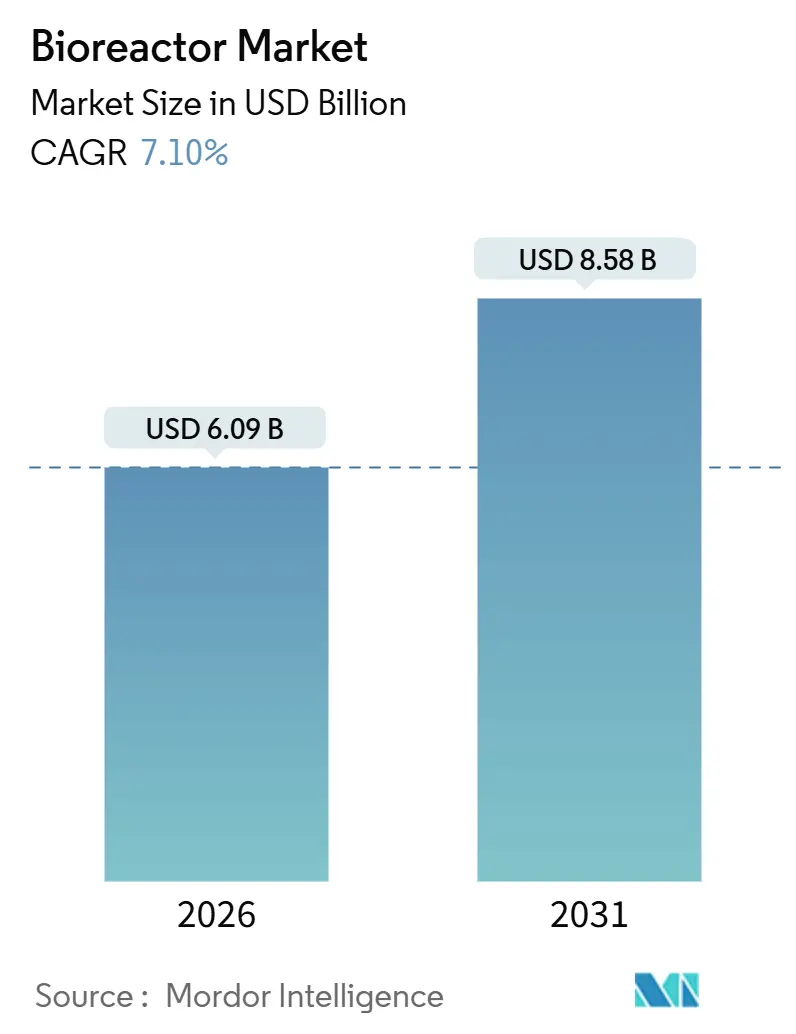
| Market Size (2026) | USD 6.09 Billion |
| Market Size (2031) | USD 8.58 Billion |
| Growth Rate (2026 - 2031) | 7.10% CAGR |
| Fastest Growing Market | Asia Pacific |
| Largest Market | North America |
| Market Concentration | Medium |
Major Players *Disclaimer: Major Players sorted in no particular order Image © Mordor Intelligence. Reuse requires attribution under CC BY 4.0. | |
Bioreactor Market Analysis by Mordor Intelligence
The Bioreactor Market size is estimated at USD 6.09 billion in 2026, and is expected to reach USD 8.58 billion by 2031, at a CAGR of 7.10% during the forecast period (2026-2031).
The rising demand for flexible capacity in cell and gene therapy, sustained funding for vaccine preparedness, and the broader adoption of single-use technology continue to redefine how biopharma companies and contract manufacturers allocate their capital. Accelerated process-development timelines and the growing acceptance of continuous bioprocessing shorten the path from discovery to commercial supply, while digital twins and in-line analytics push the sector toward real-time parameter control. Competitive intensity is increasing as integrated vendors bundle hardware, consumables, and software, thereby locking customers into ecosystems that promote recurring revenue and high switching costs. Supply-chain fragility for medical-grade polymers and a widening talent gap in bioprocess engineering counterbalance demand, especially in regions racing to onshore capacity to hedge against geopolitical risk.
Key Report Takeaways
- By type, stainless-steel systems led the bioreactor market, accounting for 47.00% of the market share in 2025. In contrast, single-use configurations are forecast to advance at a 10.10% CAGR through 2031.
- By usage, full-scale production accounted for 58.80% of the bioreactor market size in 2025, while pilot-scale installations are projected to expand at a 9.00% CAGR between 2026 and 2031.
- By scale, 200 L – 1,500 L accounted for 39.00% of the bioreactor market size in 2025, while above 1,500 L are projected to expand at a 10.20% CAGR between 2026 and 2031.
- By control type, automated (MFCs) accounted for 64.00% of the bioreactor market size in 2025, and it is projected to expand at an 8.50% CAGR between 2026 and 2031.
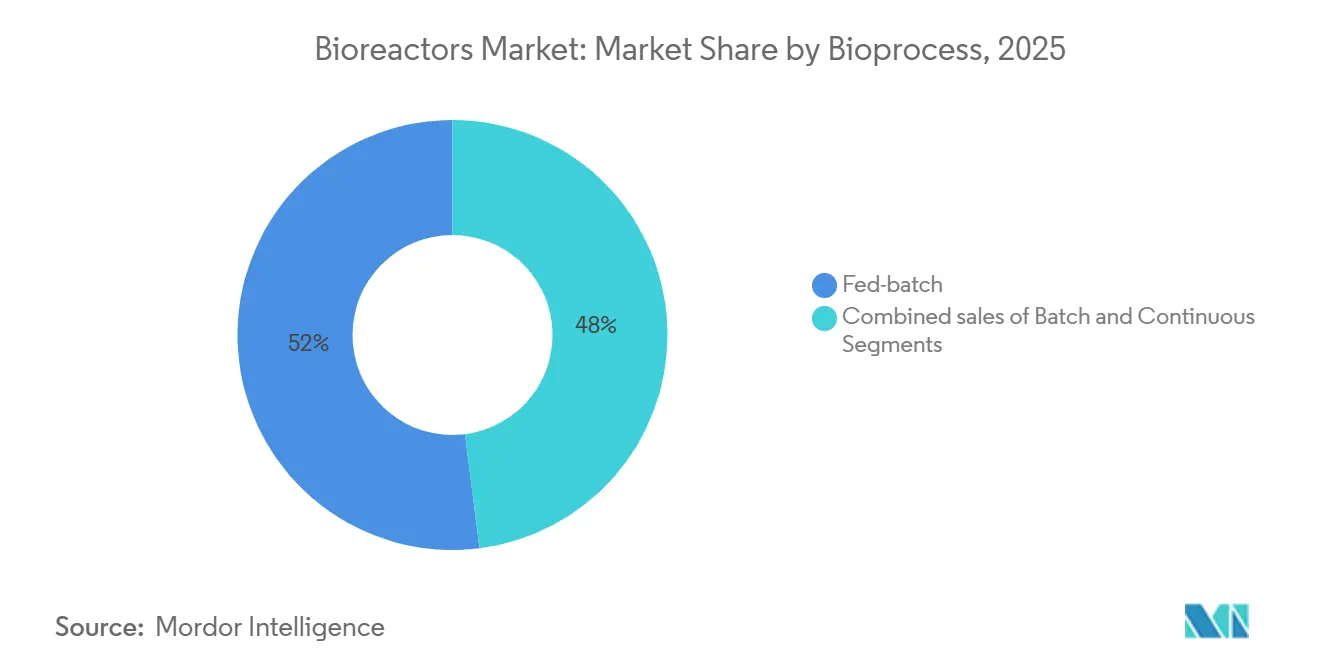
- By 2025, bioprocesses, including fed-batch, retained 52.00% of the bioreactor market share; continuous systems are projected to grow at a 10.50% CAGR through 2031.
- By application, pharmaceutical and biopharmaceutical manufacturing captured 72.00% of revenue in 2025, whereas cell and gene therapy is expected to post a 10.80% CAGR to 2031.
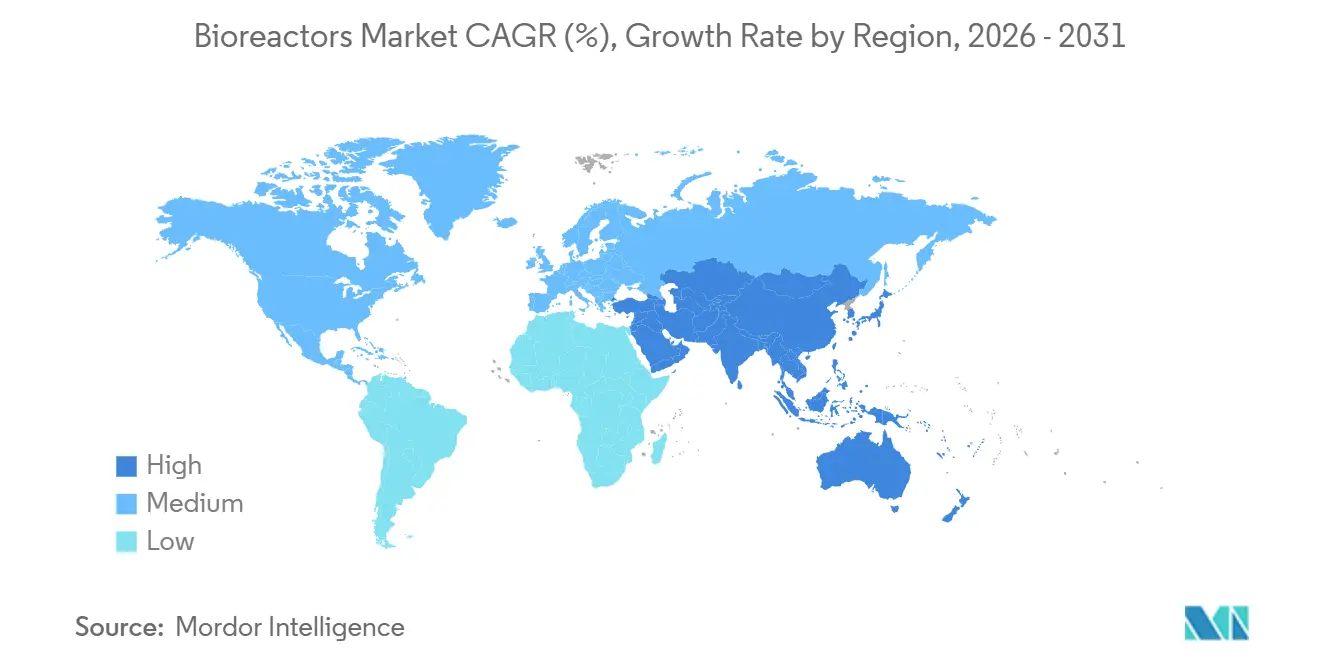
- By geography, North America accounted for 43.00% of the revenue in 2025; the Asia-Pacific region is forecast to register an 8.30% CAGR, the fastest regional growth rate through 2031.
Note: Market size and forecast figures in this report are generated using Mordor Intelligence’s proprietary estimation framework, updated with the latest available data and insights as of January 2026.
Global Bioreactor Market Trends and Insights
Drivers Impact Analysis*
| Driver | (~) % Impact on CAGR Forecast | Geographic Relevance | Impact Timeline |
|---|---|---|---|
| Expanding Cell & Gene Therapy Manufacturing Pipelines | +2.1% | Global, concentrated in North America and Europe | Medium term (2-4 years) |
| Growing Adoption of Single-Use Bioreactor Technology | +1.8% | North America, Europe, Asia-Pacific | Short term (≤ 2 years) |
| Government Funding for Pandemic Vaccine Capacity | +1.2% | North America, Europe, emerging Asia-Pacific | Medium term (2-4 years) |
| Rising Demand for Microbial Fermentation in Alternative Proteins | +0.9% | North America, Europe, Asia-Pacific | Long term (≥ 4 years) |
| Integration of Advanced Process Control and Digital Twins | +1.4% | Global | Short term (≤ 2 years) |
| Expansion of Regional Bio-Clusters in Emerging Economies | +0.8% | Asia-Pacific, Latin America, Middle East | Long term (≥ 4 years) |
| Source: Mordor Intelligence | |||
Expanding Cell & Gene Therapy Manufacturing Pipelines
Distributed manufacturing models for autologous CAR-T and allogeneic therapies favor smaller-footprint equipment over centralized mega plants. AGC Biologics has earmarked USD 350 million for a Yokohama site featuring 2,000-liter single-use vessels, while its Copenhagen campus doubled capacity with 16 similar units scheduled for 2026 start-up. Fujifilm Diosynth Biotechnologies is investing USD 1.2 billion in a North Carolina expansion that will utilize 20,000-liter reactors for viral-vector and mRNA programs. AstraZeneca opened a USD 300 million facility in Maryland in 2025 to co-locate clinical and commercial cell therapy production, thereby accelerating technology transfer cycles. These moves show a shift toward owning strategic capacity to protect intellectual property and margins, increasing competition for bioprocess engineers and single-use consumables. As a result, the bioreactor market is moving toward modular, rapidly deployable suites that can be replicated across global sites without extensive civil construction.
Growing Adoption of Single-Use Bioreactor Technology
Single-use platforms have surpassed pilot adoption and now dominate early-stage commercial production. Thermo Fisher Scientific released the HyPerforma DynaDrive 2.0 in 2025, reducing shear stress by 25% and enabling perfusion at cell densities exceeding 100 million cells/mL. Sartorius followed with Biostat STR Generation 3, integrating optical DO sensors and automated pH control that removes four hours of manual calibration per batch. Scale ceilings continue to rise: AGC Biologics plans 5,000-liter single-use runs, pushing the boundaries once thought feasible only in stainless steel. While life-cycle assessments reveal that reusable systems generate three to five times less plastic waste than single-use systems, vendors such as Cytiva and Sartorius have launched take-back programs to recycle spent film and tubing for non-GMP applications. This dynamic keeps sustainability in focus without slowing the momentum of the bioreactor market as it heads into 2026.
Government Funding for Pandemic Vaccine Capacity
Governments now treat local biomanufacturing as strategic infrastructure on par with semiconductors. The United States committed USD 5 billion under Project NextGen, issuing contracts to Fujifilm, Lonza, and Emergent BioSolutions for a combined 500,000 liters of new capacity[1]U.S. Department of Health and Human Services, “Project NextGen Awards,” hhs.gov. The United Kingdom has entered into a 10-year, GBP 520 million (USD 660 million) partnership with Moderna to develop domestic mRNA production lines. Canada’s CAD 2.2 billion (USD 1.6 billion) initiative finances expansions at Sanofi Toronto and a national center in Montreal, ring-fencing supply after COVID-19 bottlenecks. Incentives have shortened payback periods for large stainless-steel projects, keeping the bioreactor market attractive to suppliers that can navigate long procurement cycles and validation requirements. The emphasis on redundancy also drives multi-site capacity planning, increasing equipment demand across regions.
Rising Demand for Microbial Fermentation in Alternative Proteins
Precision fermentation requires higher agitation, elevated dissolved oxygen, and continuous nutrient feeds distinct from mammalian processes. Impossible Foods scaled leghemoglobin production in 10,000-liter reactors and achieved titers of 15 g/L by optimizing Pichia pastoris fermentation. Perfect Day operates 50,000-liter stainless-steel units for whey protein, reducing capital expenditure per kilogram by 40% through continuous operation. Industry analysts expect the precision fermentation segment to reach USD 67.9 billion by 2032, opening up an adjacent growth avenue for the broader bioreactor market. Suppliers able to engineer corrosion-resistant internals and automated cleaning-in-place that tolerate acidic or alkaline broths gain a competitive edge over pharmaceutical-only platforms. Industrial biotech growth, therefore, diversifies vendor revenue streams beyond therapeutics and buffers against drug development cyclicality.
Restraints Impact Analysis*
| Restraint | (~) % Impact on CAGR Forecast | Geographic Relevance | Impact Timeline |
|---|---|---|---|
| Supply Chain Volatility for Medical-Grade Plastic Polymers | -0.8% | Global, acute in North America and Europe | Short term (≤ 2 years) |
| High Capital Expenditure for Large-Scale Stainless-Steel Facilities | -0.6% | Global, especially emerging markets | Medium term (2-4 years) |
| Limited Availability of Skilled Bioprocess Engineers | -0.7% | Global | Short term (≤ 2 years) |
| Environmental Concerns Over Single-Use Waste Disposal | -0.5% | Europe, North America | Medium term (2-4 years) |
| Source: Mordor Intelligence | |||
Supply Chain Volatility for Medical-Grade Plastic Polymers
Spikes of 40%-60% in polyethylene and ethylene-vinyl-acetate resin pricing during 2021-2023 stabilized in 2024 but remain 25% above pre-pandemic levels, squeezing margins on single-use assemblies. Lead times for customized consumables increased from 12 weeks in 2019 to 26 weeks in 2024, forcing CDMOs to carry six months of safety stock, which ties up working capital. The EU’s Single-Use Plastics Directive exempts medical devices yet still pressures bioprocess suppliers to establish recycling schemes; Cytiva launched a European take-back program in 2025 to collect spent bags for mechanical recovery. Smaller manufacturers lack negotiating leverage with resin suppliers, creating a bifurcated market where top CDMOs secure favorable terms. At the same time, mid-tier players delay capacity plans, dampening bioreactor market growth in the short term.
High Capital Expenditure for Large-Scale Stainless-Steel Facilities
Building facilities with individual reactors exceeding 10,000 liters requires USD 300 million to USD 500 million in upfront spending and a three-to-five-year timeline. Samsung Biologics, for instance, invested USD 2.3 billion in Bio Campus 4, which brings 256,000 liters online in Songdo in 2025. Boehringer Ingelheim is investing EUR 500 million (approximately USD 540 million) in a German expansion, with four 15,000-liter units scheduled for completion in 2027. Such figures discourage new entrants in markets where access to low-cost debt is limited, particularly in India, Brazil, and South Africa. Consequently, many emerging-market firms opt for single-use capacity to avoid capital expenditure (capex) drag, but this choice limits maximum batch sizes and prevents direct competition for large biosimilar contracts.
*Our forecasts treat driver/restraint impacts as directional, not additive. The impact forecasts reflect baseline growth, mix effects, and variable interactions.
Segment Analysis
By Type: Single-Use Systems Reshape Capacity Economics
Full-scale monoclonal antibody sites maintained stainless-steel supremacy with a 47.00% share in 2025; however, single-use systems are projected to log a 10.10% CAGR to 2031 as cell and gene therapy pipelines expand. Single-use disposability eliminates the need for cleaning validation and reduces changeover times, attracting innovators who manage multiple low-volume products. Thermo Fisher’s DynaDrive 2.0 demonstrates how impeller redesign can reduce cell lysis by 30%, thereby strengthening the performance case for disposable formats.
The installed base of stainless-steel units exceeds 15,000 globally, and replacement cycles span two decades. Hybrid facilities, therefore, dominate the transition period as companies balance their sunk costs against the need for flexibility. Regulatory agencies now treat single-use and stainless steel equally for validation, erasing one of the final barriers that historically hindered adoption. As a result, the bioreactor market exhibits a clear bifurcation: legacy antibody plants continue to invest in scale, while new modalities prioritize agility over volume.

By Usage: Pilot-Scale Gains as Process Development Intensifies
Full-scale production captured 58.80% of the revenue in 2025, but pilot-scale reactors are set to expand at a 9.00% CAGR through 2031. As drug developers compress timelines, they run parallel optimization campaigns in 200-liter to 1,500-liter vessels before committing to capex-heavy commercial lines. Cytiva’s XDR-600 perfusion system exemplifies this bridge technology, allowing process-intensification trials ahead of 2,000-liter scale-up.
Lab-scale equipment remains critical for early discovery, yet budget sensitivity limits revenue upside. Meanwhile, utilization at mega facilities hovered near 70% in 2025, prompting firms to intensify upstream processes rather than add fresh tanks. This dynamic sustains healthy demand for pilot-scale units as companies seek to unlock hidden capacity before approving billion-dollar expansions.
By Scale: Above-1,500-Liter Reactors Capture Biosimilar Demand
Reactors between 200 and 1,500 liters held a 39.00% share in 2025, serving clinical supply and orphan-drug markets. Units above 1,500 liters are expected to grow at a 10.20% CAGR as biosimilar manufacturers in South Korea, China, and India strive to achieve a cost-of-goods below USD 100 per gram. Samsung Biologics’ 30,000-liter stainless-steel vessels produce 15,000 kilograms per batch, reducing per-gram costs by 35% compared to 10,000-liter lines.
Perfusion at 2,000 liters can match the output of 10,000-liter fed-batch systems by sustaining high cell densities for 60-day runs. This “virtual scale-up” value proposition appeals to companies that lack the capital or site footprint for mega tanks. Consequently, the bioreactor market sees divergent investment paths: emerging markets embrace vast stainless-steel formats for volume-driven biosimilars, while innovators invest in intensified mid-scale reactors for speed.
By Control Type: Automation Becomes Table Stakes
Automated systems with mass-flow controllers held a 64.00% share in 2025 and are expected to expand at an 8.50% CAGR. Sartorius added digital twin capabilities that reduced batch failures by 15% during tech transfers, easing regulatory audits. Thermo Fisher now embeds multi-analyte sensors for real-time glucose and lactate monitoring, extending exponential growth phases by 20% relative to fixed-feed cycles.
The FDA’s 2024 guidance, which favors continuous real-time release testing, accelerates demand for automation. Manual systems remain in academia and teaching labs, but are unlikely to regain ground in GMP production. Vendors, therefore, position entry-level automated benches below USD 50,000 to displace legacy gear and capture lifetime consumables revenue.
By Bioprocess: Continuous Systems Challenge Fed-Batch Orthodoxy
Fed-batch controlled 52.00% of 2025 revenue, but continuous systems are expected to grow at a 10.5% CAGR through 2031. Cytiva’s XDR-600 perfusion reactor achieved titers above 10 g/L over 60-day runs, demonstrating three-fold productivity increases. Lonza’s Portsmouth plant pivoted to perfusion, slashing volume needs from 20,000 liters to 6,000 liters for equal annual output.
In 2024, the EMA guidance confirmed that proven analytical controls can substitute for end-of-batch testing, thereby removing a key adoption hurdle. Fed-batch remains relevant for shear-sensitive proteins but faces a steady erosion of its share as next-gen platforms mature. Overall, the bioreactor market is experiencing a gradual yet decisive shift toward continuous operations.
By Application: Cell Therapy Redefines Design Rules
Pharmaceutical and biopharmaceutical companies generated 72.00% of the 2025 revenue, but cell and gene therapy applications are forecasted to expand at a 10.80% CAGR. Bristol Myers Squibb’s USD 380 million deal with Cellares brings closed-system platforms that cut manual steps by 70%. Gilead plans to quadruple CAR-T capacity by 2026, utilizing modular suites that can process eight patient batches in parallel, underscoring the need for compact, closed bioreactors.
Industrial biotechnology’s share currently stands at 8.00%, while alternative proteins and bio-based chemicals are increasing vendor diversification. Suppliers catering to corrosive broths and higher agitation needs carve out niches that pharmaceutical-only vendors cannot efficiently serve. This widening application base strengthens the long-term outlook for the bioreactor market even as drug pipelines fluctuate.
By End User: CDMOs Absorb Outsourcing Wave
Pharma companies still own large in-house fleets, but CDMOs recorded quicker expansion thanks to USD 10 billion of new capacity committed during 2024-2025. WuXi Biologics opened a EUR 325 million site in Ireland, featuring 48,000 liters of single-use mammalian culture capacity. Fujifilm Diosynth spent USD 850 million across three global sites, targeting demand for viral-vector and mRNA products.
Outsourcing allows small biotechs to conserve cash for R&D, while innovators retain early clinical work internally for IP reasons. Utilization rates now diverge: innovators operate about 50%, CDMOs exceed 80%. This dynamic reinforces a two-speed bioreactor market where service providers dominate new equipment orders.
Geography Analysis
North America accounted for 43.00% of 2025 revenue, underpinned by Project NextGen’s USD 5 billion funding and a high concentration of CDMOs. Thermo Fisher’s USD 660 million Massachusetts expansion and Lonza’s USD 1 billion New Hampshire project exemplify the region’s commitment to both stainless-steel and single-use throughput. Canada’s USD 1.6 billion Life Sciences Strategy reduced cross-border dependency by funding 1,500-liter hybrid lines in Toronto and Montreal. While deep talent pools in Boston and San Francisco sustain innovation, high labor costs and lengthy permitting cycles encourage some companies to expand to friendlier jurisdictions overseas.
The Asia-Pacific region is the fastest-growing geography, with an 8.30% CAGR through 2031. Samsung Biologics’ USD 2.3 billion Bio Campus 4 delivers 256,000 liters in South Korea, positioning the country as a biosimilar powerhouse targeting EU and U.S. markets. WuXi Biologics chose Singapore for a USD 1.8 billion site combining mammalian and microbial fermentation, reflecting the city-state’s aggressive incentives. AGC Biologics’ USD 350 million Yokohama project focuses on domestic cell-therapy capacity, while India’s Biocon and Dr. Reddy’s target large-scale antibody work despite regulatory headwinds.
Europe remains a stalwart despite complex rules. Germany, Switzerland, and Ireland secured USD 3 billion in commitments for 2024-2025. Boehringer Ingelheim allocates EUR 500 million for four 15,000-liter reactors in Biberach. Thermo Fisher’s EUR 780 million Cork plant will manufacture single-use components and feature a cell-therapy suite, supported by Ireland’s favorable tax regime. The United Kingdom’s GBP 520 million agreement with Moderna for mRNA supply underscores the government's willingness to underwrite capacity[2]Government of the United Kingdom, “Moderna Partnership Announcement,” gov.uk. Elsewhere, Saudi Arabia and Brazil plan smaller projects under national-self-sufficiency strategies, hinting at future contributions to the bioreactor market after 2027.
Competitive Landscape
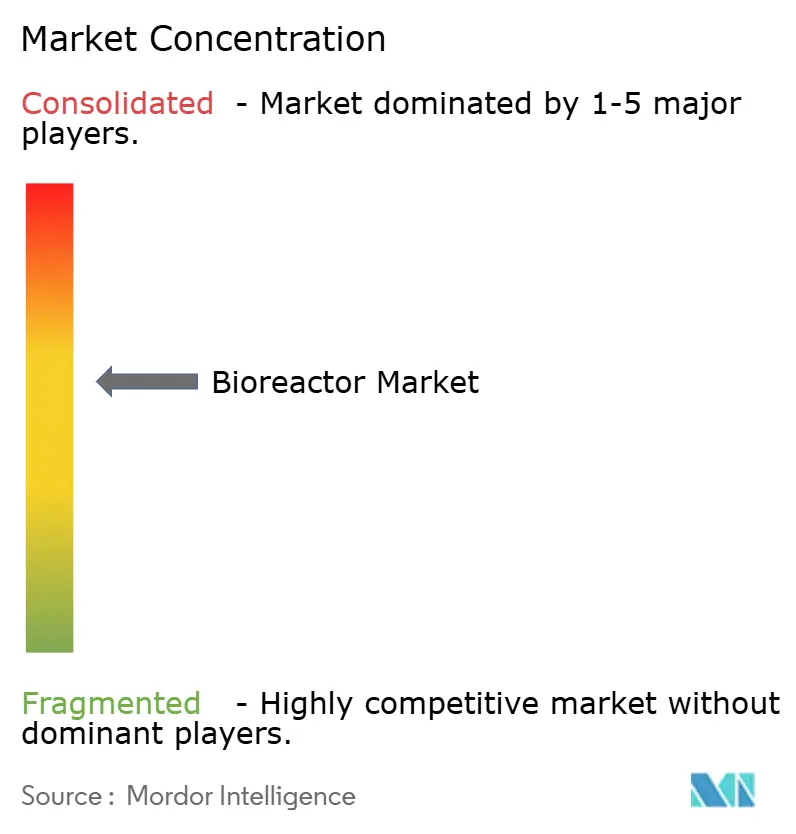
Sartorius, Thermo Fisher Scientific, and Danaher’s Cytiva division hold roughly 45%-50% of global revenue, leveraging hardware-consumable-software bundles to lock customers into proprietary ecosystems. Sartorius invested EUR 1 billion in Göttingen during 2024 to increase single-use bag output and shorten lead times amid resin shortages. Thermo Fisher pursues vertical integration by acquiring a specialty film producer in 2024 to secure raw materials for DynaDrive bags. Danaher focuses on digital integration; Cytiva’s data-rich platforms enable predictive maintenance, reducing unplanned downtime by 20%.
Mid-tier firms like Eppendorf and Getinge compete through niche plays such as lower-priced modular benches or stainless-steel systems for legacy lines. Disruptors like PBS Biotech employ vertical-wheel mixing to minimize shear stress, winning contracts with gene-therapy developers. Continuous manufacturing and industrial-biotech niches remain open as adoption sits below 10% of the installed base, giving smaller vendors room to differentiate. ISO 13485 compliance and FDA validation maintain high entry barriers, but shift toward modular designs and software-defined control lowers switching costs, keeping the competitive field dynamic.
Bioreactor Industry Leaders
Sartorius AG
Thermo Fisher Scientific Inc.
Eppendorf AG
Merck KGaA
Danaher Corporation
- *Disclaimer: Major Players sorted in no particular order


Recent Industry Developments
- December 2025: PBS Biotech unveiled its new MiniPRO platform, a multi-parallel Vertical-Wheel bioreactor designed for high-throughput cell therapy process development. The innovative technology aims to streamline the optimization and scaling up of manufacturing processes.
- April 2025: ABEC unveiled its innovative Advanced Therapy Bioreactor, a groundbreaking platform for cell expansion in ATMP manufacturing. The ATB offers enhanced process control and scalability, addressing the limitations of existing systems. This new solution is set to advance the development and production of advanced cell therapies significantly.
- October 2024: Univercells Technologies by Donaldson introduced the scale-X nexo bioreactor, a compact fixed-bed bioreactor with a 0.5 m² growth surface. It is designed to enhance cell culture process development across various modalities. The bioreactor aims to streamline scalability, reduce development timelines, and lower costs for researchers and biopharma firms.


Research Methodology Framework and Report Scope
Market Definitions and Key Coverage
Our study defines the global bioreactor market as all new vessels of five liters and above that maintain controlled temperature, pH, dissolved oxygen, aeration, and agitation to grow living cells or microbes for commercial manufacture or process development of biologics, enzymes, cultivated protein, and industrial metabolites. Systems covered include stainless-steel, glass, and single-use formats supplied to biopharmaceutical companies, contract developers, food-tech innovators, industrial biotech firms, and academic institutes.
Scope exclusion, waste-water equipment: Moving-bed, membrane, and other effluent-treatment bioreactors, refurbished units, and stand-alone automation skids are omitted.
Segmentation Overview
- By Type
- Glass
- Stainless Steel
- Single-Use
- By Usage
- Lab-Scale Production
- Pilot-Scale Production
- Full-Scale Production
- By Scale
- 5 L - 20 L
- 20 L - 200 L
- 200 L - 1,500 L
- Above 1,500 L
- By Control Type
- Manual
- Automated (MFCs)
- By Bioprocess
- Batch
- Fed-Batch
- Continuous
- By Application
- Pharmaceutical & Biopharmaceutical Manufacturing
- Cell & Gene Therapy
- Industrial Biotechnology (Biofuels, Enzymes)
- By End User
- Biopharma & Pharma Companies
- Contract Development & Manufacturing Organisations (CDMOs)
- Other End Users
- Geography
- North America
- United States
- Canada
- Mexico
- Europe
- Germany
- United Kingdom
- France
- Italy
- Spain
- Rest Of Europe
- Asia-Pacific
- China
- Japan
- India
- South Korea
- Australia
- Rest Of Asia-Pacific
- Middle East And Africa
- GCC
- South Africa
- Rest Of Middle East And Africa
- South America
- Brazil
- Argentina
- Rest Of South America
- North America
Detailed Research Methodology and Data Validation
Primary Research
Mordor analysts interviewed upstream process engineers, sourcing heads at contract manufacturers, and regional distributors across North America, Europe, and Asia. These discussions clarified typical lead times, spare inventory levels, and pricing spreads, and they challenged secondary assumptions before finalizing growth drivers and penetration curves.
Desk Research
We began with public statistics from bodies such as the US FDA medical product databases, the European Medicines Agency, and China's NMPA pipeline tracker, which hint at installed upstream capacity. Trade association releases from BioPhorum, ISPE, and the Biotechnology Innovation Organization provided adoption ratios for stainless versus single-use systems. Global customs codes for bioprocess vessels, peer-reviewed fermentation journals, company 10-Ks, and investor decks enriched shipment counts and average selling prices. Select licensed datasets, D&B Hoovers for company revenue splits and Dow Jones Factiva for transaction news, filled financial gaps. The sources listed illustrate, not exhaust, the desk research pool consulted by us.
Market-Sizing & Forecasting
A top-down build starts with biopharmaceutical and industrial fermentation output (liters) and average reactor utilization; these volumes are mapped to demand for new vessels each year. We then corroborate totals through selective bottom-up checks such as sampled supplier shipments and channel price audits, adjusting for refurb rates. Key variables powering the model include biologics clinical pipeline counts, single-use penetration, average stainless-steel replacement cycle, regional capex incentives, and cultured-protein facility announcements. Multivariate regression links these drivers to historical sales; a five-year ARIMA overlay captures cyclical reorder patterns and identifies rebound lags after large expansion waves. Data gaps in bottom-up inputs are bridged with conservative mid-point estimates tested during expert calls.
Data Validation & Update Cycle
Outputs pass a three-layer review: automatic variance scans, peer analyst cross-checks, and senior review sign-off. Reports refresh annually, and interim revisions trigger when plant closures, capacity expansions, or regulatory shifts move market sentiment.
Why Our Bioreactors Baseline Commands Reliability
Published estimates often diverge because firms use different product mixes, base years, and refresh cadences. Our disciplined scope, driver selection, and yearly update schedule reduce this spread for decision-makers.
Key gap drivers include whether single-use accessories are bundled, if wastewater units are folded into totals, currency conversion cut-offs, and the frequency with which primary demand signals are re-polled.
Benchmark comparison
| Market Size | Anonymized source | Primary gap driver |
|---|---|---|
| USD 5.68 billion (2025) | Mordor Intelligence | - |
| USD 8.0 billion (2024) | Global Consultancy A | Includes accessories and downstream skids, relies on revenue apportionment rather than unit counts |
| USD 13.27 billion (2025) | Industry Publisher B | Bundles membrane and moving-bed reactors, uses capex proxy, refreshes every two years |
In sum, Mordor's model stays closest to the equipment actually purchased, balances top-down demand pools with shipment reality, and is re-validated each year, giving clients a balanced and transparent baseline they can trace back to clear variables and repeatable steps.


Key Questions Answered in the Report
How large is the bioreactor market in 2026 and what CAGR is expected to 2031?
The bioreactor market size is USD 6.09 billion in 2026 and is forecast to reach USD 8.58 billion by 2031 at a 7.10% CAGR.
Which bioreactor type is growing the fastest through 2031?
Single-use systems lead growth with a projected 10.10% CAGR, driven by cell and gene therapy manufacturing needs.
Why is Asia-Pacific the fastest-growing region for bioreactors?
Regional policies in Singapore, South Korea, and China fund large-scale capacity, supporting an 8.30% CAGR through 2031.
What is driving adoption of continuous bioprocessing?
Perfusion reactors can triple productivity and lower facility capex by up to 40.00%, prompting a forecast 10.5% CAGR for continuous systems.
How are supply-chain issues affecting single-use bioreactor adoption?
Elevated resin prices and longer lead times increase working capital needs, but recycling programs and dual-sourcing strategies mitigate long-term risk.
Page last updated on:


