Track And Trace Solutions Market Size and Share
Market Overview
| Study Period | 2020 - 2031 |
|---|---|
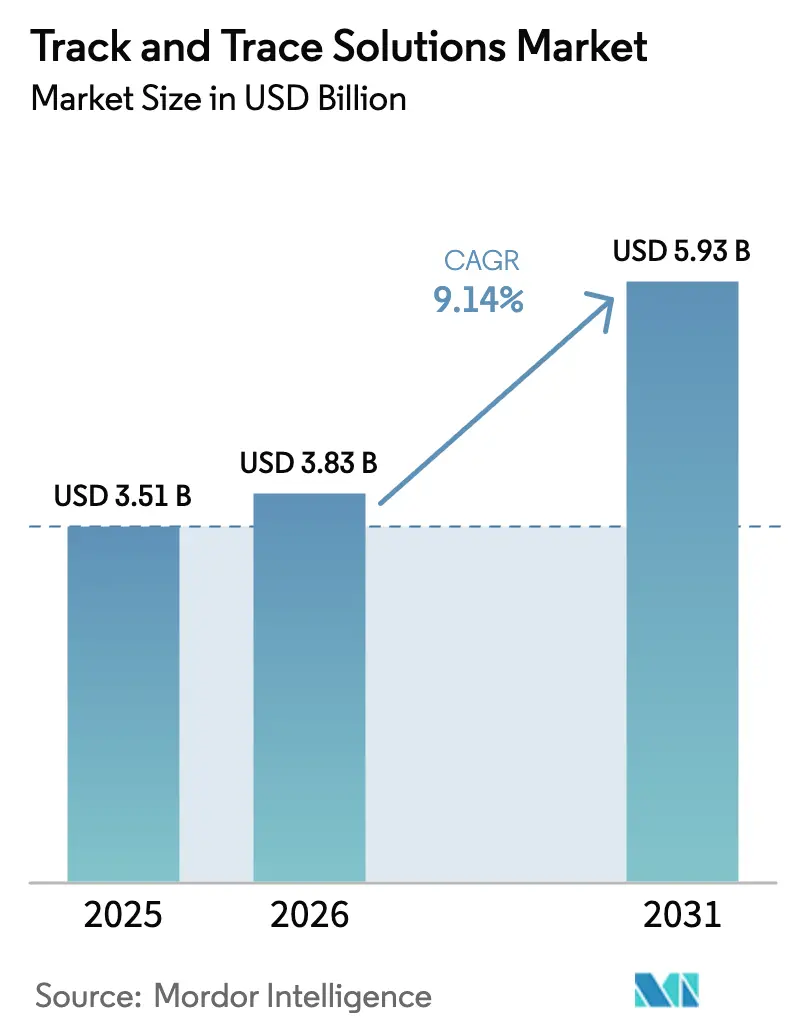
| Market Size (2026) | USD 3.83 Billion |
| Market Size (2031) | USD 5.93 Billion |
| Growth Rate (2026 - 2031) | 9.14% CAGR |
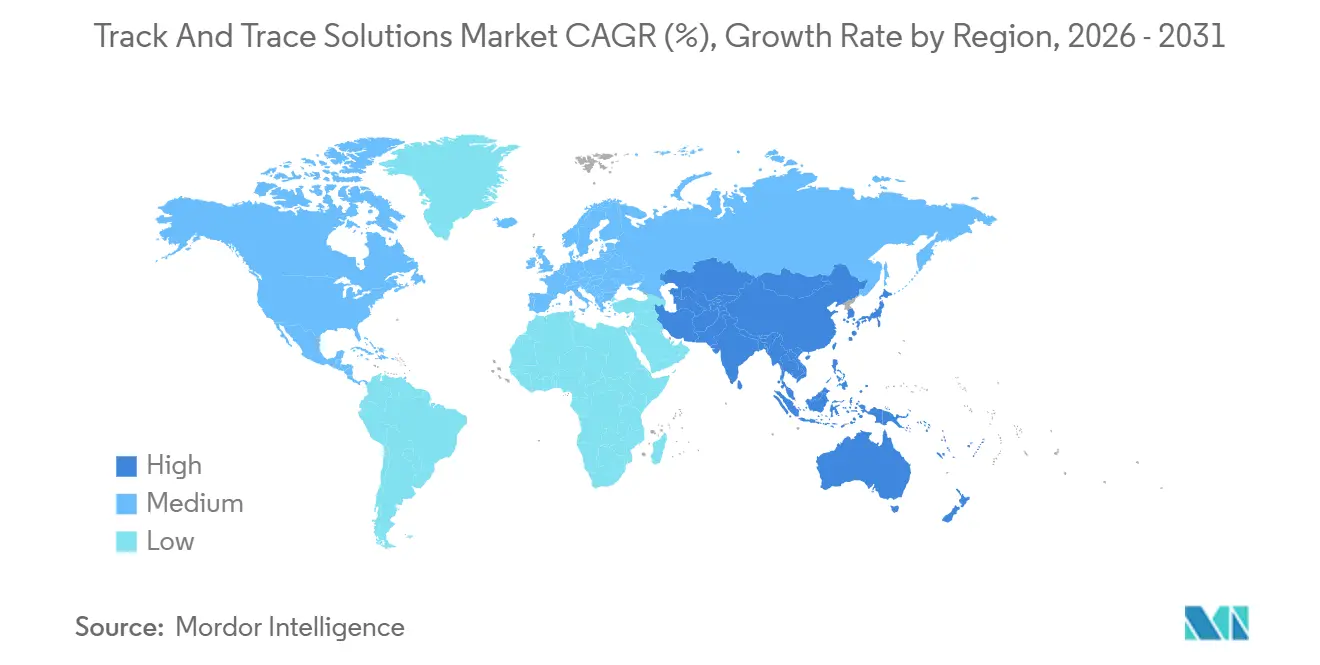
| Fastest Growing Market | Asia Pacific |
| Largest Market | North America |
| Market Concentration | Medium |
Major Players *Disclaimer: Major Players sorted in no particular order Image © Mordor Intelligence. Reuse requires attribution under CC BY 4.0. | |
Track And Trace Solutions Market Analysis by Mordor Intelligence
The Track And Trace Solutions Market size is projected to be USD 3.51 billion in 2025, USD 3.83 billion in 2026, and reach USD 5.93 billion by 2031, growing at a CAGR of 9.14% from 2026 to 2031.
Robust enforcement of pharmaceutical serialization rules, higher counterfeit-drug seizures, and the pivot toward cloud-native compliance platforms are pushing vendors to bundle software, hardware, and managed services into unified offerings that shorten deployment cycles. Mid-tier manufacturers that once delayed investments are accelerating adoption because staggered U.S. DSCSA exemptions expire in 2025, while China and India mandate QR-code labeling on exports. Heightened cybersecurity scrutiny following the 2024 Change Healthcare ransomware incident is redirecting spending toward platforms with native zero-trust architecture, a shift that disadvantages lightweight cloud-only entrants. Demand is further buoyed by cold-chain biologics, e-commerce drug sales, and personalized therapies that require real-time unit-level visibility.
Key Report Takeaways
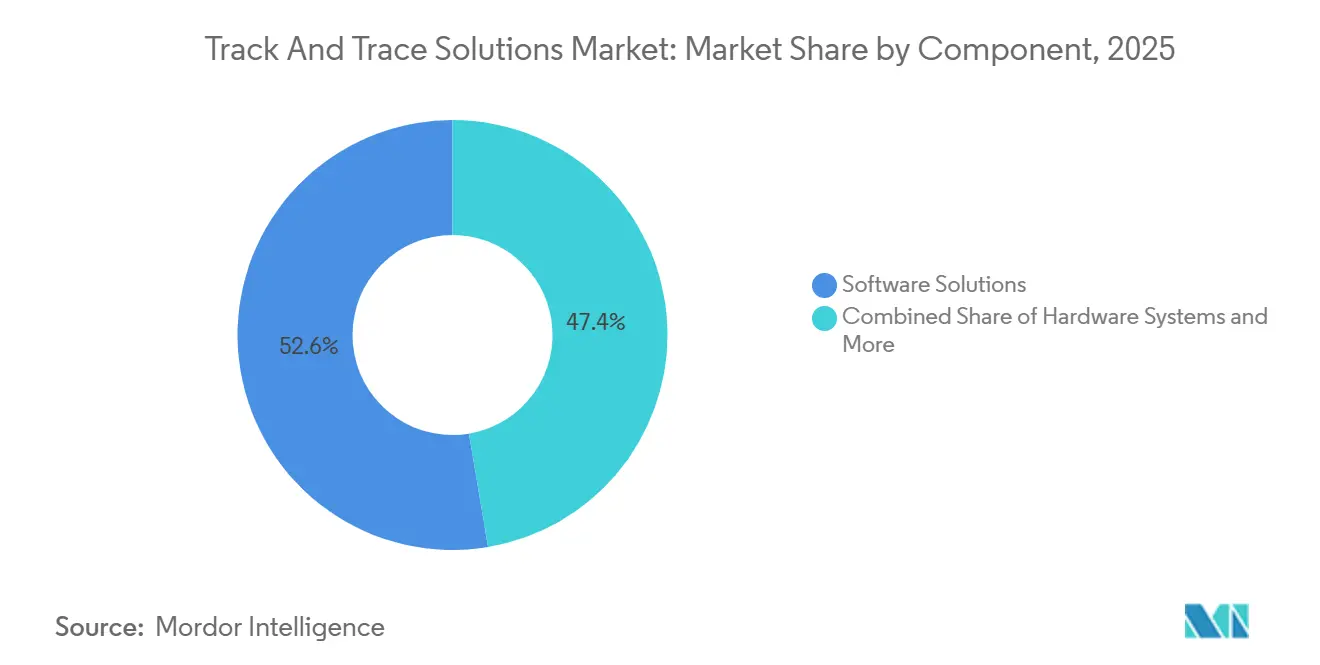
- By component, Software Solutions held 52.64% of 2025 revenue, while Professional & Managed Services are set to expand at a 10.49% CAGR through 2031.
- By technology, barcodes and 2-D DataMatrix symbols controlled 55.76% of 2025 spending, yet RFID & NFC are advancing at 8.85% on surging cold-chain demand.
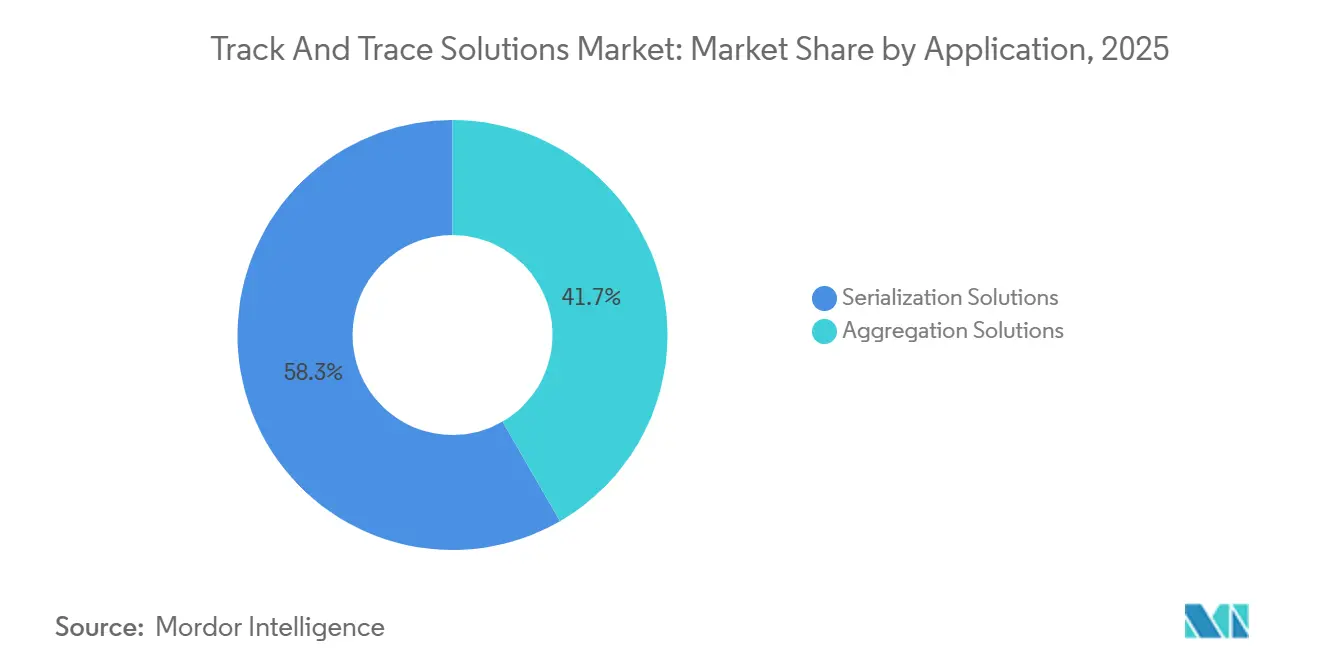
- By application, Serialization Solutions captured 58.34% of 2025 revenue; Aggregation Solutions post the fastest 9.77% CAGR to 2031.
- By end-user, Pharmaceutical Manufacturers held 40.09% of 2025 revenue, while Healthcare Distributors & Wholesalers record a 10.15% CAGR on DSCSA verification.
- By geography, North America accounted for 42.24% of 2025 turnover, but Asia-Pacific is forecast to rise at 10.29% through 2031.
Note: Market size and forecast figures in this report are generated using Mordor Intelligence’s proprietary estimation framework, updated with the latest available data and insights as of January 2026.
Global Track And Trace Solutions Market Trends and Insights
Drivers Impact Analysis*
| Driver | (~) % Impact on CAGR Forecast | Geographic Relevance | Impact Timeline |
|---|---|---|---|
| Convergence of Global Pharmaceutical Traceability Mandates (WHO, ISO) | +2.1% | Global, with accelerated adoption in APAC and MEA | Medium term (2-4 years) |
| Escalating Counterfeit Drug Threat Elevating Patient-Safety Imperatives | +1.8% | Global, concentrated in LMICs and cross-border e-commerce corridors | Short term (≤ 2 years) |
| Surge in Direct-to-Patient & E-commerce Channels Requiring End-to-End Visibility | +1.5% | North America & EU, expanding to urban APAC | Medium term (2-4 years) |
| Digitalization of Pharma Supply Chains and Cloud-native SaaS Adoption | +1.3% | Global, led by North America and Western Europe | Long term (≥ 4 years) |
| Transition to Personalized & Small-Batch Therapies Necessitating Flexible Serialization | +1.0% | North America & EU, niche penetration in APAC | Long term (≥ 4 years) |
| Brand Reputation & Recall Cost Avoidance Driving Investment in Track & Trace Analytics | +0.9% | Global, with highest sensitivity in North America and EU | Medium term (2-4 years) |
| Source: Mordor Intelligence | |||
Convergence of Global Pharmaceutical Traceability Mandates
Regulatory alignment is compressing deployment schedules. China’s new GMP appendices effective January 2026 enforce electronic batch records for API shipments, while India’s February 2025 export rule accelerates QR-code rollouts[2]China National Medical Products Administration, “GMP Appendices for Excipients and Packaging Materials,” nmpa.gov.cn. ISO 12931 offers a shared authentication blueprint that trims integration delays across trading partners. Multinationals are standardizing enterprise-wide architectures instead of maintaining isolated regional stacks. The certification gap—only three in ten South Asian generic firms met ISO 12931 by 2025—lets compliant suppliers command premium contracts.
Escalating Counterfeit Drug Threat Elevating Patient-Safety Imperatives
Interpol’s 2023 Operation Pangea seized illicit drugs valued at USD 53 million, yet WHO recorded 1,500 falsified-medicine incidents in 2024[1]. Hospital group-purchasing organizations in the United States now reject shipments lacking serialized pedigree data. Telemedicine growth opens fresh vulnerabilities as patients bypass brick-and-mortar pharmacies; the FDA sent 15 warning letters to online outlets in 2024. This environment propels serialization as a frontline defense.
Surge in Direct-to-Patient and E-commerce Channels Requiring End-to-End Visibility
Home delivery of biologics magnifies last-mile risks. Manufacturers embed NFC tags and BLE beacons inside insulated shippers to record temperature and geolocation in real time. Fewer than four in ten European online pharmacies validated serialization codes at checkout by mid-2025, exposing shoppers to counterfeits. National enforcement under the EU Falsified Medicines Directive remains uneven, necessitating adaptable verification tools.
Digitalization of Pharma Supply Chains and Cloud-Native SaaS Adoption
EPCIS 2.0 finalized in 2024 enables JSON-based event exchange that cuts custom integration spend by up to 40%. Cloud platforms centralize aggregation data across contract manufacturers, but data-sovereignty laws in China and Russia oblige vendors to deploy local hosting or joint ventures. Updated U.S. HIPAA guidance tightens encryption baselines, forcing under-capitalized SaaS entrants to seek alliances or exit.
Restraints Impact Analysis*
| Restraint | (~) % Impact on CAGR Forecast | Geographic Relevance | Impact Timeline |
|---|---|---|---|
| Divergent Country-level Timelines Generating Investment Uncertainty | -1.2% | Global, most acute in emerging markets with delayed mandates | Short term (≤ 2 years) |
| High Capital & Integration Costs with Legacy MES/ERP and Packaging Lines | -1.5% | Global, disproportionately affecting generic manufacturers | Medium term (2-4 years) |
| Data Privacy & Cyber-security Risks in Networked Traceability Platforms | -0.8% | North America & EU, with spillover to APAC | Medium term (2-4 years) |
| Limited Per-unit ROI for Low-margin Generic Manufacturers | -1.0% | Global, concentrated in price-controlled markets | Long term (≥ 4 years) |
| Source: Mordor Intelligence | |||
Fragmented Country-Level Timelines Generating Investment Uncertainty
Brazil deferred full serialization for smaller producers to 2027, diverting capital to markets with firmer deadlines[3]Brazil National Health Surveillance Agency, “Pharmaceutical Serialization Requirements,” anvisa.gov.br. Saudi Arabia completed phased rollouts in 2024, yet neighboring states retain unique file formats. Turkey fines foreign firms more often than local peers, creating uneven compliance pressure. Manufacturers juggle resources across this patchwork, extending decision cycles.
High Capital and Integration Costs with Legacy Systems
Retrofitting high-speed lines can exceed USD 1.5 million per line. Integration with aging MES and ERP installations prolongs validation to 18 months and depresses throughput during commissioning. Smaller firms in India and China are betting on deadline extensions or hardware price drops, but the gamble risks sudden enforcement actions and customer exits.
*Our forecasts treat driver/restraint impacts as directional, not additive. The impact forecasts reflect baseline growth, mix effects, and variable interactions.
Segment Analysis
By Component: Software Platforms Become the System Backbone
Software Solutions anchored 52.64% of 2025 revenue, underscoring their role as the unifying layer that links line-level controllers with enterprise resource planning. The Track and Trace Solutions market benefits from multinationals that mandate single global platforms to manage DSCSA lot-level events alongside EU aggregation uploads. Managed-service specialists execute validation, audits, and upgrades, growing at 10.49% CAGR as mid-sized firms lacking serialization talent outsource compliance.
Hardware Systems remain essential, yet buyers avoid vendor lock-in. Modular DataMatrix printers from Videojet install quickly and pair with third-party cameras, cutting changeover time. AI-equipped vision systems identify barcode defects and misapplied labels in real time, trimming rework by 30%. Tamper-evident labeling is compulsory in select MEA markets and continues to carve a niche, but software-driven interoperability decides contract awards. The Track and Trace Solutions market continues to shift budget weight from equipment to lifecycle services as regulatory audits intensify.


By Technology: RFID Extends Cold-Chain Visibility
Barcodes and 2-D DataMatrix symbols delivered 55.76% of 2025 spending because of universal scanner compatibility and negligible per-unit cost. This share underscores the Track and Trace Solutions market dominance of standards-based barcoding, a baseline that satisfies regulators across the United States, Europe, China, and India. GS1 DataMatrix encodes GTIN, serial, lot, and expiration within a small footprint, enabling high-speed printing on blister cards and bottles.
RFID & NFC are advancing at 8.85% CAGR, driven by biologics and vaccines that need continuous temperature assurance.
By Application: Aggregation Complexity Expands Service Revenues
Serialization Solutions retained 58.34% of 2025 revenue, cementing their status as core regulatory infrastructure. Bottle, blister, and carton serialization remain high-volume use cases, with bottle serialization dominating liquid formulations that move through rotary fillers at thousands of units per minute. The Track and Trace Solutions market size for blister serialization continues to climb even though small surface areas often push identifiers to carton level.
Aggregation Solutions are accelerating at 9.77% CAGR because wholesalers and regulators need parent-child hierarchies for rapid verification. Case aggregation links serialized cartons to master case IDs before outbound logistics. Pallet aggregation lets distributors scan once and reconcile a full load against advance ship notices, slicing receiving times by 50%. This hierarchy enriches analytics and improves traceability to the unit, positioning aggregation as the fastest growing share of the Track and Trace Solutions market.
By End-User: Wholesalers Lead Compliance Acceleration
Pharmaceutical Manufacturers generated 40.09% of 2025 spending. Their role as serialization originators and aggregation coordinators makes them foundational to the Track and Trace Solutions market. They integrate data across multi-site networks and third-party logistics providers to satisfy global mandates. Healthcare Distributors & Wholesalers post a 10.15% CAGR because DSCSA now obliges verification of every inbound serialized identifier before resale.
Contract Manufacturing & Packaging Organizations juggle multiple customer formats in a single shift, increasing demand for flexible line software. Medical Device Makers adopt serialization to satisfy the Unique Device Identification rule that reached Class I devices in 2025, creating an additional growth vector. Voluntary adopters in nutraceuticals, cosmetics, and legal cannabis use serialization to safeguard brand integrity. This diversity spreads the Track and Trace Solutions market across the life-science landscape and stabilizes recurring revenue.
Geography Analysis
North America delivered 42.24% of 2025 revenue. The United States closed its DSCSA stabilization period in November 2024, then extended limited exemptions through 2025, prompting staggered upgrades that favored platforms able to support EPCIS and legacy flat-file flows simultaneously. Canada phased in serialization rules through 2025, though enforcement remained lighter, while Mexico's proposal lacks firm dates, leading suppliers to prioritize U.S. readiness. These dynamics keep spending elevated as firms complete final DSCSA milestones.
Asia-Pacific leads growth at 10.29% CAGR. China’s 2027 full-chain traceability goal and India’s export QR-code mandate force rapid line retrofits. Chinese GMP appendices effective 2026 impose serialized batch records for excipients and APIs, increasing domestic demand. India’s top-300-brand QR rule creates a two-speed market favoring branded players with capital for upgrades. Japan recommends voluntary adoption, yet competitive pressure nudges early movers to serialize high-value therapies. Collectively, these forces enlarge the Track and Trace Solutions market share for Asia-Pacific.
Europe maintains mature adoption under the Falsified Medicines Directive, but national verification systems evolve at varied speeds. Pharmacy compliance lags in parts of Southern Europe where manual scans persist. The United Kingdom’s separate repository post-Brexit adds complexity and incremental cost for dual-market manufacturers. Despite maturity, continuing enhancements sustain mid-single-digit growth in the Track and Trace Solutions market across Europe.
Middle East and Africa show uneven progress. Gulf Cooperation Council states enforce barcodes and aggregation at ports, yet sub-Saharan nations rely on donor-funded pilots that often stall at scale. Saudi Arabia finished phased implementation in 2024 but adjacent markets still diverge on data formats. South Africa’s draft rules remain pending. Such disparity tempers growth but leaves headroom for long-run expansion once harmonization improves.
South America remains fragmented. Brazil’s repeated postponements push local upgrades to 2027, stalling investments. Argentina requires serialization for psychotropics and controlled drugs yet lacks centralized verification, limiting benefits. Chile and Colombia publish guidance without mandates, resulting in optional adoption guided by multinational policy rather than national law. This uncertainty curbs the Track and Trace Solutions market size in the region until clearer enforcement emerges.

Competitive Landscape
Moderate concentration defines the Track and Trace Solutions market. No vendor holds an outsized global position, yet switching costs built into 18-24-month implementation cycles maintain client stickiness. Zebra Technologies, Videojet, and Mettler-Toledo leverage large installed bases and service contracts to preserve hardware revenue. TraceLink, OPTEL, and Antares Vision dominate cloud-native serialization through scalable EPCIS 2.0 networks. Siemens and Körber bundle MES and warehouse modules to offer single-stack digitalization, appealing to manufacturers seeking integrated roadmaps.
Medical device serialization represents white space. Vendors refine offerings to handle longer life cycles and serial-lot complexities unique to orthopedic and implantable devices. Start-ups target contract packagers with pay-as-you-go SaaS, lowering entry costs. The 2024 Change Healthcare cyber breach moved cybersecurity to the top of vendor evaluations as buyers insist on on-premises encryption or zero-trust frameworks. Patent filings in 2024-2025 reveal AI defect detection and blockchain validated ledgers, yet production deployments remain limited, suggesting incremental rather than disruptive change during the forecast.
Regional specialization also shapes rivalry. Chinese firms partner with state clouds to meet data-sovereignty laws, while U.S. vendors differentiate on HIPAA readiness. European providers highlight GDPR-compliant data residency. This segmentation prevents rapid global consolidation and sustains a balanced competitive environment within the Track and Trace Solutions market.
Track And Trace Solutions Industry Leaders
Antares Vision S.p.A
Zebra Technologies Corporation
VISIOTT
TraceLink Inc.
OPTEL Group
- *Disclaimer: Major Players sorted in no particular order


Market Opportunities and Future Outlook
Interoperability-first upgrades are where spending is concentrating as EPCIS-enabled, item-level traceability becomes the operating baseline across manufacturers, wholesalers, and dispensers. The most visible whitespace is in exception management, audit-ready workflows, and data exchange orchestration that connect line controllers and repositories to ERP and inventory systems, especially for mid-tier firms still running manual steps or fragmented regional stacks. With EPCIS 2.0 finalized in 2024 and GS1 implementation guidance for DSCSA, vendors can align event sharing around standardized serialized data, which tends to reduce custom integration work and shifts evaluations toward platforms that can support multi-partner interoperability.
Regulatory and program changes expand the compliance backlog and add cross-country rollout needs. In India, the Ministry of Health and Family Welfare notified amendments to the Drugs Rules, 1945 in June 2026 to extend mandatory QR code-based traceability to vaccines, anti-cancer drugs, antimicrobials, and narcotic/psychotropic drugs, with phased implementation starting July 2027, which increases planning demand for scalable QR and verification tooling. In the United States, DSCSA requirements continue to pull downstream participants into electronic interoperability, with the FDA deadline in November 2026 for small dispensers (25 or fewer full-time employees) to reach full electronic, interoperable, package-level tracing compliance, supporting demand for lighter deployment models and managed services. Additional gaps persist around secure architectures and identity assurance for serialized networks, reinforced by cybersecurity scrutiny after the 2024 Change Healthcare ransomware incident and by the need to authenticate products in direct-to-patient and e-commerce flows using smartphone-readable identifiers.
Recent Industry Developments
- June 2026: Zebra Technologies unveiled a machine vision ecosystem at Automate 2026, positioning vision hardware and software as a unified layer for identifying, inspecting, and capturing data across workflows. This improves end-to-end visibility capabilities that support track-and-trace deployments, particularly where verification and exception handling at speed matter on packaging and logistics lines.
- March 2025: Zebra Technologies and Merck KGaA announced a collaboration to create safety and traceability solutions that combine physical authentication with Merck's M-Trust digital trust platform. The announcement reflects momentum toward cyber-physical anti-counterfeiting stacks that tie on-product identifiers to trusted digital records for verification across the supply chain.
- January 2024: Antares Vision S.p.A. published its FY 2025 document outlining ongoing investments and positioning in Life Science traceability and related digital platforms, supporting its track-and-trace portfolio roadmap. The disclosure indicates how vendors are bundling inspection, serialization, and data platforms into integrated offerings for regulated end-to-end compliance needs.


Research Methodology Framework and Report Scope
Market Definition and Coverage
This market covers solutions that help identify, capture, and share product movement and status across the supply chain, so items can be authenticated, traced, and recalled when needed. It includes the main software, hardware, and related services sold for track-and-trace use cases.
Scope exclusions: Exclusions include aftermarket coding fluids, generic warehouse management tools without serialization capability, and standalone blockchain platforms that are not part of packaged track-and-trace suites.
Segmentation Overview
- By Component
- Hardware Systems
- Printing & Marking Equipment
- Monitoring & Verification Systems
- Labeling & Tamper-evident Solutions
- Other Hardware
- Software Solutions
- Plant-level Management Suites
- Line Controller Software
- Bundle / Pallet Tracking Software
- Enterprise & Cloud Platforms
- Professional & Managed Services
- Hardware Systems
- By Technology
- Barcode / 2-D DataMatrix
- RFID & NFC
- Advanced IoT Sensors & BLE Beacons
- By Application
- Serialization Solutions
- Bottle Serialization
- Blister & Strip Serialization
- Carton & Case Serialization
- Data-Matrix / QR Serialization
- Aggregation Solutions
- Bundle Aggregation
- Case Aggregation
- Pallet Aggregation
- Serialization Solutions
- By End User
- Pharmaceutical Manufacturers
- Contract Manufacturing & Packaging Organizations (CMOs/CPOs)
- Medical Device Manufacturers
- Healthcare Distributors & Wholesalers
- Other Life-science Stakeholders (OTC, Nutraceuticals, Cosmetics, Legal Cannabis)
- By Geography
- North America
- United States
- Canada
- Mexico
- Europe
- Germany
- United Kingdom
- France
- Italy
- Spain
- Rest of Europe
- Asia-Pacific
- China
- Japan
- India
- South Korea
- Australia
- Rest of Asia-Pacific
- Middle East and Africa
- GCC
- South Africa
- Rest of Middle East and Africa
- South America
- Brazil
- Argentina
- Rest of South America
- North America
Data Sources, Market Sizing, and Validation
Desk Research
Desk research was used to build the base structure of the market and to anchor the model to observable signals. We referred to public sources such as US FDA drug supply chain security materials, the European Medicines Agency guidance pages, GS1 standards documentation, UN Comtrade trade statistics, and World Customs Organization references to understand labeling norms and cross-border traceability needs.
To convert these signals into usable sizing inputs, filings and investor presentations were reviewed to infer revenue mix, alongside reputed press coverage on regulation deadlines and recall activity. We also used paid subscriptions for company financials and intelligence, plus an import-export shipment-level database and patent databases to sanity-check adoption themes and technology intensity. The desk sources listed here are illustrative, and many other public documents were also used for data collection, validation, and clarification.
Primary Interviews and Surveys
Primary discussions were completed with solution providers, system integrators, packaging and coding ecosystem participants, and end users in regulated and high-risk supply chains. We used these calls to confirm typical deployment scope, pricing logic (license, subscription, and service bundles), and timing of compliance-driven buying, then to pressure-test assumptions across APAC, EMEA, and the Americas.
Distribution of primary research fieldwork respondents
| Company type | Respondent position | Region |
|---|---|---|
| Top tier: 35% | CXOs: 13% | APAC: 45% |
| Mid tier: 48% | Functional/Unit leaders: 43% | EMEA: 34% |
| Smaller Players: 17% | Managers: 44% | Americas: 21% |
Market-Sizing & Forecasting
Sizing starts with a top-down build where regulation coverage and packaging line activity help reconstruct the addressable demand pool for serialization and traceability, which is then translated into solution spending. We track inputs such as regulated product volumes, installed base of packaging lines needing code capture, recall frequency and severity signals, adoption of 2D barcode and RFID tagging, and typical software and service attachment rates that come with deployments.
Those totals are corroborated with selective bottom-up approximations, such as sampled average selling prices multiplied by estimated shipment volumes and a light supplier roll-up for the most visible revenue streams, then adjusted where gaps show up. When smaller geographies or end uses have limited public visibility, proxies like trade intensity, manufacturing output trends, and compliance timeline alignment are used, and assumptions are rechecked with interview feedback.
For forecasting, scenario analysis is applied around compliance enforcement timing, cloud migration pace, and refresh cycles of packaging and scanning hardware. The final growth path is kept realistic by using expert consensus ranges for the key variables, and by making sure the implied spend per line or per site does not drift away from what practitioners say is achievable.
Data Validation & Update Cycle
Outputs are cross-checked against independent signals like regulation milestones, trade and production movements, and the observed pace of serialization and aggregation adoption in key industries. We then run variance checks by region and by component to spot unusual jumps, and items that look inconsistent are sent back for a second review and, when needed, a follow-up confirmation with primary respondents.
Before sign-off, the model goes through multi-step analyst review so assumptions, currency conversions, and year alignment are consistent across the dataset. Reports are refreshed annually, and interim updates are triggered when there are material events such as new enforcement timelines, large M&A, or a sharp change in recall and compliance activity. Right before delivery, a fresh pass is done so clients receive the most current version available.
Mordor Intelligence's Track and Trace Solutions Market Estimate Compared With Other Published Estimates
Published market sizes for track-and-trace solutions can look far apart because each publisher draws the market box differently, and then uses different price and adoption assumptions to fill that box. Differences also show up when one study focuses mainly on regulated pharma needs, while another spreads the scope wider into broader logistics visibility tools.
Aftermarket coding fluids sit outside Mordor Intelligence's scope, which keeps the value tied to solution provider revenue from track-and-trace software, hardware, and related services rather than adjacent consumables. The spread versus other estimates is also influenced by how fast subscription pricing is assumed to rise, whether generic warehouse systems are counted as traceability, and how frequently currency and base-year updates are refreshed.
Benchmark comparison
| Source | Market Size | Gaps in Research Methodology |
|---|---|---|
| Mordor Intelligence | USD 3.51 B (2025) | |
| Global Consultancy A | USD 8.34 B (2025) | Uses a broader solution umbrella that can roll in wider supply chain visibility and monitoring use cases across many end users, and the scope is not clearly separated from adjacent software categories. The growth curve also leans on aggressive penetration assumptions that are not always anchored to compliance timing by region. |
| Industry Publisher B | USD 8.79 B (2025) | Counts a wide component stack across industries with limited clarity on how pure WMS, generic tracking tools, and bundled logistics software are handled. Assumed pricing and replacement cycles appear higher in early years, which can inflate the 2025 starting value. |
The table shows that most of the gap comes from what gets bundled into the definition, and how quickly adoption and pricing are assumed to move. By keeping inputs tied to compliance exposure, identifiable packaging and identification activity, and interview-checked attachment rates, we keep the final number traceable to repeatable steps rather than broad category stacking.


Key Questions Answered in the Report
How large is the Track and Trace Solutions market in 2026?
The market reached USD 3.83 billion in 2026 and is on course for USD 5.93 billion by 2031.
What CAGR is expected for Track and Trace Solutions to 2031?
A 9.14% compound annual growth rate is forecast over 2026-2031.
Which component segment grows the fastest?
Professional & Managed Services expand at a 10.49% CAGR as firms outsource compliance tasks.
Why is Asia-Pacific the fastest growing region?
China's 2027 traceability goal and India's 2025 export QR mandate push line retrofits that lift regional demand.
How did the Change Healthcare breach affect buying criteria?
It raised mandatory cybersecurity checks, steering buyers toward platforms with on-premises encryption and zero-trust architecture.
What drives RFID adoption in pharmaceuticals?
Cold-chain biologics need continuous temperature and location monitoring that passive barcodes cannot provide.
Page last updated on:


