Secondary Ticket Market Size and Share
Market Overview
| Study Period | 2020 - 2031 |
|---|---|
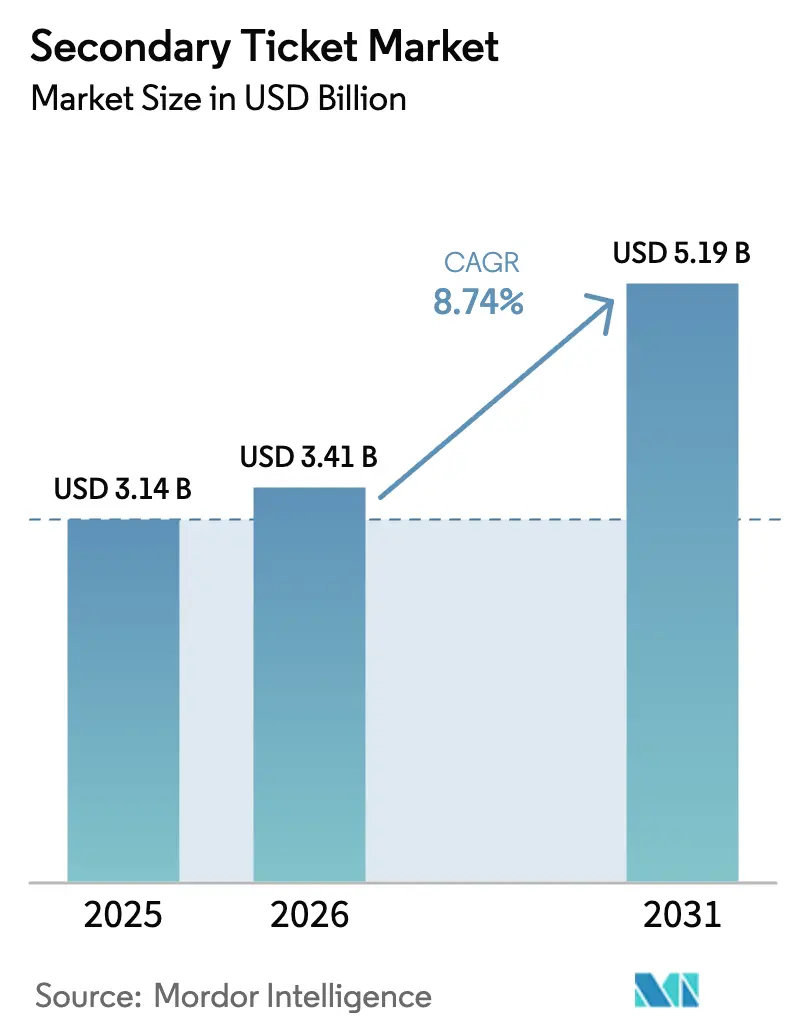
| Market Size (2026) | USD 3.41 Billion |
| Market Size (2031) | USD 5.19 Billion |
| Growth Rate (2026 - 2031) | 8.74% CAGR |
| Fastest Growing Market | Asia |
| Largest Market | North America |
| Market Concentration | Medium |
Major Players *Disclaimer: Major Players sorted in no particular order Image © Mordor Intelligence. Reuse requires attribution under CC BY 4.0. | |
Secondary Ticket Market Analysis by Mordor Intelligence
secondary ticket market size in 2026 is estimated at USD 3.41 billion, growing from 2025 value of USD 3.14 billion with 2031 projections showing USD 5.19 billion, growing at 8.74% CAGR over 2026-2031. Growth is driven by rapid mobile-first adoption, the spread of NFT-enabled verification, and rising cross-border event tourism. Regulatory reforms that require all-in pricing are reshaping fee structures, while digital wallets are collapsing the distance between discovery and entry. Competition is intensifying as blockchain-native exchanges enter the field and established players expand into direct issuance. Untapped upside remains in Asia-Pacific, where new stadiums, dynamic pricing, and a rising middle class combine with a strong smartphone culture.
Key Report Takeaways
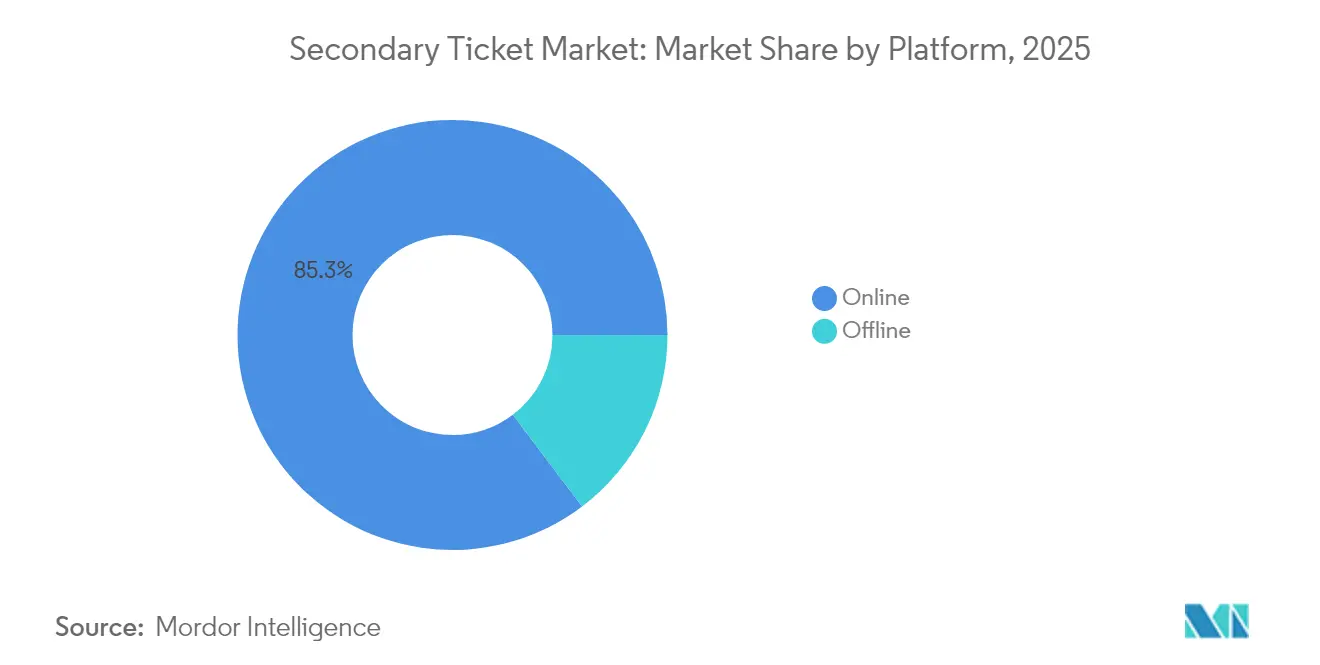
- By platform, online channels held 85.30% of the secondary ticket market share in 2025, whereas offline formats contracted; online revenue is tracking a 10.05% CAGR through 2031.
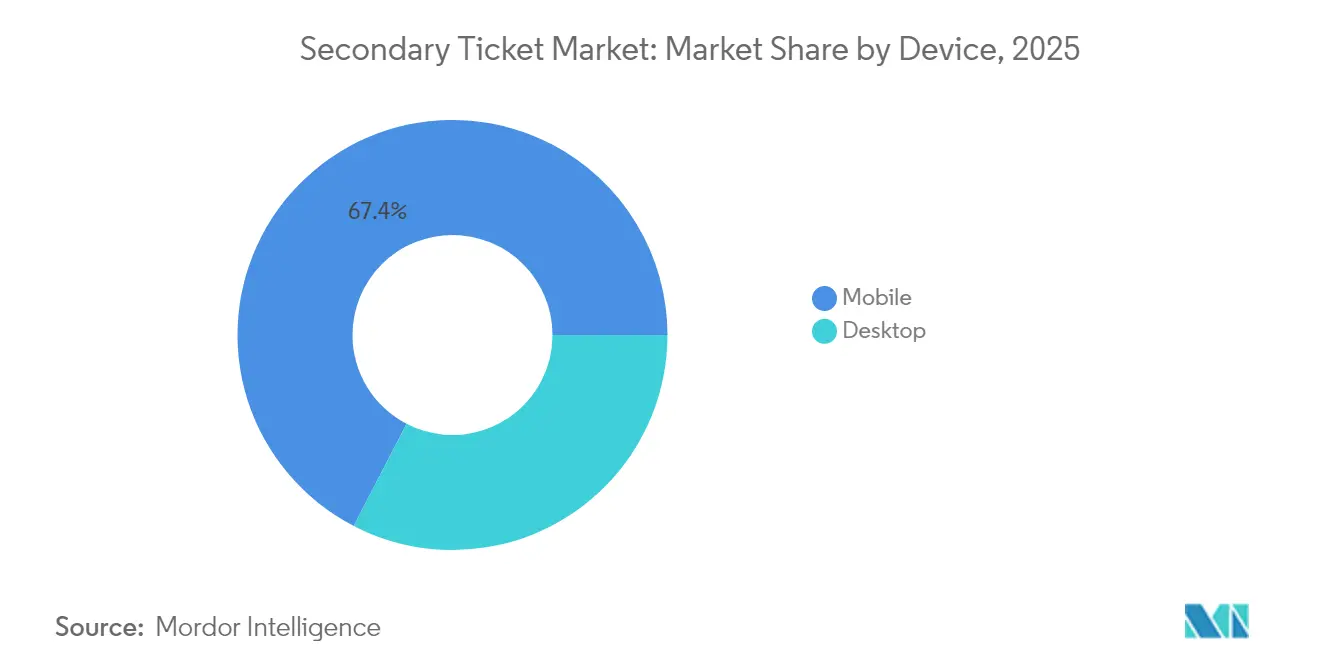
- By device, mobile completed 67.40% of all online transactions in 2025; the segment is forecast to expand at an 11.33% CAGR, the fastest rate across the market.
- By event type, live concerts dominated with 37.60% revenue share in 2025, while festivals are projected to grow at a 11.25% CAGR to 2031.
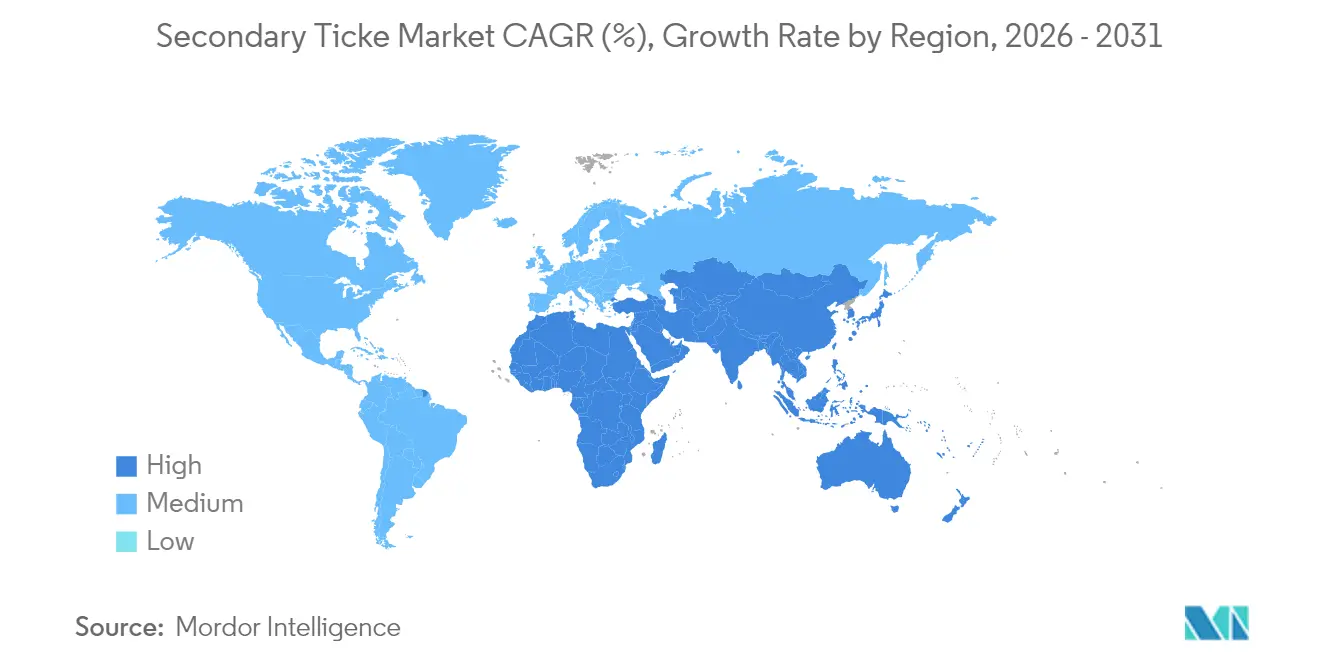
- By geography, North America led with 37.70% of the secondary ticket market size in 2025, while Asia-Pacific is advancing at an 11.05% CAGR, the highest regional rate.
Note: Market size and forecast figures in this report are generated using Mordor Intelligence’s proprietary estimation framework, updated with the latest available data and insights as of 2026.
Global Secondary Ticket Market Trends and Insights
Drivers Impact Analysis*
| Driver | (~) % Impact on CAGR Forecast | Geographic Relevance | Impact Timeline |
|---|---|---|---|
| Accelerated Mobile-First Purchasing Behaviour in North America | +1.20% | North America, with spillover to Europe | Short term (≤ 2 yrs) |
| Rising Frequency of Hybrid & Multi-Day Live Events in Europe | +1.50% | Europe, North America | Medium term (~ 3-4 yrs) |
| Dynamic Pricing Adoption by Major Sports Franchises in Asia | +0.90% | Asia-Pacific, North America | Medium term (~ 3-4 yrs) |
| Expansion of NFT-Enabled Smart Tickets for Artist Communities | +0.80% | Global, with early adoption in North America and Europe | Long term (≥ 5 yrs) |
| Growth of Cross-Border Event Tourism in Middle East | +0.60% | Middle East, with spillover to Europe and Asia | Medium term (~ 3-4 yrs) |
| Consolidation of Ticket Exchanges with Digital Wallet Ecosystems | +0.90% | Global | Long term (≥ 5 yrs) |
| Source: Mordor Intelligence | |||
Accelerated Mobile-First Purchasing Behaviour in North America
Mobile channels now account for 68% of secondary ticket checkouts, a share that rose 12% year over year. Ticketmaster reported a 70% spike in app usage and StubHub lifted mobile conversion by 22% after its 2024 redesign. Gen Z completes 83% of purchases on smartphones inside a two-day discovery window, forcing platforms to prioritise biometric login, one-tap payments, and real-time ticket transfer. Faster paths to purchase underpin the higher 22% mobile conversion advantage over desktop and contribute directly to the overall secondary ticket market expansion.
Expansion of NFT-Enabled Smart Tickets for Artist Communities
NFT smart tickets redirect 7-10% of resale value back to creators, adding USD 87 million in artist income during 2024. Beyond royalties, the token doubles as a collectible that lengthens fan engagement to an average of 73 days after events. Counterfeit risk drops 98% because on-chain metadata authenticates every transfer. Early adopters include Coachella, where post-festival interaction was nine times higher than with traditional barcodes. Adoption remains at a mid-complexity stage but is scaling through partnerships between exchanges and layer-one blockchains.
Consolidation of Ticket Exchanges with Digital Wallet Ecosystems
Digital wallets are acquiring resale platforms, reducing the average purchase journey from eight clicks to three. Apple Pay and Google Wallet together processed USD 340 million in secondary ticket volume within six months of adding resale functions. Integrated ecosystems secure a 34% higher conversion rate and 28% faster settlement. The fraud advantage is equally material because face ID or fingerprint checks stop most account-takeover attempts. As wallets bundle finance, identity, and ticket storage, they reinforce user loyalty and move the secondary ticket market further toward a single-app environment.
Rising Frequency of Hybrid and Multi-Day Live Events in Europe
Forty-three percent of top European festivals now run four or more days, up from 28% in 2022. Multi-day passes enable partial resales, with 37% of holders offloading days they cannot attend. Hybrid streaming options, present at 22% of large events, also split inventory into in-person and virtual credentials that circulate independently. As a result, daily resale peaks cluster 48–72 hours before each festival block rather than aligning strictly with the opening date. Platforms are tuning price grids to these shorter demand spikes and retooling dashboards for day-level listings.
Restraints Impact Analysis*
| Restraint | (~) % Impact on CAGR Forecast | Geographic Relevance | Impact Timeline |
|---|---|---|---|
| Regulatory scrutiny on price gouging | -1.30% | North America, Europe | Medium term (2-4 years) |
| Counterfeit QR attacks on mobile tickets | -0.70% | Asia-Pacific | Short term (≤ 2 years) |
| High Settlement Fees on Cross-Border Transactions in Emerging Markets | -0.50% | Latin America, Middle East, Africa | Medium term (~ 3-4 yrs) |
| Saturation of Movie Theatre Attendance Post-Pandemic | -0.30% | Global | Short term (≤ 2 yrs) |
| Source: Mordor Intelligence | |||
Escalating Regulatory Scrutiny on Price Gouging in US and EU
The FTC rule that takes effect in May 2025 bans drip pricing and mandates all-in disclosure at the first price display. A parallel EU focus on merger control and bot enforcement is narrowing the margin of leeway for platforms. Compliance redesigns are absorbing 3-5% of revenue and pushing firms to unify service charges into headline prices. The reforms improve buyer trust but compress fee-based profits and increase the need for cost-efficient verification technology.
Persistent Counterfeit-QR Attacks on Mobile Tickets in APAC
Dynamic QR spoofing has raised fraud anxiety across Tokyo, Seoul, and Shanghai, where venue connectivity gaps limit real-time checks. Surveys show 28% of consumers in Asia-Pacific avoid secondary channels for premium events because of authentication doubts. The vulnerability is most acute for high-value concerts where fake codes pass superficial scans yet fail at entry. Although biometric ticket gates and blockchain stamping are rolling out, uneven adoption leaves a near-term drag on the secondary ticket market in the region.
*Our forecasts treat driver/restraint impacts as directional, not additive. The impact forecasts reflect baseline growth, mix effects, and variable interactions.
Segment Analysis
By Platform: Online Scale Redefines Offline Service
Online sales captured 85.30% of 2025 revenue and are widening their lead at a 10.05% CAGR to 2031. The secondary ticket market size for online channels is projected to exceed USD 4.35 billion by the end of the period, powered by friction-free checkout, fee transparency, and real-time seat maps. Offline points of sale have retreated to a 14.70% niche, serving older patrons, premium hospitality bundles, and venues in regions with limited broadband.
Digitally native buyers now finalise 78% of decisions without face-to-face support. Offline desks are pivoting into support and dispute resolution hubs rather than core revenue engines. Hybrid operators that merge in-person service with app-based upsell are preserving relevance, yet the cost per transaction trend favours pure digital at scale. Consolidation among online leaders is likely to extend the secondary ticket market share of web and app channels over traditional box offices.


By Device: Mobile Uplifts Conversion and Security
Mobile accounted for 67.40% of online orders in 2025 and is tracking an 11.33% CAGR through 2031. The surge reflects always-on discovery, embedded wallets, and single-tap ticket transfer. Biometric login has lowered fraud incidents by 76%, addressing a former barrier to mobile trust. Younger cohorts push the metric higher, with Gen Z hitting 83% mobile share.
Desktop retains importance for group buys and VIP packages, where larger screens aid seat selection and contract review. Average desktop basket values are 32% higher, so platforms maintain dual-track optimisation rather than ceding all focus to phones. Nonetheless, the secondary ticket market size realized through handheld devices is set to eclipse USD 3.35 billion by 2031, confirming mobile as the default channel.
By Event Type: Concerts Hold Lead While Festivals Surge
Concerts captured 37.60% of 2025 turnover due to artist scarcity and tour clustering that drive secondary premiums. Sporting events followed at 31.10%, benefiting from schedule uncertainty and rivalry intensity. Festivals, though smaller at 18.30%, expand at a 11.25% CAGR, the highest among categories, as multi-day formats multiply resale touchpoints. The secondary ticket market size for festivals is on pace to double during the forecast window.
Movies and theatre, at 13.00%, face structural headwinds from streaming and reprioritised leisure budgets. Resale action concentrates on IMAX openings and limited runs rather than routine screenings. Meanwhile, festival passes exhibit 30% price dips inside a two-week pre-event window, creating arbitrage for time-sensitive buyers. Sporting demand continues to hinge on team performance, with uncertain outcomes lifting resale values for playoff berths and cup finals.
Geography Analysis
North America led the secondary ticket market with a 37.70% share in 2025 and maintains a robust outlook despite tight regulation. Mobile usage exceeds the global baseline by 17%, and wallet uptake accelerates as stadiums upgrade to contactless entry. State-level legislation on bots and junk fees adds compliance costs yet also boosts consumer trust, supporting stable growth.
Asia-Pacific is the fastest-growing arena at an 11.05% CAGR. Smartphone first habits, stadium construction, and expanding middle-class budgets lift volumes, especially in China, India, and Southeast Asia. Dynamic pricing in Japan and South Korea aligns primary prices with demand, reshaping resale spreads. Fraud fears tied to counterfeit QR codes remain the principal brake on velocity, but ongoing rollouts of blockchain stamping and biometric gates are expected to mitigate risk over the next two years.
Europe, holding a 27.10% share, is distinguished by strong consumer protection and innovation in hybrid formats. Multi-day passes and NFT royalty deals position the region at the vanguard of inventory slicing and artist compensation. Regulatory agencies examine merger effects to guard against excessive concentration, yet e-commerce turnover of EUR 887 billion in 2023 supplies a solid digital foundation. Currency stability and open borders further stimulate cross-border ticket flows among Schengen states .

Competitive Landscape
The market shows moderate concentration, anchored by Ticketmaster, StubHub, and SeatGeek. These incumbents extend beyond resale into primary issuance, blurring traditional lines and enlarging the secondary ticket market footprint. Technology leadership has emerged as the differentiator. Platforms commit to real-time pricing engines, AI-based fraud scrubbing, and in-app inventory discovery, raising entry barriers for late movers.
Blockchain innovators target authenticity and artist royalty gaps. Partnerships such as SI Tickets with Avalanche and the New York Red Bulls aim for full smart-ticket deployment by 2026 [2]Avalanche, “Avalanche to Power SI Tickets’ NFT Platform,” avax.network. Digital wallets embed secondary exchanges to lock in user retention and generate fee synergy. Meanwhile, antitrust oversight, illustrated by the United States Department of Justice review of Live Nation, represents a strategic uncertainty for dominant players. Regional specialists continue to thrive by focusing on last-minute localisation, fee-free positioning, or by curating inventory for niche audiences such as esports or college sports [3]New York Red Bulls, “Sports Illustrated Stadium Partnership Announcement,” newyorkredbulls.com.
The talent ecosystem adapts in parallel. Promoters, teams, and venues negotiate direct resale channels to retain insight into customer data and to capture incremental revenue. Some artists mandate face-value transfer caps, pushing platforms to refine verification layers. Competitive intensity is expected to heighten as wallet-native, blockchain-secure, and subscription-based models jostle for share in a market forecast to add USD 1.66 billion over the next five years.
Secondary Ticket Industry Leaders
Ticketmaster Entertainment, LLC
StubHub
SeatGeek, Inc.
Vivid Seats LLC
TickPick LLC
- *Disclaimer: Major Players sorted in no particular order

Recent Industry Developments
- April 2025: StubHub entered a strategic alliance with ATG to widen distribution reach and accelerate UX improvements.
- April 2025: Most Valuable Promotions renewed its multi-year pact with Event Tickets Center for high-demand boxing inventory.
- March 2025: StubHub filed for an IPO after reporting a 29% rise in 2024 secondary ticket turnover.
- March 2025: The United States issued an Executive Order directing the FTC to step up enforcement of the BOTS Act.


Research Methodology Framework and Report Scope
Market Definitions and Key Coverage
Our study defines the secondary ticket market as the gross value of tickets that change hands after the initial on-sale, covering broker-facilitated and platform-mediated resales for concerts, sports, theaters, festivals, and cinema; face-value primary transactions remain outside scope. According to Mordor Intelligence analysts, fees earned by digital exchanges and licensed brokers are included because they shape true spend behavior.
Scope exclusion: informal peer-to-peer cash swaps and purely collectible NFTs with no admission right are not modeled.
Segmentation Overview
- By Platform
- Online
- Offline
- By Device(Online Only)
- Desktop
- Mobile
- By Event Type
- Movies and Theatres
- Live Concerts
- Sporting Events
- Festivals and Others
- By Geography
- North America
- United States
- Canada
- Mexico
- South America
- Brazil
- Argentina
- Rest of South America
- Europe
- Germany
- United Kingdom
- France
- Italy
- Spain
- Rest of Europe
- Asia-Pacific
- China
- Japan
- South Korea
- India
- Rest of Asia-Pacific
- Middle East and Africa
- United Arab Emirates
- Saudi Arabia
- South Africa
- Rest of Middle East and Africa
- North America
Detailed Research Methodology and Data Validation
Primary Research
Mordor analysts interviewed event promoters, large brokers, payment processors, and consumer-rights groups across North America, Europe, and Asia-Pacific. These conversations clarified platform fee trajectories, regional regulatory rollouts, and willingness-to-pay thresholds, letting us adjust desk-research assumptions with ground-level reality.
Desk Research
We pulled foundational data from tier-one public sources such as SEC filings of listed exchanges, FTC fee-transparency dockets, Eurostat cultural attendance surveys, Japan Tourism Agency event counts, and National Collegiate Athletics Association ticket reports. Complementary signals on smartphone ticket adoption, resale premiums, and cross-border event tourism were gathered from trade association releases, customs statistics, and reputable press. Company-level intelligence came through D&B Hoovers, while news verification used Dow Jones Factiva.
The sources named illustrate our approach; many additional publications, datasets, and regulatory registers were reviewed to confirm trends, fill gaps, and validate inputs.
Market-Sizing & Forecasting
We applied a top-down build that starts with global live-event attendance, layers smartphone penetration, online-transaction share, dynamic-pricing adoption, cross-border fan travel, and median resale premium, and then reconciles outputs with selective bottom-up roll-ups of platform GMV and sampled ASP × volume checks. A multivariate regression projects each driver to 2030; scenario analysis tests impacts of fee caps or anti-bot laws. Where disclosures were missing, we imputed values using benchmarked scalped-inventory ratios.
Data Validation & Update Cycle
Outputs pass two analyst reviews that flag variances over three percent against external indicators. Models refresh annually, with mid-cycle updates triggered when material events, such as new fee-cap legislation or a mega-sporting bid, shift fundamentals. A final pre-publication sweep ensures clients receive our latest view.
Why Our Secondary Ticket Baseline Commands Reliability
Published estimates often diverge because firms adopt different event baskets, fee structures, and refresh cadences.
Some blend primary and secondary revenue or assume static premiums, which inflates totals and obscures regional nuance.
Benchmark comparison
| Market Size | Anonymized source | Primary gap driver |
|---|---|---|
| USD 3.14 billion | Mordor Intelligence | - |
| USD 4.24 billion | Global Consultancy A | Includes face-value markups and omits country splits |
| USD 9.77 billion | Market Analytics B | Extrapolates from overall online ticketing and applies flat 30% premium |
Latest available year 2024.
The comparison shows that Mordor's disciplined scoping, driver-level forecasting, and annual refresh provide a balanced, transparent baseline that decision-makers can trust.


Key Questions Answered in the Report
What is the current secondary ticket market size and how fast is it growing?
The secondary ticket market size reached USD 3.41 billion in 2026 and is growing at an 8.74% CAGR to hit USD 5.19 billion by 2031.
Which region is expanding the fastest in secondary ticket sales?
Asia-Pacific leads growth with an 11.05% CAGR through 2031, propelled by smartphone adoption, dynamic pricing in sports, and rising consumer spending.
Why are NFT smart tickets important for the secondary ticket industry?
NFT tickets let artists earn 7-10% royalties on resales, shrink counterfeit risk by 98%, and keep fans engaged for 73 days on average after events.
How will new FTC rules affect ticket resale platforms?
Starting May 2025, US platforms must show all-in prices upfront and cannot use drip fees, which trims fee-based margins by an estimated 3-5%.
Are mobile devices now the dominant channel for secondary ticket purchases?
Yes, mobile completed 67.40% of online transactions in 2025 and is on track to exceed a USD 3.35 billion share of market revenue by 2031.
Page last updated on:


