
Dental Diagnostic And Surgical Market Size and Share
Market Overview
| Study Period | 2020 - 2031 |
|---|---|
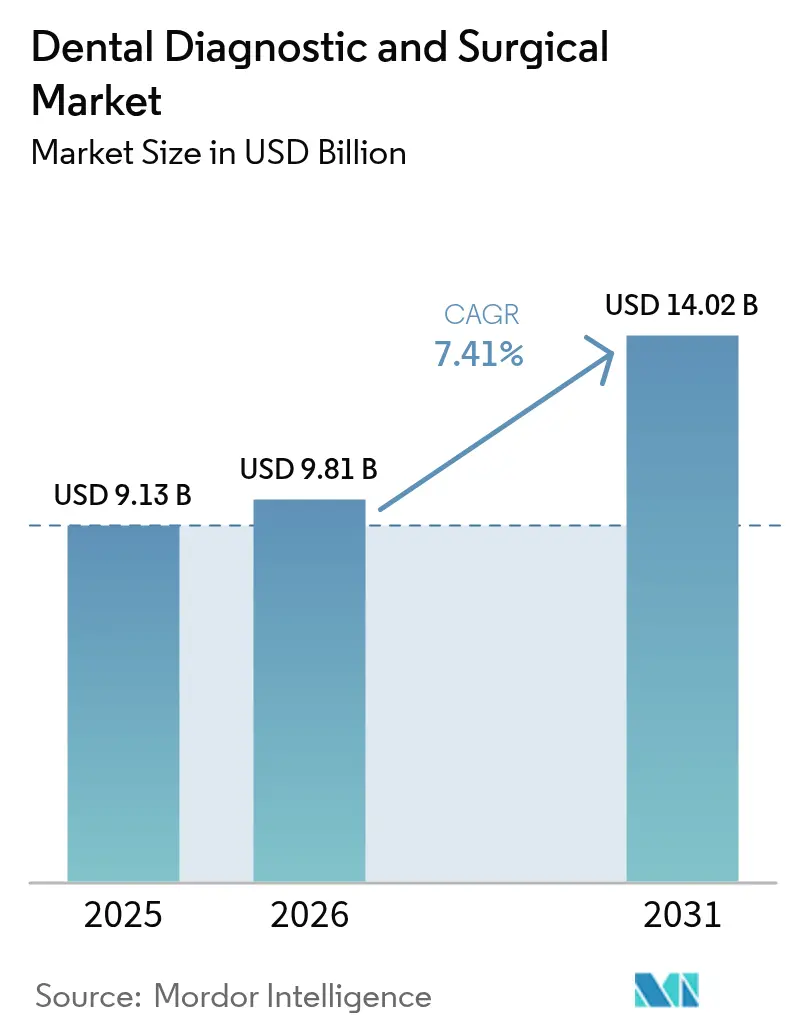
| Market Size (2026) | USD 9.81 Billion |
| Market Size (2031) | USD 14.02 Billion |
| Growth Rate (2026 - 2031) | 7.41 % |
| Fastest Growing Market | Asia-Pacific |
| Largest Market | Europe |
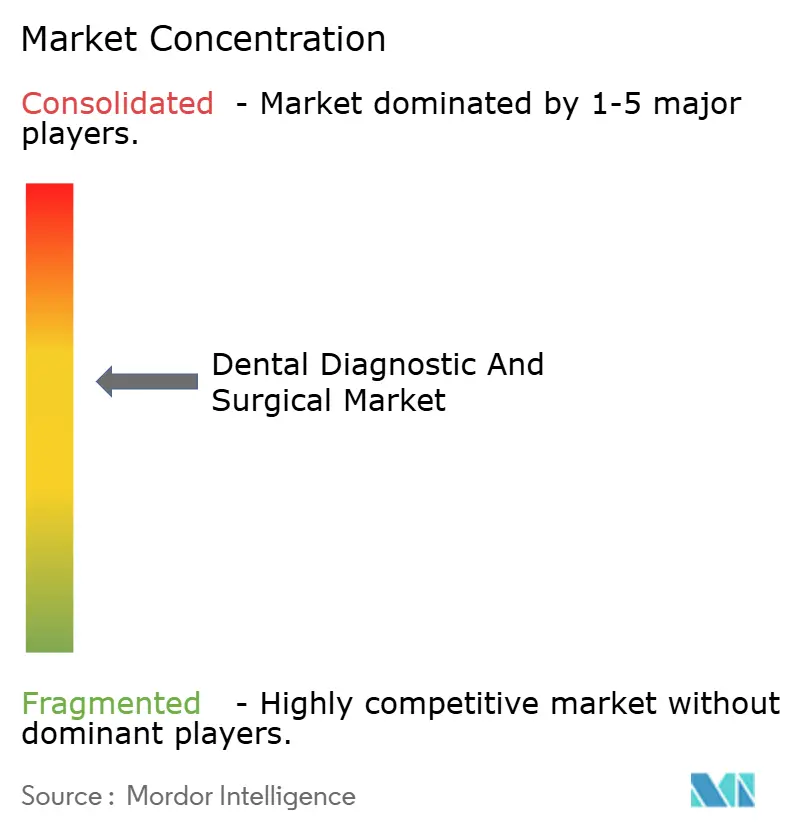
| Market Concentration | Medium |
Major Players *Disclaimer: Major Players sorted in no particular order Image © Mordor Intelligence. Reuse requires attribution under CC BY 4.0. | |
Dental Diagnostic And Surgical Market Analysis by Mordor Intelligence
The dental diagnostic and surgical market size in 2026 is estimated at USD 9.81 billion, growing from 2025 value of USD 9.13 billion with 2031 projections showing USD 14.02 billion, growing at 7.41% CAGR over 2026-2031. Technology convergence, aging populations, and the standardization of digital workflows continue to re-shape clinical practice, while artificial intelligence adoption now supports more than 30,000 daily imaging reads worldwide. Heightened patient demand for minimally invasive care, faster procedure turnaround, and aesthetically superior outcomes is pushing clinics toward rapid chair-side CAD/CAM, CBCT imaging, and laser platforms. Consolidation through Dental Service Organizations (DSOs) is increasing purchasing power, driving bulk equipment deals, and compressing supplier margins. Meanwhile, government-funded preventive programs in Europe and rising middle-class disposable income in Asia-Pacific widen the addressable base for restorative and diagnostic systems. Competitive intensity is therefore shifting from hardware differentiation to integrated software ecosystems, with manufacturers racing to bundle imaging AI, practice management, and cloud analytics on a single platform.
Key Report Takeaways
- By equipment type, Dental Systems & Equipment led with 43.84% of dental diagnostic and surgical market share in 2025, while Dental Lasers are forecast to expand at a 8.88% CAGR through 2031.
- By treatment, Orthodontics commanded 34.92% of the dental diagnostic and surgical market size in 2025, yet Periodontics is projected to grow at an 8.52% CAGR between 2026 and 2031.
- By end user, Dental Clinics held 64.35% of 2025 revenue, whereas DSOs are poised for the fastest 7.62% CAGR to 2031.
- By geography, Europe retained 31.85% of 2025 sales, but Asia-Pacific is expected to register the highest 8.38% CAGR over the forecast period.
Note: Market size and forecast figures in this report are generated using Mordor Intelligence’s proprietary estimation framework, updated with the latest available data and insights as of 2026.
Market Trends and Insights
Drivers Impact Analysis of Dental Diagnostic And Surgical Market*
| Driver | (~) % Impact on CAGR Forecast | Geographic Relevance | Impact Timeline |
|---|---|---|---|
| High Prevalence Of Untreated Dental Caries Worldwide | +1.2% | Global, with highest impact in emerging markets | Long term (≥ 4 years) |
| Accelerating Adoption Of Chair-Side CAD/CAM & 3-D Printing | +1.8% | North America & EU leading, APAC catching up | Medium term (2-4 years) |
| Expansion Of Dental Service-Organization (DSO) Networks | +1.5% | North America primary, expanding to EU | Medium term (2-4 years) |
| AI-Powered Intra-Oral Imaging & Diagnostics | +1.3% | Global, concentrated in developed markets | Short term (≤ 2 years) |
| Demand Surge For Minimally-Invasive Laser Dentistry In APAC | +0.9% | APAC core, spill-over to MEA | Medium term (2-4 years) |
| Government-Funded Preventive Oral-Health Programs (EU) | +0.6% | EU primary, model spreading globally | Long term (≥ 4 years) |
| Source: Mordor Intelligence | |||
High Prevalence of Untreated Dental Caries Worldwide
Untreated caries continue to affect large adult populations, with panoramic radiograph analyses identifying periodontal involvement in nearly 19% of adults. AI-enabled imaging platforms now achieve more than 93% diagnostic accuracy and 95.65% specificity, allowing clinicians to flag demineralization at an earlier, reversible stage. As payers favor preventive intervention over costly restorative care, practices view advanced diagnostics as revenue-protective investments. Emerging economies present the greatest upside because delayed treatment historically results in complex extractions, fueling demand for cone-beam CT and laser incision. Equipment makers are responding with platform bundles that couple intra-oral scanners, AI overlays, and chair-side milling to compress treatment cycles, lower per-case cost, and widen access to care.
Accelerating Adoption of Chair-Side CAD/CAM & 3-D Printing
Chair-side CAD/CAM shrinks full-arch restoration timelines from five sessions to as few as two, a workflow shift embraced by 81% of surveyed dentists who rate in-office restorations comparable to or better than laboratory output. Practices that install integrated scanners, design stations, and milling units cite higher per-patient revenue and improved chair utilization. The capital hurdle remains high—USD 60,000–80,000 per system—yet ROI is compelling when same-day crowns boost case acceptance and halve temporary material costs. Additive manufacturing extends these advantages by producing surgical guides, aligner molds, and bite splints overnight, enabling personalized treatments at scale. As more suppliers launch entry-tier printers, the dental diagnostic and surgical market captures incremental demand from small offices previously priced out of the technology curve.
Expansion of Dental Service-Organization (DSO) Networks
DSOs currently employ roughly 25–30% of U.S. dentists, a share projected to climb toward 60–70% within 10 years. Consolidators aggregate multi-practice portfolios, negotiate national supply contracts, and impose standardized digital workflows that mandate CBCT imaging, chair-side CAD/CAM, and cloud analytics across all locations. Shared procurement drives double-digit equipment discounts, yet vendors recoup volume through groupwide adoption of proprietary software subscriptions. Equity investors favor DSO roll-ups because recurring hygiene revenue and predictable ortho case starts underpin leveraged acquisitions. Independent clinics now face a strategic decision: embrace high-ticket technology to stay competitive or sell into expanding DSO platforms—either way stimulating fresh demand for advanced operatory systems.
AI-Powered Intra-Oral Imaging & Diagnostics
More than 30 FDA-cleared dental AI algorithms now support clinical triage, caries grading, and periodontal bone-level mapping. Venture capital inflows exceeded USD 140 million during 2024[1]Cameron Cortigiano, “Dental AI’s big 2024: 30 updates to know,” beckersdental.com, accelerating product pipelines that overlay real-time decision support onto intra-oral scans. Practices deploying AI cite faster case presentation, stronger patient acceptance, and a measurable bump in restorative production because annotated images demystify treatment needs. Yet adoption challenges persist: clinicians require training on algorithm limitations, insurers weigh evidence thresholds for AI-billed codes, and IT teams must harden networks against data breaches. Vendors therefore bundle installation support, HIPAA-compliant cloud storage, and continuous model updates to smooth onboarding and cement subscription renewals, reinforcing long-run equipment attachment rates.
Restraints Impact Analysis of Dental Diagnostic And Surgical Market*
| Restraint | (~) % Impact on CAGR Forecast | Geographic Relevance | Impact Timeline |
|---|---|---|---|
| High Capital Cost & Limited Reimbursement For Equipment | -1.8% | Global, most acute in emerging markets | Long term (≥ 4 years) |
| Shortage Of Skilled Dental Technologists In Emerging Markets | -1.1% | Emerging markets, spreading to developed regions | Medium term (2-4 years) |
| Cyber-Security Risks In Networked Imaging Systems | -0.7% | Global, concentrated in digitally advanced markets | Short term (≤ 2 years) |
| Slow Procurement Cycles In Public Hospitals (LATAM/MEA) | -0.9% | LATAM/MEA primary, affecting public sector globally | Long term (≥ 4 years) |
| Source: Mordor Intelligence | |||
High Capital Cost & Limited Reimbursement for Equipment
Digital X-ray, cone-beam CT, and CAD/CAM systems cost USD 30,000–80,000 each, creating funding hurdles for smaller offices. Fee schedules seldom cover AI screening or laser periodontal therapy, limiting direct reimbursement and elongating break-even horizons. Insurer consolidation further depresses professional fees; every 10% uptick in payer concentration correlates with a 1.95% reduction in dentist gross payments. Deferred purchases dampen unit volumes in cost-sensitive segments of the dental diagnostic and surgical market, especially in Latin America, Southeast Asia, and rural North America. Suppliers now promote leasing, subscription, and pay-per-scan models to lower upfront expense, but delayed cash recognition elevates working-capital strain across the supply chain.
Shortage of Skilled Dental Technologists in Emerging Markets
Rapid technology diffusion is outpacing workforce preparation. Many technicians learn CAD/CAM software directly from vendor workshops rather than accredited programs, leading to uneven skill quality. HRSA forecasts show the U.S. itself will face shortfalls of 29,740 hygienists and 11,860 general dentists by 2037[2]HRSA, “State of the U.S. Health Care Workforce, 2024,” hrsa.gov. Emerging economies wrestle with even steeper gaps where dental schools lack 3-D printing labs and AI curricula. Staffing deficits slow operatory throughput, underutilize installed equipment, and dampen repeat purchases. Manufacturers therefore integrate guided user interfaces, auto-calibration, and remote support to cut onboarding time, while professional associations lobby education ministries to expand dental technologist programs.
*Our forecasts treat driver/restraint impacts as directional, not additive. The impact forecasts reflect baseline growth, mix effects, and variable interactions.
Dental Diagnostic And Surgical Market Segment Analysis
By Equipment Type:
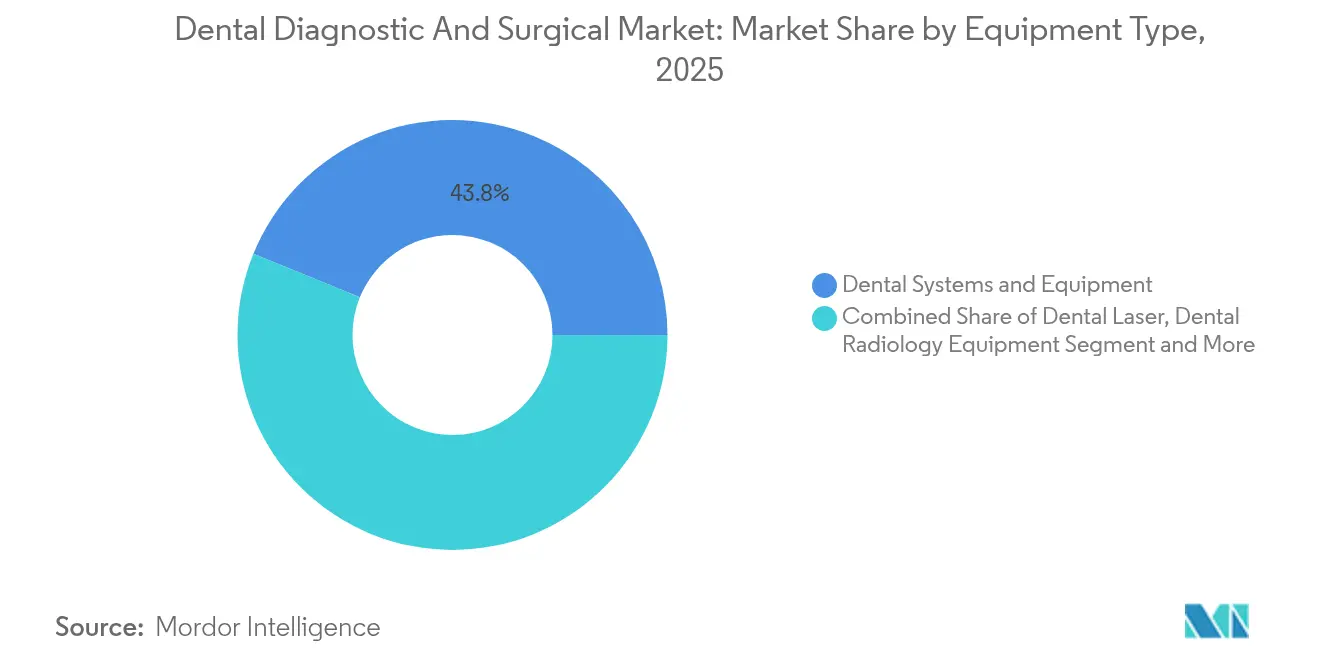
Systems Lead Volume, Lasers Accelerate GrowthThe dental diagnostic and surgical market remains anchored by Dental Systems & Equipment, a category covering chairs, delivery units, compressors, and suction that accounted for 43.84% revenue in 2025. Replacement cycles average seven to ten years, guaranteeing baseline demand as clinics expand capacity or refresh worn units. Digital radiology follows closely, driven by rising CBCT installations for implant planning and orthodontic assessment. Ancillary products—air-abrasion handpieces, intra-oral cameras, and composite-curing lights—continue to inch upward as practices digitize workflows and modernize operatories.
Dental Lasers represent the fastest-moving sub-segment, forecast at a 8.88% CAGR to 2031, as patients seek minimally invasive periodontal debridement, endodontic disinfection, and soft-tissue contouring. Practitioner interest is intensifying; while only 10% of dentists currently deploy lasers clinically, more than half possess theoretical knowledge of the modality. Manufacturers are responding with dual-wavelength units, touch-screen presets, and bundled training to shorten proficiency curves. Pricing remains a barrier—entry diode systems start near USD 12,000, whereas all-tissue erbium lasers exceed USD 60,000—yet DSOs increasingly write groupwide contracts that amortize costs across multi-office footprints. As advanced indications gain regulatory clearance, lasers are poised to capture restorative, implant, and pediatric niches, broadening their contribution to overall market revenue.



By Treatment:
Orthodontics Dominate, Periodontics Gain MomentumOrthodontic applications held 34.92% share of 2025 revenue, buoyed by clear-aligner therapy that pairs intra-oral scanning with AI treatment planning software. Same-day aligner staging leverages CBCT imaging and 3-D printing, stimulating recurring resin, trimming, and finishing consumables. Adult case starts are rising as social media emphasis on aesthetics meets tele-orthodontic consultations, further solidifying segment primacy. Prosthodontics remains the next-largest user of advanced equipment, where chair-side milling expedites crown and bridge delivery and improves marginal fit compared with traditional impressions.
Periodontics is the fastest-expanding application, on track for an 8.52% CAGR through 2031. AI-based bone-level detection systems identify early inflammatory changes and guide targeted debridement. Laser adjuncts reduce bacterial load and postoperative discomfort, elevating patient acceptance. Simultaneously, policy makers link periodontal health to diabetes and cardiovascular outcomes, promoting reimbursement for preventive scaling that harnesses ultrasonic and piezoelectric tools. Expanded hygienist scope of practice in several states also lifts chair utilization, further advancing equipment turnover in this nascent but high-growth slice of the dental diagnostic and surgical market.
By End User:
Clinics Anchor Demand, DSOs Drive Future GrowthDental Clinics captured 64.35% of 2025 purchases, underscoring the sector’s reliance on independent and small-group practices for distribution reach. Decision-making here is clinician-centric and ROI-focused; capital is often self-financed or sourced through local banks, prompting staged acquisition of scanners, milling machines, and lasers. These offices value modular upgrades that minimize workflow disruption and align with patient volume.
DSOs, though smaller in current revenue terms, represent the fastest-growing channel at a 7.62% CAGR. They standardize technology stacks across dozens to hundreds of locations, generating predictable demand spikes whenever a new regional platform is integrated. Group purchasing organizations secure 10–15% unit discounts, compelling suppliers to pursue exclusive long-term contracts that bundle hardware, software, and service. Hospitals and specialized dental laboratories round out end-user demand, investing primarily in surgical CBCT suites and high-throughput printers for indirect restorations.

Geography Analysis
Europe Dental Diagnostic and Surgical Market
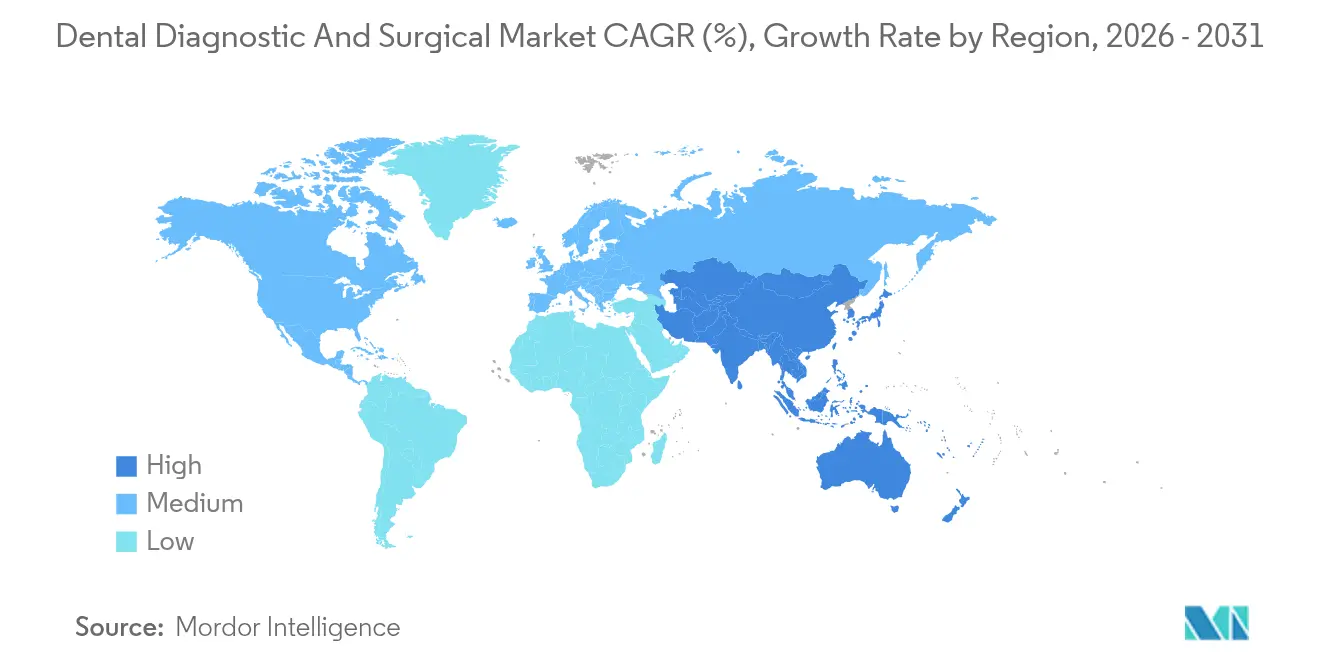
Europe maintained leadership with 31.85% of 2025 revenue thanks to universal or targeted oral health coverage, consistent reimbursement for preventive imaging, and well-funded university clinics that act as technology demonstration sites. Germany tops regional CAD/CAM penetration, while Scandinavia exhibits the highest digital radiography rates. Growth through 2031 will center on AI overlay integration, as regulators encourage outcome-based reimbursement and e-health interoperability. Southern Europe, where targeted coverage prevails, is opening private-sector opportunities for low-cost digital scanners and tabletop mills as dental tourism flows rise.
APAC Dental Diagnostic and Surgical Market
Asia-Pacific is the growth engine of the dental diagnostic and surgical market, forecast for an 8.38% CAGR. China’s Healthy China 2030 initiative enlarges public insurance coverage, leading provincial hospitals to purchase multi-chair clinics, CBCT suites, and sterilization centers. India’s private chains expand implantology and cosmetic dentistry, stimulating imports of lasers and chair-side printers. Japan and South Korea, early adopters of robotics and AI analytics, now export best practices to Southeast Asia through dental education programs. Workforce shortages persist, yet government scholarships and vendor-led training centers are starting to close the gap.
North America Dental Diagnostic and Surgical Market
North America remains technologically mature but far from saturated. Medicare Advantage’s limited dental benefits expansion broadens the insured base for senior care, driving CBCT demand for implant planning. DSOs’ aggressive roll-ups sustain high equipment volumes despite flat patient growth, because platform acquisitions trigger cap-ex harmonization and fleet upgrades. Canada’s public-private mix supports steady but moderate purchases, whereas Mexico shows uneven adoption due to reimbursement gaps but benefits from cross-border tourism that finances private clinic investments.

Competitive Landscape
The dental diagnostic and surgical market is moderately consolidated and trending toward tighter concentration as private equity funds fuel serial acquisitions. The top five suppliers now command the global revenue. Patterson Companies’ USD 4.1 billion buy-out by Patient Square Capital at a 49% premium illustrates rising valuations tied to integrated hardware-software ecosystems. Manufacturers are diversifying into adjacent consumables and cloud analytics to defend margins and lock in subscription revenue.
Technology leadership defines competitive advantage. Carestream Dental’s USD 525 million investment into its Oral Healthcare Innovation Hub targets AI workflow orchestration and remote-team collaboration, positioning the firm to unveil an end-to-end “Practice 2040” architecture. HuFriedyGroup’s acquisition of SS White Dental expands into carbide and diamond bur competencies, facilitating bundled instrument sales alongside operatory packs. Emerging AI specialists such as VideaHealth leverage 30-plus FDA clearances to secure distribution agreements with major imaging manufacturers, accelerating market penetration without owning hardware assets.
In emerging regions, mid-tier Asian brands bridge price gaps with feature-rich CBCT units and diode lasers priced 20–30% below western incumbents, forcing global leaders to intensify service and warranty offerings. Meanwhile, consumables giants partner with robotics startups to enter the fully automated impression-to-milled crown workflow. Overall, vendor strategies now converge on platform openness, API connectivity, and cyber-secure data environments, setting the next competitive frontier beyond pure equipment specification sheets.
Dental Diagnostic And Surgical Industry Leaders
Dentsply Sirona
Carestream Health
Envista holdings Corporations
Planmeca Oy
Solventum Corporation
- *Disclaimer: Major Players sorted in no particular order
Dental Diagnostic And Surgical Market Companies Covered in this Report
- Dentsply Sirona
- Envista holdings Corporations
- Carestream Health
- Planmeca
- Solventum Corporation
- A-dec
- BIOLASE
- GC Corporation
- Patterson Companies
- Midmark
- Acteon Group
- Ivoclar Vivadent
- Henry Schein
- Align Technology
- Straumann Group
- Fotona d.o.o
- LED Dental (Kavo Kerr)
- VATECH Co. Ltd.
- FONA Dental
- SDI
- DMG Chemisch-Pharmazeutische Fabrik

Market Opportunities and Future Outlook
Opportunity is building around fully digital, cloud-integrated dentistry stacks that connect CBCT and intraoral imaging, AI-assisted diagnostics, and chairside fabrication. With AI adoption already supporting more than 30,000 daily imaging reads worldwide and more than 30 FDA-cleared dental AI algorithms available, vendors have whitespace to bundle workflow software, cybersecurity, and services with imaging and operatory hardware, which can simplify deployment for DSOs and multi-site clinic groups. In high-penetration markets such as the United States and Northern Europe, where intraoral scanner penetration has exceeded 60%, upgrade cycles increasingly focus on interoperability (open APIs, cloud analytics, and unified patient records) rather than standalone device specifications.
Regulatory and manufacturing pathways also create room for faster commercialization across established device categories and in-office production. In March 2026, the European Commission adopted delegated regulations that expanded the EU MDR Well-Established Technologies (WET) list to include dental implants, crowns, and orthodontic appliances, reducing clinical investigation requirements for certain established technologies and supporting quicker label and portfolio refreshes in Europe. On the supply side, March 2026 full-scope EU MDR certification for 3D Systems digital denture manufacturing supports broader European commercialization of additive workflows, reinforcing the shift of restorative output toward on-demand, in-clinic, and near-clinic production. Together, these changes support packages with predictable per-unit economics (leasing, subscriptions, pay-per-scan, and managed service) that help address the USD 30,000-80,000 capital hurdle that slows adoption in smaller offices and emerging markets.
Recent Industry Developments in Dental Diagnostic And Surgical Market
- May 2026: Envista Holdings Corporation announced an extension and expansion of its commercial partnership with dentalcorp. The announcement reinforces a group-level route to market with a large dental organization and supports standardized rollouts of imaging, treatment, and consumable platforms across multi-clinic networks.
- February 2026: Carestream Dental partnered with Leixir Dental Laboratory Group to offer a digital denture workflow that combines Carestream Dental CBCT systems with Leixir design and fabrication services. The partnership tightens the link between diagnostics and fabrication, helping practices and labs shorten turnaround times while increasing utilization of digital imaging and software-enabled workflows.
- October 2024: HuFriedyGroup completed its acquisition of SS White Dental, adding endodontic and rotary instrument lines and U.S. manufacturing capacity. The acquisition strengthens bundled instrument offerings for clinics and DSOs and improves supplier leverage in consolidated purchasing environments.


Dental Diagnostic And Surgical Market Report Scope and Research Methodology
Market Definition and Coverage
This market covers equipment and instruments used to diagnose dental conditions and perform surgical dental procedures in clinical settings, including imaging systems, CAD/CAM, handpieces, lasers, chairs, and related procedure equipment.
Scope exclusions: We exclude consumables and pharmaceuticals (such as restorative materials, implants as a consumable item, anesthetics, and disinfectants) unless they are sold as part of an equipment system.
Segments Covered in This Report
- By Type of Equipment
- Dental Systems & Equipment
- Dental Lasers
- Dental Radiology Equipment
- Other Types (Intra-oral cameras, CAD/CAM materials, etc.)
- By Treatment
- Orthodontic
- Endodontic
- Periodontic
- Prosthodontic
- By End User
- Hospitals
- Dental Clinics
- Dental Laboratories
- Dental Service Organizations
- Geography
- North America
- United States
- Canada
- Mexico
- Europe
- Germany
- United Kingdom
- France
- Italy
- Spain
- Rest of Europe
- Asia-Pacific
- China
- Japan
- India
- South Korea
- Australia
- Rest of Asia-Pacific
- Middle East and Africa
- GCC
- South Africa
- Rest of Middle East and Africa
- South America
- Brazil
- Argentina
- Rest of South America
- North America
Data Sources, Market Sizing, and Validation
Desk Research
Desk research started with building a clear map of what counts as diagnostic and surgical dental equipment, and where the revenues typically sit in the value chain. We used public sources such as the US FDA databases for device clearances and recalls, the US Census Bureau and UN Comtrade for trade direction checks on relevant equipment categories, and OECD health statistics for dentist density and utilization context.
Next, we cross-checked adoption signals using sources such as WHO oral health resources, peer-reviewed dental journals for technology uptake (for example, CBCT usage and chairside CAD/CAM workflows), and dental association publications that discuss practice patterns and procedure volumes. Company annual reports, investor presentations, and reputable press were used to understand pricing bands, product mix shifts, and distribution models. For fill-in checks, we also used paid subscriptions for company financials and intelligence, a patent database to track innovation pace, and an import-export shipment-level database for selected sanity checks. These desk research sources are illustrative only, and we relied on other public and paid references to collect, verify, and clarify the data points used in the model.
Primary Interviews and Surveys
Primary work focused on validating the boundary between core equipment revenues and adjacent spend that often gets mixed into market totals. We spoke with a mix of manufacturers, distributors, dental service organizations, clinic owners, and practicing clinicians to confirm utilization drivers, replacement cycles, and how technology upgrades show up in purchasing decisions across major regions.
Distribution of primary research fieldwork respondents
| Company type | Respondent position | Region |
|---|---|---|
| Top tier: 39% | CXOs: 16% | APAC: 45% |
| Mid tier: 45% | Functional/Unit leaders: 38% | EMEA: 34% |
| Smaller Players: 16% | Managers: 46% | Americas: 21% |
Market-Sizing & Forecasting
The core model uses a top-down build where procedure activity and care delivery capacity are reconstructed by region, and then converted into equipment demand using penetration and replacement assumptions. In practice, we tied demand to indicators such as the number of practicing dentists and clinics, the share of clinics adopting digital imaging and chairside CAD/CAM, average replacement cycles for chairs and handpieces, and capital budget sensitivity to financing and reimbursement conditions.
Those totals were stress-tested with selective bottom-up approximations, where we sampled revenues for key product groups and checked whether implied unit volumes and average selling prices felt realistic in channel discussions. Where gaps appeared, they were handled through conservative interpolation using neighboring countries with similar care delivery patterns, followed by a re-check with primary respondents. Forecasting relied on scenario analysis anchored to a central case, where we adjusted adoption curves for CBCT and digital workflows, assumed steady ASP progression by product maturity, and reflected macro factors like inflation and currency timing in the conversion logic.
Data Validation & Update Cycle
Validation was done in steps so the final numbers do not depend on one dataset or one assumption. We compared outputs against independent signals like equipment import trends, installed base expansion narratives, and stated capital spending trends from major dental channels, and then investigated any large variances before sign-off.
Anomalies triggered deeper checks, such as re-running sensitivity on replacement cycles, testing alternate adoption rates for imaging and CAD/CAM, and re-contacting a small set of experts when results drifted from what the market activity suggested. Reports are refreshed annually, and interim updates are made when material events change demand or pricing assumptions. Before delivery, a final analyst pass is done to confirm the latest macro inputs and to keep the model current.
Mordor Intelligence's Dental Diagnostic and Surgical Market Size Versus Other Published Estimates
Published market values for dental diagnostic and surgical equipment often differ because each publisher draws the line differently around what is included, and they also apply different pricing and currency timing assumptions. Differences also show up when the demand pool is built from procedure activity versus when it is inferred from broad dental equipment spending.
By tracking equipment-only revenues across imaging, CAD/CAM, chairs, lasers, and key surgical and diagnostic systems, and refreshing currency and replacement-cycle inputs every update, Mordor Intelligence keeps the total tied to a repeatable demand model that can be checked against adoption and trade signals.
Benchmark comparison
| Source | Market Size | Gaps in Research Methodology |
|---|---|---|
| Mordor Intelligence | USD 9.13 B (2025) | |
| Industry Publisher A | USD 13.02 B (2025) | This estimate appears to use a broader equipment definition that can pull in wider dental equipment spend and adjacent categories, and it may also apply different assumptions on ASP levels across high-ticket systems, which lifts the total. |
| Market Publisher B | USD 13.70 B (2025) | The scope signals suggest a wider basket across diagnostics and surgery equipment that can blend additional dental imaging and instrument categories, and differences in base-year alignment and currency conversion timing can further widen the reported value. |
The table mainly shows that scope boundaries and pricing logic create most of the spread, not a disagreement on direction of growth. When inclusions are kept consistent and assumptions are traced back to adoption, replacement, and procedure-linked demand, the market size becomes easier to reproduce and explain on a client call.


Key Questions Answered in the Report
What is the current size of the global dental diagnostic and surgical market?
The market is valued at USD 9.81 billion in 2026 and is forecast to reach USD 14.02 billion by 2031.
What compound annual growth rate (CAGR) is expected for the market through 2031?
Industry revenues are projected to expand at a 7.41% CAGR over the 2026-2031 period.
Which equipment category is expected to post the fastest growth?
Dental laser systems lead with a forecast 8.88% CAGR, fueled by demand for minimally invasive procedures.
Why are Dental Service Organizations (DSOs) pivotal to market expansion?
DSOs’ consolidation enables bulk purchasing and standardized technology roll-outs, driving groupwide upgrades that outpace independent clinic spending.
Which region is projected to grow the quickest?
Asia-Pacific is set for the highest regional CAGR at 8.38%, driven by rising middle-class demand, dental tourism, and supportive government programs.
Page last updated on:





