Market Overview
| Study Period | 2020 - 2031 |
|---|---|
| Forecast Data Period | 2026 - 2031 |
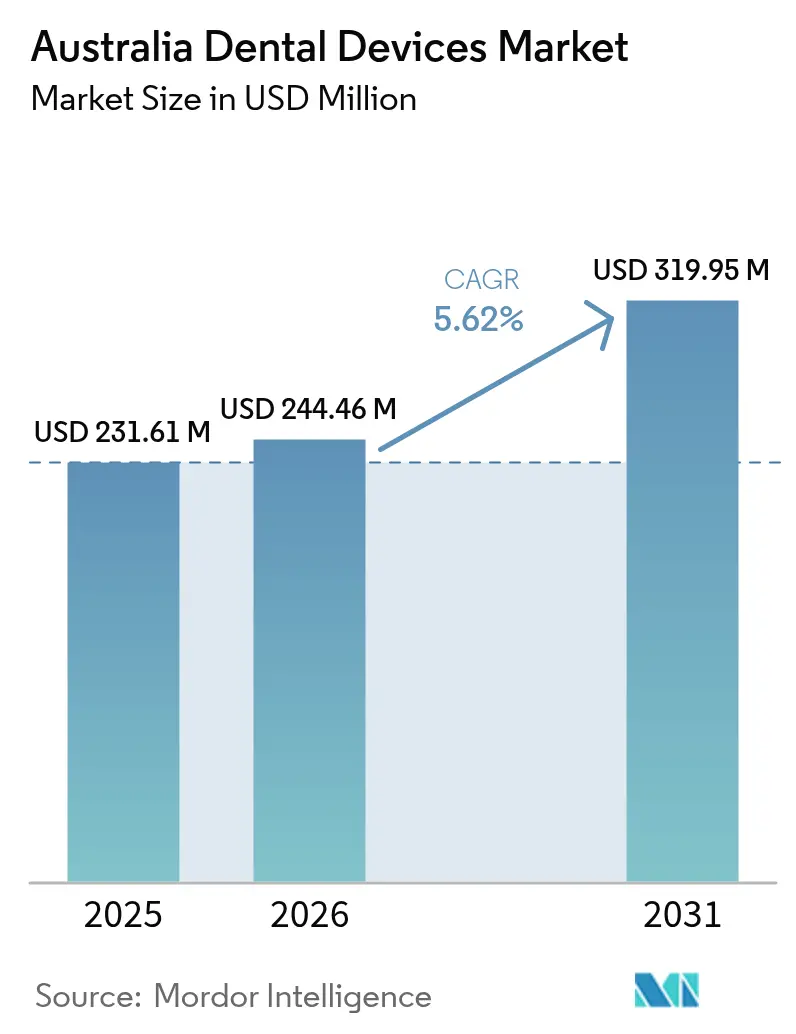
| Base Year Market Size (2025) | USD 231.61 Million |
| Market Size (2026) | USD 244.46 Million |
| Market Size (2031) | USD 319.95 Million |
| Growth Rate (2026 - 2031) | 5.62% CAGR |
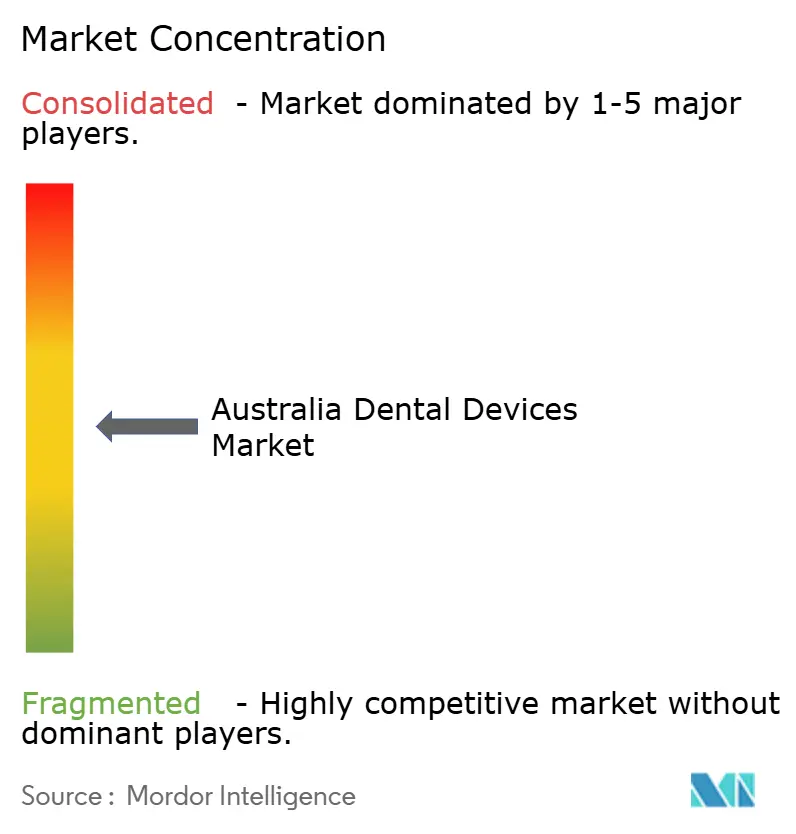
| Market Concentration | Medium |
Major Players*Disclaimer: Major Players sorted in no particular order Image © Mordor Intelligence. Reuse requires attribution under CC BY 4.0. | |
Australia Dental Devices Market Analysis by Mordor Intelligence
The Australia Dental Devices Market size was valued at USD 231.61 million in 2025 and is estimated to grow from USD 244.46 million in 2026 to reach USD 319.95 million by 2031, at a CAGR of 5.62% during the forecast period (2026-2031).
Private health insurance coverage of 43.6% in 2024 continues to underpin high-value restorative and orthodontic volumes, while the Child Dental Benefits Schedule cap of AUD 1,132 (USD 733) strengthens demand for routine consumables. Clear-aligner launches by Align Technology and Straumann are intensifying competition in premium orthodontics, and corporate consolidation among clinic chains is accelerating the uptake of CAD/CAM and 3D-printing workflows. Federal grants worth AUD 323.4 million (USD 210 million) between 2023-2026 are underwriting hospital purchases of CBCT scanners, digital radiography units, and bulk sterilizers. At the same time, circular-economy rules adopted in 2024 are nudging manufacturers toward modular, repairable product designs that lower waste and align with national advanced-manufacturing priorities.
Key Report Takeaways
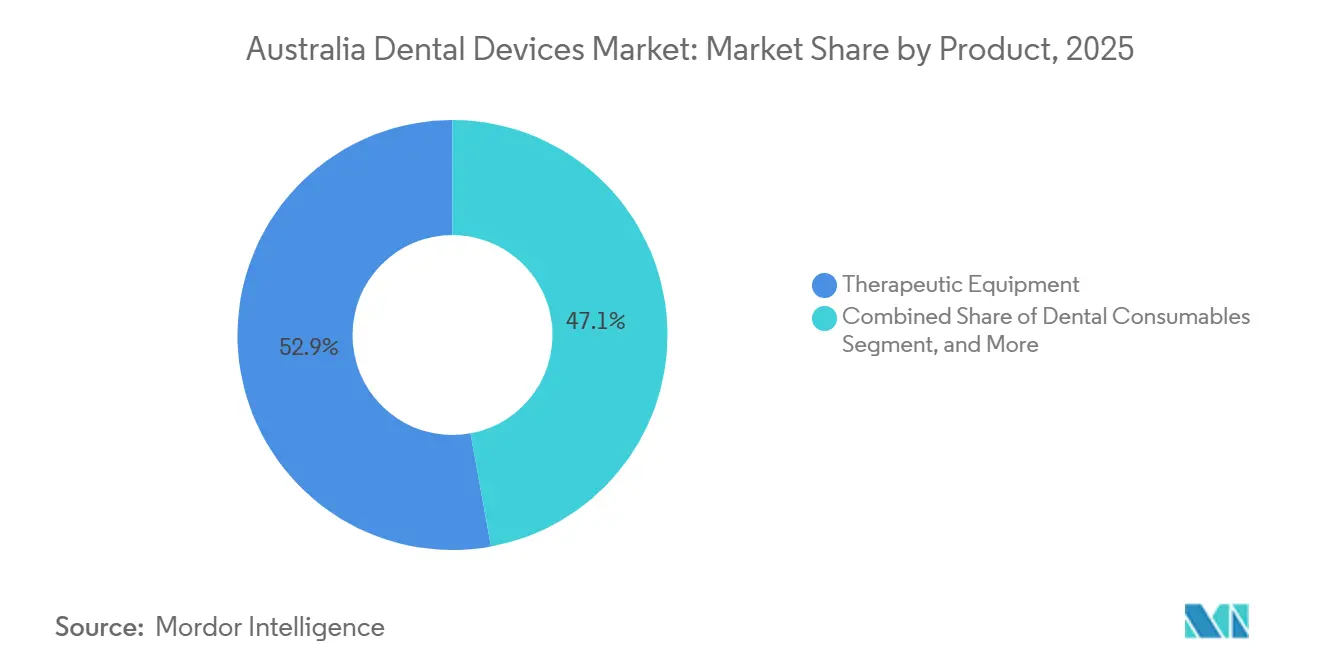
- By product category, therapeutic equipment led the Australian dental devices market with 52.88% market share in 2025, while dental consumables are advancing at a 6.29% CAGR through 2031.
- By treatment, prosthodontics accounted for 38.09% of the Australian dental devices market size in 2025, and orthodontics is expanding at a 7.99% CAGR to 2031.
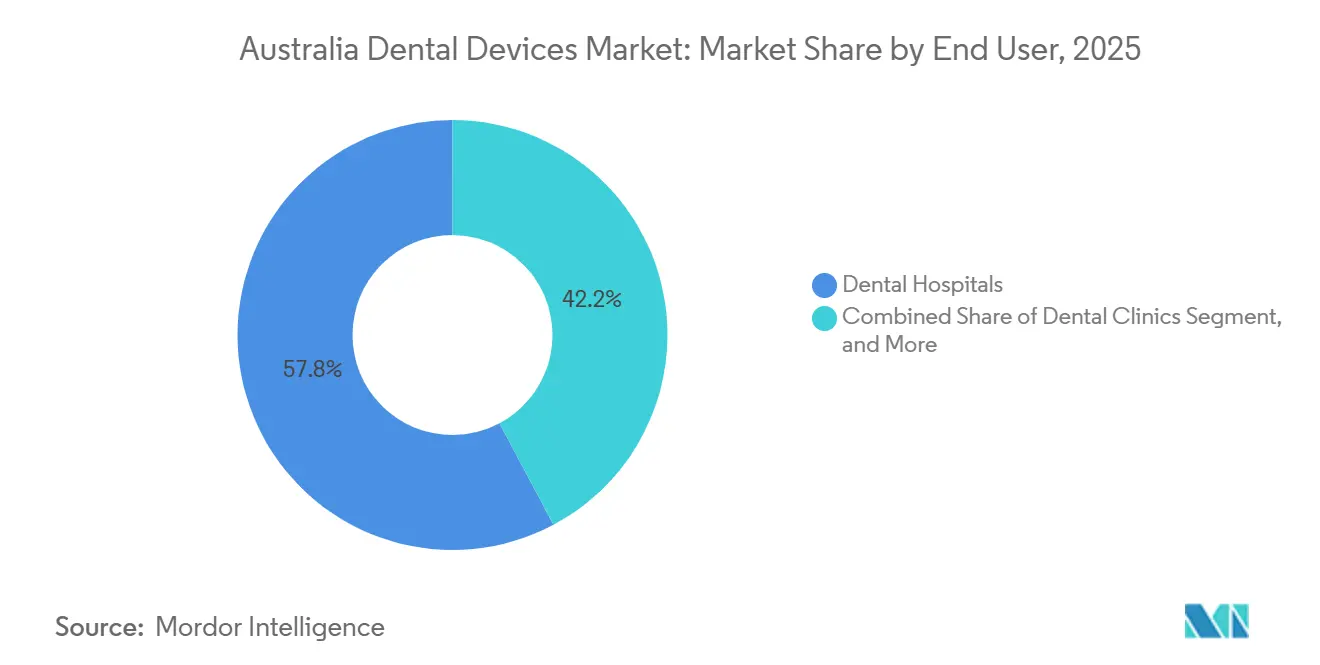
- By end user, dental hospitals accounted for 57.78% of revenue in 2025, and dental clinics are projected to grow at a 9.35% CAGR through 2031.
Note: Market size and forecast figures in this report are generated using Mordor Intelligence’s proprietary estimation framework, updated with the latest available data and insights as of 2026.
Australia Dental Devices Market Trends and Insights
Driver Impact Analysis*
| Driver | (~) % Impact on CAGR Forecast | Geographic Relevance | Impact Timeline |
|---|---|---|---|
| Rapidly Ageing Population Boosting Prosthetic & Implant Demand | +1.2% | National, concentrated in NSW, Victoria, Queensland | Long term (≥ 4 years) |
| Expansion of Commonwealth & Private-Insurance Dental Coverage | +0.9% | National, with stronger uptake in metropolitan areas | Medium term (2-4 years) |
| Accelerated Adoption of Digital Dentistry (CAD/CAM, 3-D Printing) | +1.5% | National, early gains in corporate clinic chains and university teaching hospitals | Medium term (2-4 years) |
| High Prevalence of Untreated Dental Caries Necessitating Restorative Devices | +0.8% | National, elevated in remote and socioeconomically disadvantaged communities | Short term (≤ 2 years) |
| Emergence of Zirconia-Based Chairside Milling Materials | +0.6% | National, concentrated in practices with existing CAD/CAM infrastructure | Medium term (2-4 years) |
| Circular-Economy Regulations Spurring Low-Waste Device Designs | +0.3% | National, with pilot programs in Victoria and NSW | Long term (≥ 4 years) |
| Source: Mordor Intelligence | |||
Rapidly Ageing Population Boosting Prosthetic & Implant Demand
One in four Australians will be 65 or older by 2031, and the cohort averages 13.7 missing teeth.[1]Australian Institute of Health and Welfare, “Dental workforce 2023,” AIHW.GOV.AU This reality is fuelling purchases of chairside milling units, zirconia blocks, and titanium implants that shorten treatment cycles for fixed and removable prosthetics. A 2020 practitioner survey found that 65.5% already perform implant dentistry and 59% routinely use CBCT for planning; trends now transferring from specialists to general practices. Suppliers such as Straumann and Nobel Biocare dominate guided-surgery kits, while ISO 13356 conformity testing reassures clinicians about longevity for older patients. As digital workflows compress appointment schedules, practices can command premium pricing that offsets equipment depreciation.
Expansion of Commonwealth & Private-Insurance Dental Coverage
Federal transfers of AUD 323.4 million (USD 210 million) through 2026 are benchmarked to Dental Weighted Activity Units, rewarding throughput in public hospitals and clinics. Private health-fund members spent USD 1.6 billion on dental care in 2023 and are twice as likely to request elective prosthodontic and orthodontic services.[2]Australian Bureau of Statistics, “Patient Experiences 2024-25,” ABS.GOV.AU The Parliamentary Budget Office valued full Medicare inclusion of dental at USD 29.5 billion over the forward estimates, illustrating latent demand. Any incremental broadening of eligibility will cascade into higher consumables turnover and larger installed bases of diagnostic imaging and sterilization equipment across both sectors.
Accelerated Adoption of Digital Dentistry
Chairside systems that combine intraoral scanning, CAD software, and 3D printers are moving from early adopters to the mainstream. Planmeca’s Emerald S scanner, Creo C5 mill, and Viso G7 CBCT debuted in 2024, while Carestream released the CS 3800 wireless scanner the same year.[3]Planmeca, “Product launches 2024,” PLANMECA.COM Capital expenditure remains steep, CBCT units list at USD 52,000-97,000, but equipment leasing at 5-10% interest spreads costs over 7 years. Recent state regulatory updates add CBCT to standard radiation licences, trimming approval delays in Queensland and encouraging wider uptake. Digital accuracy reduces remake rates, further improving return on investment.
High Prevalence of Untreated Dental Caries
Forty-two percent of 5-10-year-olds have decay in primary teeth, and 25% of adults carry untreated caries. National clinical guidelines published in 2024 endorse annual checks for Indigenous children and fluoride varnish every six months for high-risk groups. These protocols translate into steady volume demand for restorative materials, burs, and endodontic files. Manufacturers such as GC Corporation introduced G-aenial A'CHORD composites and Fuji PLUS glass-ionomer to balance durability with affordability in high-throughput community clinics.
Restraints Impact Analysis*
| Restraint | (~) % Impact on CAGR Forecast | Geographic Relevance | Impact Timeline |
|---|---|---|---|
| High Upfront Cost of Advanced Equipment for Smaller Clinics | -0.7% | National, most acute in regional and rural practices | Short term (≤ 2 years) |
| Shortage of Trained Dental Technologists in Regional Areas | -0.5% | Regional and remote areas, particularly Northern Territory, Tasmania, and inland Queensland | Medium term (2-4 years) |
| Stringent TGA Registration & Post-Market Vigilance | -0.3% | National | Medium term (2-4 years) |
| Import-Dependent Supply Chains Vulnerable to Asia-Pacific Shocks | -0.4% | National | Short term (≤ 2 years) |
| Source: Mordor Intelligence | |||
High Upfront Cost of Advanced Equipment for Smaller Clinics
A full practice fit-out ranges from AUD 250,000 to AUD 500,000 (USD 162,000-324,000), with single CBCT scanners priced at USD 52,000-97,000. For solo practitioners, this equals 12-18 months of net profit, delaying the switch to digital impressions and in-house milling. Although leasing eases cash flow, rising equipment price lists Dentsply Sirona announced increases effective January 2026, which threaten operating margins for small practices.
Shortage of Trained Dental Technologists in Regional Areas
Only about 2,000 dental technicians serve the entire country, and the pipeline of graduates is thin. Regional practices face 2-3-week laboratory queues, prompting some to ship cases offshore or invest in chairside mills. Government service plans acknowledge the gap yet omit firm recruitment targets, leaving rural clinics dependent on interim solutions that stretch treatment times and patient satisfaction.
*Our forecasts treat driver/restraint impacts as directional, not additive. The impact forecasts reflect baseline growth, mix effects, and variable interactions.
Segment Analysis
By Product: Therapeutic Equipment Retains the Largest Slice While Consumables Gather Pace
Therapeutic equipment accounted for 52.88% of 2025 revenue, anchored by handpieces, lasers, and ultrasonic scalers, which are found in every general or periodontal operatory. The Australia dental devices market size attributed to this segment benefited from NSK’s Ti-Max Z95L launch in 2024 and BIOLASE’s Waterlase iPlus gains among minimally invasive dentists. Continuous improvements in tip ergonomics and torque delivery justify seven-year replacement cycles.
Dental consumables are on track for a 6.29% CAGR through 2031, outpacing growth in the total Australian dental devices market as infection-control standards such as AS 5369:2023 make single-use items more attractive in busy clinics. Gloves, suction tips, and matrix bands now represent a predictable recurring revenue stream for distributors that bundle them with autoclave service contracts.
Diagnostic equipment ranks second in value, driven by CBCT upgrades and the shift from film to digital sensors. Planmeca’s Viso G7 multi-FOV unit, released in 2024, enables practices to combine orthodontic planning with implant assessment in a single scan session. Other equipment, such as compressors and autoclaves, shows slower turnover but remains indispensable; Henry Schein’s 2024 partnership with MELAG brought a new sterilizer line to market, giving hospital buyers local service coverage.


By Treatment: Prosthodontics Dominates Revenue, Orthodontics Leads Growth
Prosthodontics accounted for 38.09% of Australia's dental device market share in 2025 as ageing patients seek implant-borne and full-arch solutions. OSSIX Volumax collagen membranes, cleared in December 2025, support ridge augmentation, enabling predictable implant placement in older jaws with reduced bone volume. High-cost biomaterials and precision titanium parts keep average procedure values elevated. Orthodontics is forecast to grow at a 7.99% CAGR, the quickest of all treatment lines. Align Technology’s palatal expander and Straumann’s Low Trimline aligners broaden clear-aligner indications to early interceptive care and adult relapse cases. AI-supported image-analysis platforms such as EM2AI, adopted by 1,100 clinics, streamline case selection and progress reviews, shortening chair time and enhancing throughput.
Endodontic cases rely on nickel-titanium rotary systems and apex locators that shorten shaping time, while periodontic and preventive procedures use ultrasonic scalers and diode lasers. Both segments exhibit steady but slower expansion, reflecting stable disease prevalence and periodic equipment refreshes.
By End User: Hospitals Still Rule Purchases, Clinics Turbo-charge Growth
Public dental hospitals accounted for 57.78% of 2025 spending, buoyed by federal block grants tied to activity units that mandate high-throughput care. Procurement committees favor robust, compliance-ready devices bundled with multi-year service guarantees, making vendors’ local after-sales capacity a key tender criterion.
Dental clinics will expand at a 9.35% CAGR to 2031, outstripping the broader Australian dental devices market. Pacific Smiles’ takeover of National Dental Care and Genesis Capital’s 2025 bid created scale economies, resulting in a 136-site network with centralized purchasing and negotiating power. Chains standardize equipment lists—often scanner-mill bundles to simplify staff training and maintenance, driving bulk orders that lift distributor volumes.
Academic institutes purchase smaller quantities but influence the preferences of graduating dentists, indirectly shaping future demand. Mobile services and aged-care providers round out the market, demanding portable X-ray units and simple sterilization solutions for on-site care.
Geography Analysis
New South Wales, Victoria, and Queensland concentrate most practitioners and therefore dominate Australia dental devices market revenue. NSW alone drew AUD 34.37 million (USD 22.3 million) in federal adult-dental funding for 2023-2025, underwriting major imaging upgrades in metro hospitals. Victoria and Queensland followed with AUD 26.88 million and AUD 21.66 million, respectively, mirroring population share. Queensland’s 2025 radiation-licence reform specifically included CBCT in the standard schedule, making adoption paperwork easier and signalling likely double-digit scanner growth over the next three years.
Western Australia, South Australia, and Tasmania remain smaller but strategically important owing to remote mining and island populations that require fly-in services. Federal allocations of USD 9-6 million per state support basic diagnostic and restorative devices in public clinics. Suppliers that offer ruggedized portable chairs and battery-operated X-ray generators capture these tenders.
The Northern Territory and the Australian Capital Territory represent the smallest slices of Australia dental devices market size yet embody policy priority for Aboriginal and Torres Strait Islander oral health. Annual fluoride-varnish guidelines and planned teledentistry pilots will drive purchases of varnish kits, intraoral cameras, and tele-consultation stations. The National Oral Health Plan 2025-2034, finalized after 235 stakeholder submissions, emphasizes equity and prevention, and suggests funding streams for preventive device categories beginning in 2027.
Competitive Landscape
Global majors Dentsply Sirona, Align Technology, Straumann, 3M, Henry Schein, Planmeca, Ivoclar Vivadent, GC Corporation, NSK, and Carestream vie for position in a moderately fragmented Australia dental devices market. Imports supply 98% of the value, with the United States, Germany, Thailand, Switzerland, and Ireland accounting for 62% of inbound shipments. Vendors pursue ecosystem lock-in by pairing scanners, mills, and proprietary materials exemplified by Dentsply Sirona’s Primescan-CEREC chain and Straumann’s SIRIOS X3-ClearCorrect suite.
Technology releases remain the primary battleground. Carestream’s CS 3800 offers real-time feedback, while Ivoclar’s ZirCAD Prime balances translucency and strength, each commanding price premiums. AI tools such as EM2AI reduce diagnostic variability, creating another moat for early adopters. Regulatory conformity to ISO 13356 aging protocols, AS 5369:2023 reprocessing, and TGA post-market vigilance is a threshold rather than a differentiator; however, alignment with 2024 circular-economy policies gives first movers an edge in public tenders.
Niche innovators also shape the field. Keystone Dental’s 2025 acquisition of Osteon Medical imported digital implant expertise from Melbourne into a global portfolio, and Orthocell’s Striate Plus licensing deal validated home-grown regenerative devices. STERIS’s USD 787.5 million dental-segment divestiture in 2024 freed rivals to capture autoclave share. Consolidating clinic chains magnify purchaser clout, pressuring unit prices yet guaranteeing volume for vendors that meet service-level agreements.
Australia Dental Devices Industry Leaders
Carestream Health Inc.
Dentsply Sirona
Envista Holdings Corporation
GC Corporation
3M
- *Disclaimer: Major Players sorted in no particular order

Recent Industry Developments
- July 2025: Griffith University introduced Nuralyte, a light-therapy device resembling an electric toothbrush, to accelerate healing after oral procedures by enhancing mitochondrial respiration and gene expression in bone-forming stem cells, transforming regenerative dentistry in Australia.
- September 2024: TGA permitted sponsors to rely on conformity assessments from comparable overseas regulators, expediting approvals for innovative diagnostic and restorative devices.
- April 2024: Impetus Dental & Medical registered an ultrasonic scaling system on the Australian Register of Therapeutic Goods, enriching the domestic hygiene-equipment catalogue.


Research Methodology Framework and Report Scope
Market Definitions and Key Coverage
Our study defines Australia's dental devices market as the annual revenue generated from new equipment used to diagnose, treat, restore, and maintain oral structures, together with single-use and reusable consumables that are routinely purchased by clinics, hospitals, and academic facilities. Devices span chair-side CAD/CAM systems, imaging units, lasers, handpieces, biomaterials, implants, crowns, and allied sundries.
Scope exclusion: over-the-counter oral-care products sold directly to consumers are not included.
Segmentation Overview
- By Product
- Diagnostics Equipment
- Dental Laser
- Radiology Equipment
- Dental Chair & Equipment
- Therapeutic Equipment
- Dental Consumables
- Other Dental Equipments
- Diagnostics Equipment
- By Treatment
- Orthodontic
- Endodontic
- Periodontic
- Prosthodontic
- By End User
- Dental Hospitals
- Dental Clinics
- Academic & Research Institutes
- Other End Users
Detailed Research Methodology and Data Validation
Primary Research
We interviewed dentists in metro and rural practices, procurement managers at three hospital networks, and distributors covering Queensland, Victoria, and Western Australia. Insights on chair-side adoption rates, average selling prices, and warranty replacement ratios allowed us to ground secondary signals and refine forecast assumptions.
Desk Research
Mordor analysts began by gathering macro and trade indicators from sources such as the Australian Institute of Health and Welfare, ABS import statistics, Therapeutic Goods Administration device registers, and the Australian Dental Association fee survey. Industry journals, listed company 10-Ks, and regulator consultation papers enriched trend spotting. Paywalled support came from D&B Hoovers for distributor revenues and Dow Jones Factiva for deal flow. These sources illustrate, rather than exhaust, the wider reading set that underpins our desk work.
A second pass compiled shipment volumes for CBCT units, quarterly benefits paid under the Child Dental Benefits Schedule, and private-health 'extras' reimbursement totals so the demand pool could be benchmarked against installed-base replacement cycles.
Market-Sizing & Forecasting
A top-down build starts with 2024 gross expenditure on professional oral care, then deducts service and OTC portions to isolate devices. Results are cross-checked through selective bottom-up roll-ups of major supplier sales and sampled ASP × unit imports. Core variables include 1) registered dentists per 10,000 population, 2) annual CBCT and intra-oral scanner imports, 3) private-health extras penetration, 4) elective procedure volumes, and 5) average clinic chair utilization hours. We fit a multivariate regression, complemented by scenario analysis for elective demand sensitivity, to project values through 2030. Gaps in supplier disclosures are bridged using three-year moving-average margins before triangulation.
Data Validation & Update Cycle
Outputs pass variance tests against historical import bills, benefit payouts, and inflation-adjusted equipment price indices. Senior reviewers challenge anomalies, and before each publication update, an analyst refreshes the model. Interim revisions are triggered by material regulatory or reimbursement shifts.
Why Mordor's Australia Dental Devices Market Baseline Is Trustworthy
Published estimates often diverge because firms vary device mixes, assume different replacement intervals, or freeze exchange rates at dissimilar points. Our disciplined scope selection, annual refresh cadence, and transparent variable mapping minimize such drift.
Key gap drivers include competitor inclusion of OTC products, omission of consumables, or reliance on dated import coefficients, which together stretch or compress totals relative to Mordor's balanced base case.
Benchmark comparison
| Market Size | Anonymized source | Primary gap driver |
|---|---|---|
| USD 231.61 mn (2025) | Mordor Intelligence | - |
| USD 1,166.4 mn (2024) | Global Consultancy A | Combines equipment and consumables, wider clinical supplies scope |
| USD 127.84 mn (2023) | Regional Consultancy A | Earlier base year, excludes imaging and CAD/CAM segments |
| USD 63.70 mn (2023) | Trade Journal B | Focuses only on diagnostic and surgical kits, omits implants and biomaterials |
Taken together, the comparison shows why decision-makers seeking a reproducible, variables-linked baseline rely on Mordor Intelligence. Our estimates sit between narrow surgical views and broad supply-chain tallies, reflecting realistic device adoption patterns and verifiable spending data.


Key Questions Answered in the Report
What is the forecast dollar value of Australia’s dental-device demand by 2031?
The Australia dental devices market is projected to reach USD 0.32 billion by 2031.
Which treatment category is expanding fastest?
Orthodontics is growing at a 7.99% CAGR on the back of clear-aligner uptake.
Why are clinic chains investing heavily in CAD/CAM?
Consolidated groups spread equipment cost across many chairs, cut lab fees, and speed same-day restorations.
How do circular-economy rules affect device procurement?
Public buyers now factor modular, repairable designs into tenders, favoring suppliers with take-back or recycling programs.
Which three states dominate public-sector purchasing?
New South Wales, Victoria, and Queensland receive the largest federal dental-funding allocations.
Page last updated on:


